
Abstract
We study the effects of the COVID pandemic on educational attainment. By 2022, entry into two-year colleges was 21 percent lower than before the pandemic, with larger declines in Black- and Hispanic-majority colleges. Four-year college entry declined by only 6 percent and then rebounded 4 percent. High school graduation reached an all-time high in 2022. To explain these patterns, we undertook an interrupted time series design. Lower numbers of COVID cases and higher levels of in-person instruction led to increased college entry and possibly increased graduation. Relaxation of graduation standards explain between-state variation in high school graduation and helps explain the continued high graduation rates. Changing labor-market opportunities do not explain cross-state variation in attainment. We suggest additional explanations for these trends. Barring other substantial changes, we predict that future college attainment will be lower for cohorts of school or college age during the pandemic, especially for some marginalized groups.
Education has been near the center of the COVID crisis in part due to a concern about what the pandemic would do to students academically, socially, and psychologically. A large and growing number of studies find that the pandemic lowered test scores and exacerbated score gaps associated with poverty and race-ethnicity, especially in districts that made more use of remote instruction (Bacher-Hicks, Goodman, and Mulhern 2021; Betthäuser, Bach-Mortensen, and Engzell 2022; Goldhaber, Kane, et al. 2022; Halloran et al. 2021; Lewis et al. 2021; Sass and Goldring 2022; Thorn and Vincent-Lancrin 2021; West and Lake 2021). These score gaps may foreshadow large and negative economic impacts in the future (Goldhaber, Kane, et al. 2022; Hanushek and Woessmann 2020). Others have found evidence of declining mental health and stunted emotional development (Blanchflower and Bryson 2022; Czeisler et al. 2020), which may also have long-term repercussions.
Some research has also examined educational attainment, especially overall K–12 enrollment and college enrollment. Thomas Dee and his colleagues, for example, reported a sharp drop in kindergarten enrollments and smaller effects on enrollment in higher grades (Dee and Murphy 2021; Dee et al. 2021). Also, the National Student Clearinghouse (NSC 2022) reported declining college enrollment, especially in two-year colleges.1 Remote and hybrid schooling was likely a key factor, which is troubling given the limited evidence that COVID education policies had much benefit for public health (Harris, Ziedan, and Hassig 2021), especially when masking and vaccine policies were in place (Chernozhukov, Kasahara, and Schrimpf 2021; Goldhaber, Kane, et al. 2022).2 However, we show that COVID triggered other changes, which were partly conflated with instruction, that may also have affected attainment.
We make four contributions to this discussion. First, we examine two forms of educational attainment that have received little attention in the COVID literature: high school graduation and the transition from high school to college. Others have reported trends in the total number of students attending college. We focus on initial college entry, as distinct from other influences such as dropout and persistence. High school graduation and college entry are both key stepping stones to further human capital investment that are critical to individual well-being and macroeconomic growth. It is therefore important to document pandemic-related trends in these outcomes.
What effect did COVID have on high school completion and college entry during the first year of the pandemic? Given the declines in achievement and enrollment observed in every other study, and the apparent decline in the ability of educators to engage students in a pandemic, we expected similar declines in high school graduation and the transition to college. For college entry, our results confirmed our expectation. The transitions from high school to college dropped significantly—by 16 percent in two-year colleges and 6 percent in four-year colleges in 2021 relative to the pre-pandemic period. In 2022, two-year entry dropped even further, by 21 percent, whereas four-year entry rebounded to just 2 percent below 2019 levels.
But we find a very different pattern for high school graduation, which actually increased slightly in 2020, dipped slightly in 2021, and then rebounded in 2022 to an all-time high. As far as we know, high school graduation was the only educational outcome to improve during the pandemic. Given the decline in the quality and engagement of schooling during this period, this is a somewhat surprising result.3
Second, how did educational attainment patterns vary by student subgroup and sector? We found that the improvement in high school graduation was broad based. Though marginalized groups saw larger drops in 2021, they also saw larger rebounds in 2022. For every subgroup, high school graduation rates were at least as high in the spring of 2022 as in the pre-pandemic spring of 2019—and in some groups notably higher.
College entry, however, saw sharp drops, especially in two-year colleges serving high percentages of Black and Hispanic students. The changes were more muted at the four-year college level, and change seemed to be associated with colleges’ racial and ethnic composition rather than their economic levels. The rise in racial and ethnic inequality in college entry is a sign that COVID may have long-lasting effects on economic inequality.
Third, what policy and environmental factors explain variation in the pandemic’s effects in different institutions and states? Prior studies have focused on how schools and colleges varied in their COVID instructional modes. But, especially with high school graduation and the transition to college, the human capital model suggests that a variety of other factors were likely at play, including a change in academic standards and opportunity cost (labor-market opportunities) for teenagers. We include proxies for these and other explanations in an interrupted time series analysis that includes district-institution fixed effects and unit-specific time trends. Despite the noted differing trends in high school graduation and college entry, variation in these trends nationally can be explained by common factors. Lower numbers of COVID cases and higher levels of in-person instruction led to increased college entry and possibly increased higher graduation. Relaxation of high school graduation standards is the one factor that seems to explain the differing trends because, anecdotally, high school educators were directed to ease the burden on students during the difficult pandemic period. We find some direct evidence of this in states with high school graduation exams that also reduced their academic standards and saw higher graduation rates during the pandemic. Finally, differential labor-market opportunities do not seem to explain variation in any of the attainment measures.
Fourth, why are the results so different across the various age groups and levels of the educational system? We observe four main patterns when we juxtapose our results with prior studies: smaller enrollment declines in high school than in earlier grades; larger declines in kindergarten than in other elementary grades (Dee and Murphy 2021; Dee et al. 2021; Musaddiq et al. 2022); small increases in high school graduation but large declines in the transition from high school to college; and larger declines in two-year than in four-year college enrollment.
We offer three plausible explanations for these patterns based on social science research. First, entry, persistence, and completion are different processes. Both kindergarten and college entry are forms of entry and were negatively affected by the pandemic, whereas high school graduation, a form of persistence, was much less affected. Second, one reason for the difference between entry and persistence is that teenagers’ social bonds to their friends make them likely to persist in and complete high school and college once they have entered. Last, two-year colleges and students differ from those at the four-year college level in multiple ways that may explain the larger drops in two-year college enrollment.
THEORY
In addition to empirically focusing on the effects of the pandemic and pandemic-related education policies, we use human capital theory to identify COVID-related factors that might have affected educational attainment. The theory highlights factors that changed during the pandemic and are theoretically connected to education attainment decisions.
One key economic factor in the standard human capital model is the opportunity cost of missed work. This certainly changed during the pandemic—first with a decline in opportunity as the economy shut down and then with an upward spike in later years as firms had trouble hiring workers. In addition to opportunity cost, a more direct cost of education was the threat to physical health posed by COVID to individuals and their vulnerable friends and family members.4 This is not a cost normally considered in the human capital model because, under normal circumstances, this cost is miniscule, but the health risks were higher for some jobs during the pandemic.5
The return to education is also central to the human capital model and may also have changed during the pandemic. Research consistently shows that students learn less online (Xu and Jaggers 2013; CREDO 2023) and young people may have realized that education credentials under these conditions would have less value. Similarly, labor economists emphasize the consumption value of education (psychic costs). If remote instruction, or in-person instruction with masking, is less engaging, then the consumption value may have declined in parallel with the decline in investment value.
Expected economic returns are also affected by the probability of competing credentials, conditional on starting an education investment. One factor affecting this probability is government- and institution-imposed academic standards. For example, many states require that high school students pass a graduation exam in order to receive a credential.6 As we explain, there are also reasons to expect that standards changed during the pandemic in a variety of ways that may have affected the education decisions of young people.
This discussion suggests four main factors that changed as a result of the pandemic that, according to human capital theory, might have affected students’ education choices during this unusual period: instructional mode, relaxation of academic standards, economic opportunity, and actual levels of COVID infection. We discuss our measures of these constructs in the following section. Our analysis focuses especially on the mechanisms behind attainment changes during the 2020–2021 school year (what we simply call 2021).
DATA
This section discusses the data for the high school and college analyses, respectively. In each section, we start with a discussion of the educational attainment measures, followed by the potential explanatory factors associated with the respective outcomes.
High School Data
Graduation Rates
We study high school graduation rates, by school district, at both traditional public and charter schools. Forty-four U.S. states have made graduation data available through the spring of 2021, and twenty-four have also provided graduation data for the spring of 2022.7 The 2021 sample includes essentially the entire country. The 2022 sample overrepresents southern and politically conservative states, covering less of the Northeast, upper Midwest, and Great Plains. This is worth noting given that remote instruction and other COVID-cautious policies were more common in politically liberal states (Grossman et al. 2021; Harris and Oliver 2021). In all, of roughly ten thousand regular school districts, we have data for 7,789 in 2021 and 3,661 in 2022. The smaller figure, for 2022, encompasses 53 percent of total national enrollment.8
One advantage of using high school graduation data is that states are required to use a single measure, the adjusted cohort graduation rate (ACGR), which is standardized and mandated for all states by the federal government. The ACGR divides the number of graduates by the number of students enrolled in the same school or district in their freshmen year or who transferred in, subtracting from the denominator the legitimate exits, such as transferring out of the district or into homeschooling. Nonlegitimate exits count against the school or district (that is, they reduce the graduation rate) and dropout is the most common example. Missing data are also counted as nonlegitimate exits and reduce the graduation rate.
The question arises whether graduation trends could be influenced by pandemic-related trends in legitimate exits. Transfers to private schools or homeschooling increased during the COVID pandemic, changing the denominator of official graduation statistics.9 Students transferring to private schools likely had higher family incomes and achievement levels than those who stayed in the public sector, which implies that private school transfers deflated the public school graduation rates—that is, the increase in public school graduation rates would be larger if adjusted for student achievement and family incomes. The effect of increased homeschooling on public school graduation rates is not as clear because we do not know the dropout probabilities of families who chose to homeschool during the pandemic. During normal times, homeschooling families tend to be more religious, with fewer mothers in the paid workforce than other families, but during the pandemic, when schools were perceived as dangerous and many employed parents stayed home, the demographics of new homeschoolers were very likely different. Although we cannot observe outcomes for transfer students and homeschoolers, we do approximate the total number of high school students transferring out of each district by examining changes in the cohort size.10
Among the state policies that might also have affected high school graduation rates during COVID are accountability and school funding. All states are required to include high school graduation as part of school accountability, giving schools incentives to make these percentages as high as possible, either through genuine school improvement or strategic behavior (Harris et al. 2023). Schools also usually have incentives to keep students enrolled to the extent that total funding comes from state and federal sources where revenue is based on enrollment levels. This could create some incentive to hold students back and have them repeat grades, but mechanisms for retaining children were limited because high-stakes tests were suspended in 2020 and 2021. In addition, emergency federal aid flowed to schools during the pandemic, reducing incentives to game enrollment to achieve revenue gains; and some states instituted hold-harmless provisions that delinked enrollment and funding in the short run.
We note three issues of data quality. First, federal rules require schools and districts to provide documentation to states to verify transfers, but doing so may have been more difficult during the pandemic. If transfers were undercounted, then true graduation rates may have been even higher than our estimates. Also, high school graduation data are missing at much higher rates for subgroups. Many states that report overall graduation by district do not report any data for subgroups such as Black students, Hispanic students, or economically disadvantaged students. Even in states that do report subgroup graduation rates, we cannot report results for groups defined by two variables—for example, Black students who are not economically disadvantaged. In other states, cell-size requirements lead to some additional missing data; however, we show later that missing data likely does not explain our findings. Last, the criteria for receiving free lunch—a common indicator of poverty—broadened during the pandemic and we are unsure how this affects the definition of subgroups in the outcome data.
Instructional Mode
For high school instructional mode, we use data from the Return to Learn (R2L) project of the American Enterprise Institute (AEI), which monitored more than 8,500 public school districts’ instructional status on a weekly basis. With data collection and validation assistance from the College Crisis Initiative (C2i) at Davidson College, R2L began scraping websites of regular, noncharter, public school districts with at least three schools in September 2020. Each week, AEI and C2i then validated the results of the algorithm by calling districts and manually searching district websites and social media pages to confirm district mode of instruction when needed. R2L categorizes school districts as in-person, hybrid, or remote. Districts are categorized as in-person if all grade levels can attend school in the buildings five days per week and families can still opt for fully remote instruction or a hybrid model. Hybrid districts either allow students in some grades to return to buildings in person whereas other grades can only return in a hybrid or remote model or all students can return to buildings for four days or less each week while learning remotely the rest of the time. Finally, a district is defined as remote when all grade levels above first grade participate in virtual instruction five days per week, with no option for in-person or hybrid learning.
Our specific treatment variable is the share of days that schools were in each instructional mode during 2021.11 High school graduation comes at the end of the school year, so the instructional modes used throughout the year are relevant. Consistent with prior research using national samples, our data show that the hybrid category is most common, followed by in-person and fully remote. We code each district’s instructional modes in terms of the share of weeks in each mode for the academic year (that is, as a continuous variable).
Academic Standards
For the high school analysis, we use data regarding state standards from Education Week (2021), which summarize three main types of standards that could have been relaxed: time in school, testing and grading, and credit hours.
Time flexibility. Two types of time-related policies emerged: allowing students to delay completion of requirements (such as to later in the summer), or allowing students reduced attendance during the academic year. Of the states that are part of our 2021 analysis, all but one reported some type of time flexibility. In the vast majority of cases, the laws are written to give districts more flexibility than they would normally have, but we cannot observe district decisions.
Testing flexibility. Almost all states eliminated testing requirements at least for the 2020 school year. Some state policies also mentioned relaxation of grading policies. We did not count these in the index, however, because grading is already at the discretion of school districts, and state guidance on this dimension does not bind school practices. We also ignored relaxation of rules pertaining to high school equivalency because GEDs (general educational development) are not counted in the high school graduation rate data we are reporting. For some states in the Education Week data, relaxation of standards was evident for a single, noncore test such as civics, but we did not count this as a relaxation of standards because of the narrow flexibility this entailed.
Seventeen states had graduation exams before COVID and may have eliminated these as a requirement for graduation.12 Of these states, six are in our sample: Florida, Indiana, Nevada, Ohio, Virginia, and Washington. In our regression estimates, we include a variable for GradExam (interacted with the relaxation of standards) because the effects of a relaxation of standards is likely to have a stronger effect when graduation exams exist.
Credit flexibility. Other than testing requirements, the main connection between state and local policy is credit hours and course requirements. Many states instituted policies indicating that students on track to pass classes before COVID could pass their courses in the spring of 2020 based on that past performance.
Creating a single measure of relaxed standards. We first coded each state as having relaxed each of the three forms of standards (time, tests, and credits) and then took the simple sum of these as an index of relaxation of standards (min = 0, max = 3). Some states offered blanket flexibility on graduation requirements and we code these states with the maximum of 3 on the index.
These measures of academic standards are imperfect in several ways. First, we cannot observe district standards or enforcement, the latter of which might have been more lax at the district level even without a relaxation of state standards, especially in a pandemic. Also, in most cases, districts are already allowed to impose standards that are stricter than those imposed by the state. Thus some districts might have relaxed standards even without state action.
An additional source of uncertainty pertains to the years for which the policies apply. Some states explicitly limited the policy to the graduating class of 2020, but in others it is unclear. It is possible, for example, that the states relaxing their standards in 2020 also did so for the 2021 graduating class, but we do not observe this.
External Validity
We are interested in drawing conclusions about student outcomes and their pandemic-related causes for the nation as a whole. Although we have nearly complete national data on high school graduate through the spring of 2021 (N = 44 states), we do not for 2022 (N = 24 states; 53 percent of national enrollment). To address this missing data, we calculated the differences in mean covariates for the included and excluded states. Shown in table A.2, these show that the excluded states are generally quite similar on these measures. We provide additional tests of external validity in the following section using the high school graduation measures themselves. We do not provide comparable tables for the college data because the Integrated Postsecondary Education Data System (IPEDS) data include essentially all colleges in the United States.
College Data
Similar to the discussion of high school data, this section discusses our college outcomes and the factors we study that might explain variation across institutions.
Enrollment
College enrollment data come from the National Center on Education Statistics (NCES) IPEDS, which includes essentially all public and private colleges in the United States. We focus particularly on first-time, full-time degree or certificate-seeking undergraduate students who graduated from high school in the past twelve months, collected by NCES as part of the fall enrollment survey—what we call immediate entry or the transition to college.13 We focus on college entry in part because most analyses have focused on total college enrollment; entry is one part of enrollment that is closely related to our other focus—on high school graduation.
Unlike the high school graduation data, IPEDS provides no breakdown by racial/ethnic or income subgroups for postsecondary entry. But we can still address equity of outcomes by reporting the results by institution-level demographics. We break institutions into four racial-ethnic categories: >50 percent Black, >50 percent Hispanic, >50 percent White, and Other. By construction, the Other category includes institutions that are racially diverse so that no group exceeds 50 percent. We also break institutions into two categories indicating whether Pell grant dollars per student—a proxy for financial need—are above or below average.
Instructional Mode Data
The College Crisis Initiative panel dataset captures nearly three thousand two-year and four-year institutions’ daily instructional modes during the fall of 2020 (Marsicano et al. 2020). To collect data, C2i built a web crawler to check institutional websites and announcements every day and code information into seventeen instruction categories. Data was then validated by C2i student employees for quality assurance. We condense the seventeen categories into a four-category version that is similar to the K–12 data, which facilitates comparability across these education institutions.
We focus on college instructional mode as of September 15, 2020. This is because, as noted, the college analysis focuses on the transition from high school to college in the fall semester and we expect those decisions to be based on the instructional mode at the beginning of the school year.
Data Common to High School and College
Labor-Force Participation
Our analysis is mainly focused on teenagers leaving high school or entering college. The pandemic affected work opportunities for this group in complex ways, which varied over time. Early in the pandemic, in the spring of 2020, the unemployment rate spiked as businesses were forced to shut down. Businesses that employ large numbers of teenagers, such as restaurants and stores, were exceptionally hard hit. The job market then gradually improved as businesses began to reopen.
We considered several measures of economic opportunity. We ruled out the unemployment rate because the denominator of this rate includes only those in the labor force and participation in the workforce dropped precipitously during the pandemic and remained well below prior trends throughout the years in our analysis. We also consider job openings to get around this problem, but these data are only available down to the state level.
As a result, we view the labor-force participation (LFP) rate as the best indicator of job opportunities, relying on county-by-year data from the U.S. Bureau of Labor Statistics (BLS). Because the BLS reports calendar years instead of academic years, the main pandemic period data we have is for the 2020 calendar year, which covered the first nine months of the pandemic. The 2021 LFP data were not available at the county level as of this writing.
COVID Community Spread and Risk
For institutions that were in-person, students might have been concerned about the health effects of attending school or college in-person. We measure this perceived risk using the county case rate data from the New York Times. Although actual risk is likely better reflected in hospitalization data (Harris, Ziedan, and Hassig 2021), COVID cases were more widely reported and therefore were likely a better measure of the risk perceptions that weighed on educational decisions. Given the possible connection between COVID transmission and instructional mode, we test for an interaction between the two, as described in the next section.
ECONOMETRIC FRAMEWORK
In this section, we outline the model we estimate. As our intent is to estimate the causal effects of these various factors on educational attainment, we also discuss associated threats to identification.
Model
The previous discussion suggests that many factors, or treatments, might have affected educational attainment during the pandemic. This rules out methods such as difference-in-differences (DID) and comparative interrupted time series (CITS), which are premised on the existence of a single, usually dichotomous, treatment. In this case, however, we have multiple, continuous treatment measures. CITS and DID are infeasible in this setting and we therefore use an interrupted time series design with an untreated comparison group. When the high school graduation rate is the dependent variable, we specifically estimate as follows:
where Graddt is the graduation rate for district d in year t. Timedt is a district-specific linear trend, and θd is a district-specific fixed effect. These account for differences in pre-pandemic district outcome levels and trends that might have been correlated with the explanatory variables of interest. We also cluster standard errors at the district level.
The variable LFPkt is the labor-force participation rate in county k and year t. The change in negative in almost all counties under the pandemic, so the variable really captures the degree to which LFP dropped. The variable InstrModedt is a vector of variables indicating the share of weeks in-person and remote (with hybrid is the omitted category).
StdRelaxst is an index of standards in state s where higher values reflect greater relaxation of standards (see above). GradExams is an indicator for whether a state had a graduation exam before COVID. Coded in this way, GradExams is time constant, so we do not include the variable separately, but do include the interaction with StdRelaxst because the extent of standards relaxation is most likely to play a role in states that had a state graduation exam.
COVIDkt is of the number of reported COVID cases in the county. We include this separately and interact this with instructional mode because we might expect COVID prevalence to play a larger role in schools and colleges that are operating in-person.
The model is slightly different for college entry. The dependent variable is now initial college entry and the state standards and graduation exams are no longer relevant. Also, the unit of analysis shifts from districts to colleges c, so we cluster standard errors at the college level and we include college fixed effects and college-specific linear time trends. We identify the counties that each college officially serves and aggregate LFPkt to this level. These adjustments yield the following equation:
where ln(Entryct) is the natural logarithm of the number of immediate entry enrollments at college c in the fall of 2020, θc is now a college fixed effect, and Timect is the college-specific linear time trend.
As in equation (1), hybrid is the excluded category, but the C2i data include more categories that we combine into an Other category that is included along with in-person and remote. Although these specifications do not have an explicit post indicator for the start of COVID, most of the estimates are implicitly identified from pre–post changes. To see why, note that the COVID variable is zero, and the InstrModect variable is coded as entirely in-person for all the pre-COVID periods.14 We also estimate more extensive versions of equations (1) and (2), adding interactions between school/college race and the other variables.
Threats to Identification
Including state and district fixed effects accounts for time-invariant unobserved district characteristics, which research shows to be strong predictors of school reopening decisions; in particular, the strongest predictors have been demographics and local politics (such as percentage Republican vote), which are largely constant within local geographic units over this short time frame (Grossman et al. 2021; Harris and Oliver 2021). These and other time-constant factors, such as neighborhood composition, are accounted for with unit-specific time trends and district or college fixed effects in equations (1) and (2), respectively.
By including multiple treatment variables, we further reduce the possibility that our results reflect some other mechanism. For example, if we only included instructional mode, and this is correlated with COVID cases, then we would conflate the role of these two factors. We make no claim that we have accounted for everything that might have affected high school graduation and college entry. For example, some working parents chose to move and live with family members who could support for remote learning for their children. This could bias our estimates as such moves are time-varying shocks that are contemporaneous to the start of the pandemic and the changes in the various treatment variables.
RESULTS: TRENDS IN ATTAINMENT
In this section, we provide results for trends in high school outcomes, overall and by subgroup, then do the same for college outcomes.
High School Graduation Trends
We are interested, first, in the change in overall graduation rates that can be reasonably attributed to the COVID pandemic. We have three post-treatment years: 2020 graduation occurred just a few months after the start of the COVID crisis; the 2021 and 2022 school years followed entire school years of COVID-affected learning.
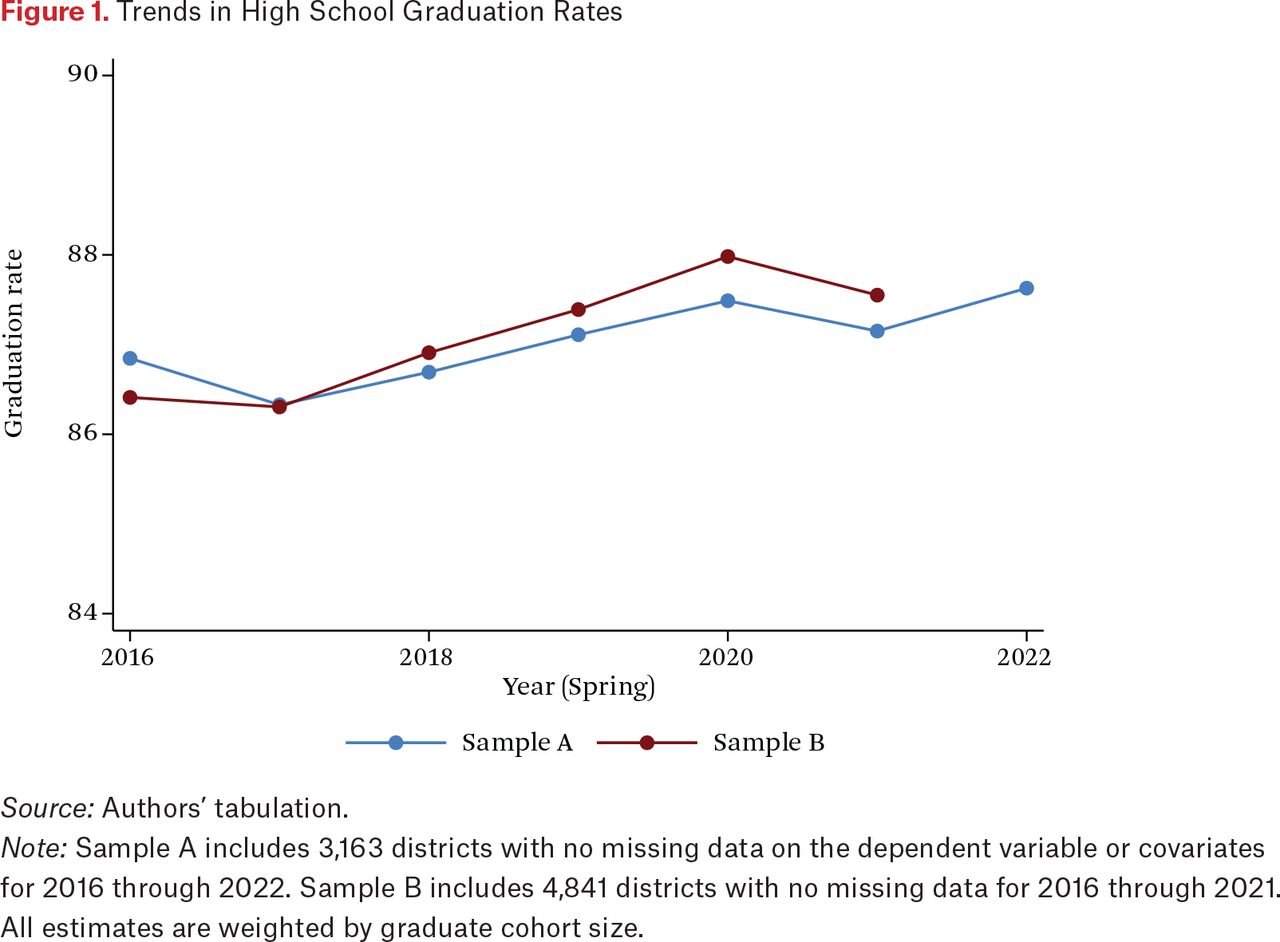
Figure 1 shows the annual trends in high school graduation from 2016 to 2022. High school graduation rates increased every spring from 2017 to 2019, continued increasing in 2020 despite the pandemic, dropped slightly in 2021, then rebounded in 2022 to a new record high. Although the 2022 figure is still below what we might have expected based on the pre-pandemic trend, it is still the only education outcome to our knowledge that improved, in absolute terms, during the pandemic.

Trends in High School Graduation Rates
Source: Authors’ tabulation.
Note: Sample A includes 3,163 districts with no missing data on the dependent variable or covariates for 2016 through 2022. Sample B includes 4,841 districts with no missing data for 2016 through 2021. All estimates are weighted by graduate cohort size.
We show the results for two samples of states. Sample A has data through 2022 for twenty-four states. Sample B has data for forty-four states, but only through 2021. We compare the trends as a check on external validity of the less complete 2022 data. The results show that both the level and trends in high school graduation were very similar between the two samples. In each year, the high school graduation rates of the two groups of states are within one percentage point of each other. We also found that the covariate means are quite similar in the two samples (see table A.2). For this reason, it seems likely that the 2022 results, though based only on the twenty-four states in sample A, are representative of the nation as a whole (see also appendix figure A.1).
Another potential problem with these trend lines is the transfer of high school students from publicly funded schools to homeschooling and private schools. Graduation rates may have increased because either the numerator (number of graduates) increased or because the cohort sizes decreased, or both. For example, if eleventh graders with lower-than-expected graduation rates transferred to homeschooling, then that alone could account for the increased graduation rate among students who stayed in public school. Moreover, we might have expected this type of transfer to be especially high in certain kinds of districts. Tareena Musaddiq and her colleagues (2022) find that transfers to homeschooling were most common in in-person districts, though this finding pertains to Michigan and might not apply to this broader sample or at the high school level.15
We tested whether the change in graduation rates was an artifact of a change in the denominator by plotting the trends in the number of graduates, which track the changes in rates (see figure A.2).16 In other words, if the continued rise in graduation rates had been due to a continued decline in the cohort sizes, then this would have implied that the trends were presenting a misleading picture of graduation. Our results therefore reinforce that the increase in high school graduation was not mainly due to transfers.
High School Graduation Trends by Subgroup
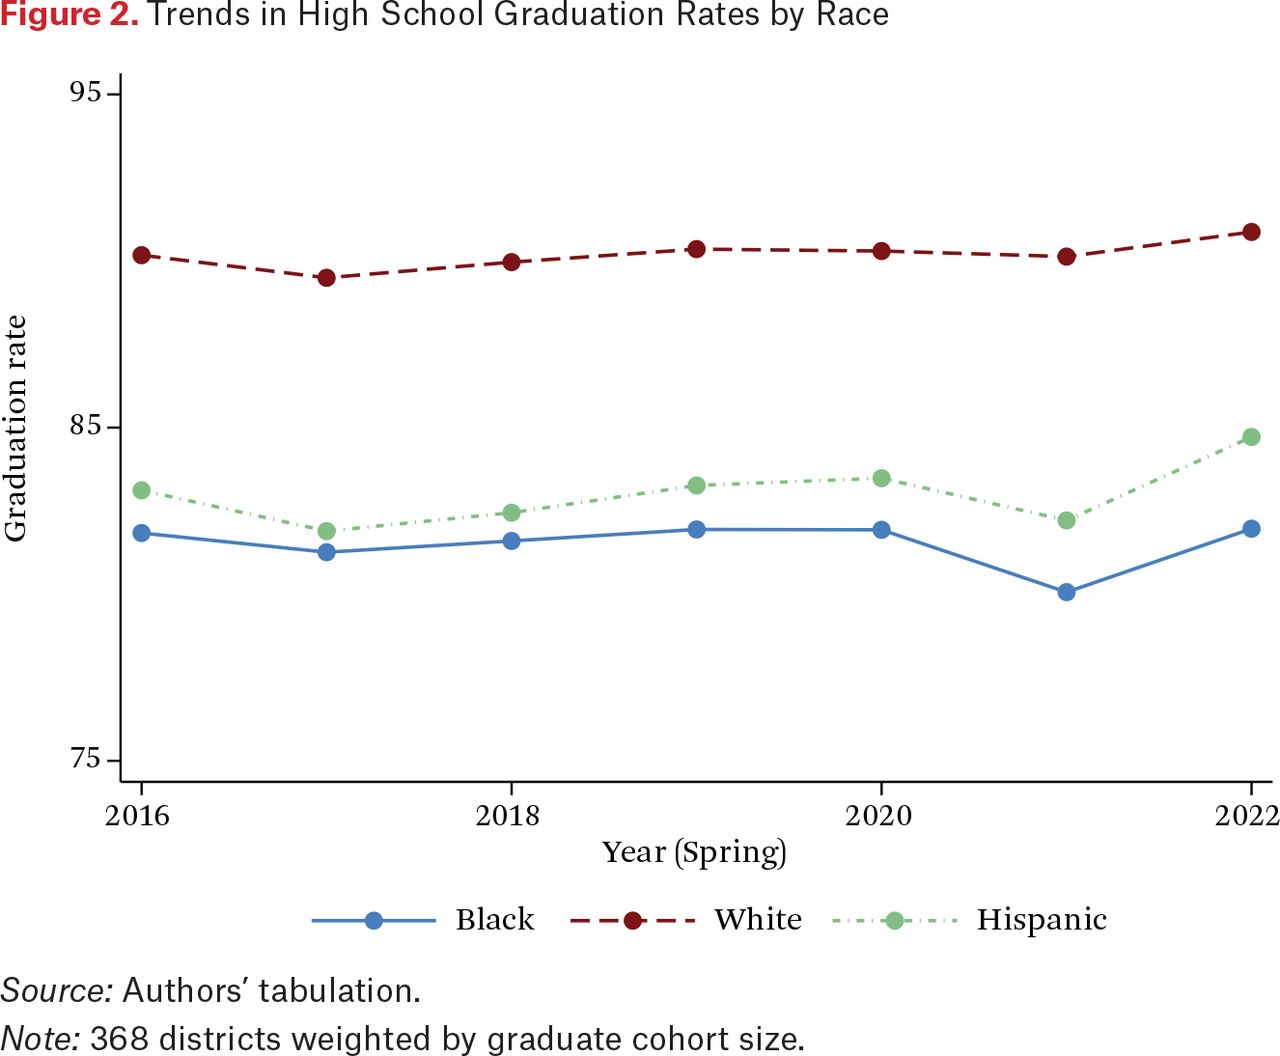
Figure 2 shows high school graduation trends by race; figure 3 shows graduation trends for students by free lunch eligibility and for English-language learners and students with disabilities. Students in certain racial subgroups (such as Asian Americans) are not included because very few districts had large enough samples to support such reporting.

Trends in High School Graduation Rates by Race
Source: Authors’ tabulation.
Note: 368 districts weighted by graduate cohort size.

Trends in High School Graduation Rates by Poverty, Disability, and Language Status
Source: Authors’ tabulation.
Note: 476 districts weighted by graduate cohort size.
For every reported subgroup, high school graduation rates were at least as high in 2020 as 2019—and reached an all-time high in 2022. In fact, the largest increases seem to have occurred for the most disadvantaged groups. Black and Hispanic students, as well as students with disabilities, economically disadvantaged students, and English-language learners, all saw larger increases than White students.
A limitation of the analyses in figures 2 and 3 is that subgroup high school graduation data are missing for most states in recent years. To test whether our results may be nonrepresentative of the nation as a whole, we reconstructed the figures, assigning the district-level demographics to the district’s overall graduation rate, so that essentially no data are missing. Predictably, this tends to even out the graduation levels and attenuate spikes and creates some deviations from the prior results (see figures A.5 and A.6). Although graduation bounced back in 2022 for all subgroups in the earlier results, this was not the case for those with high percentages of disabled students in the additional appendix figures. Finally, although high school graduation generally rebounded to reach all-time highs, this was not the case for every subgroup. Thus the results are broadly robust, but the missing data problem makes it difficult to interpret these exceptions.
One reason for the disproportionate increases in high school graduation among students with disabilities was suggested to us by a state education administrator in charge of special education who argued that these groups had a harder time meeting high school graduation requirements before COVID. The relaxation of these standards in many states may therefore have had a disproportionately positive impact on their ability to graduate. The same argument may apply to English-language learners.
College Entry Trends
We report immediate college entry for all colleges reported in IPEDS, separately by two- and four-year sectors. The years attached to the data always refer to the spring, so the college data need to be interpreted differently than the data for high school graduation. The number 2020, for example, refers to the 2019–2020 school year in both the high school and college analyses, but the high school data are based on spring 2020 graduation and the college entry outcome is based on fall 2019 enrollment. This means that we only have two post-treatment years, 2021 and 2022, for the college entry data and the 2020 school year is entirely pre-pandemic. We use only the sample of colleges with complete data.
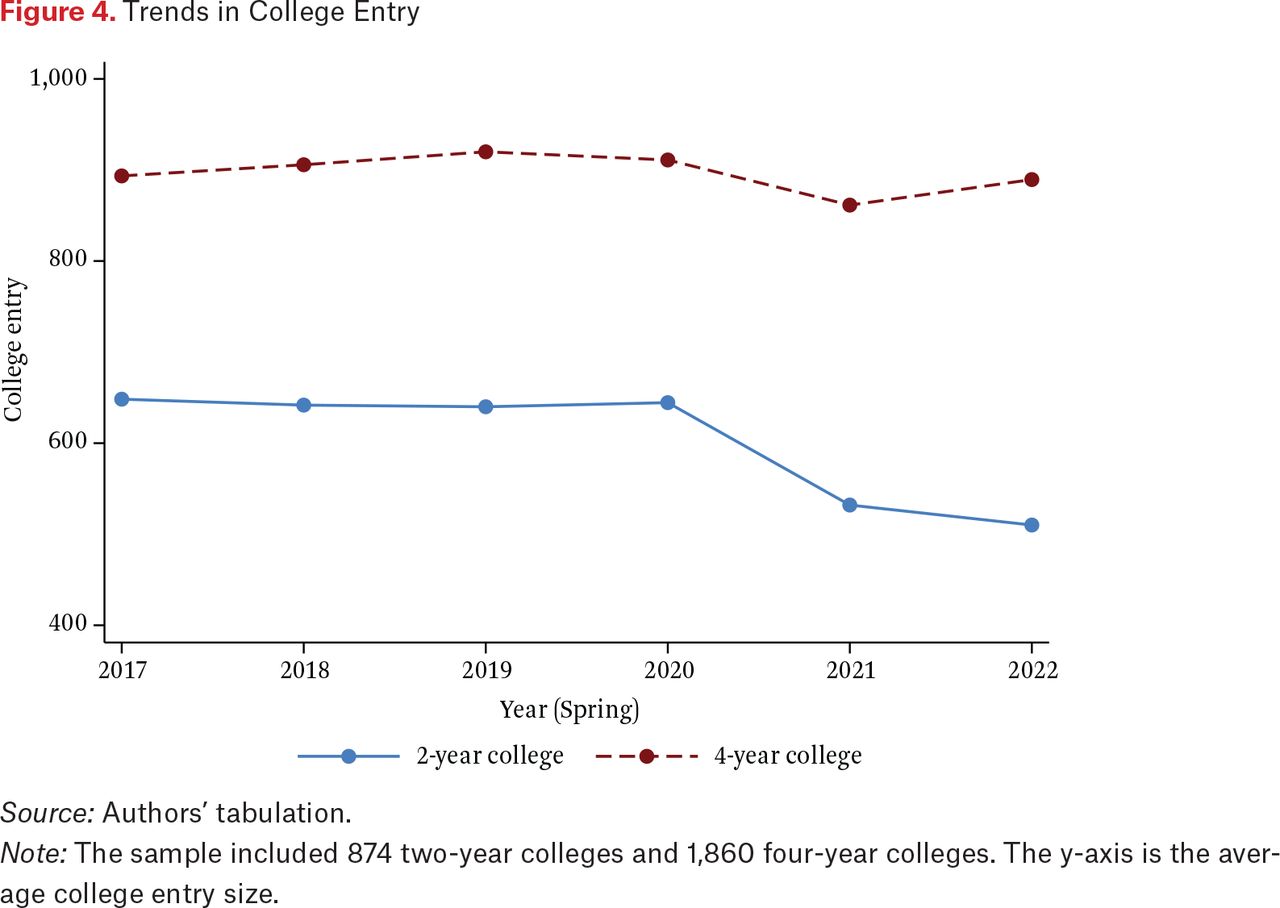
Figure 4 shows that after four years of stability before the pandemic, college entry dropped sharply in the first pandemic year. The drop was 16 percent in two-year colleges and 6 percent in four-year colleges. In four-year colleges, there was a rebound in 2022, when enrollments were only 2 percent below 2020 levels, but entry for two-year colleges continued to drop in 2021 to 21 percent below 2020 levels. Juxtaposed with rising high school graduation rates, the drop in college entry is even worse than it looks. The number of potential college entrants was rising, but fewer of them were deciding to proceed.

Trends in College Entry
Source: Authors’ tabulation.
Note: The sample included 874 two-year colleges and 1,860 four-year colleges. The y-axis is the average college entry size.
A drop of this size is unusual, especially in recent decades. The 21 percent drop at the community college level is almost as large the entire 27 percent drop in initial entry from 2008 to 2019 (Garrett 2019). It is difficult to compare with earlier decades because initial college entry was not commonly tracked until recent years. However, even the smaller 10 percent drop in total enrollment appears at least as large as any other dip dating back to 1970 (U.S. Census Bureau 2023).
College Entry Trends by Subgroups
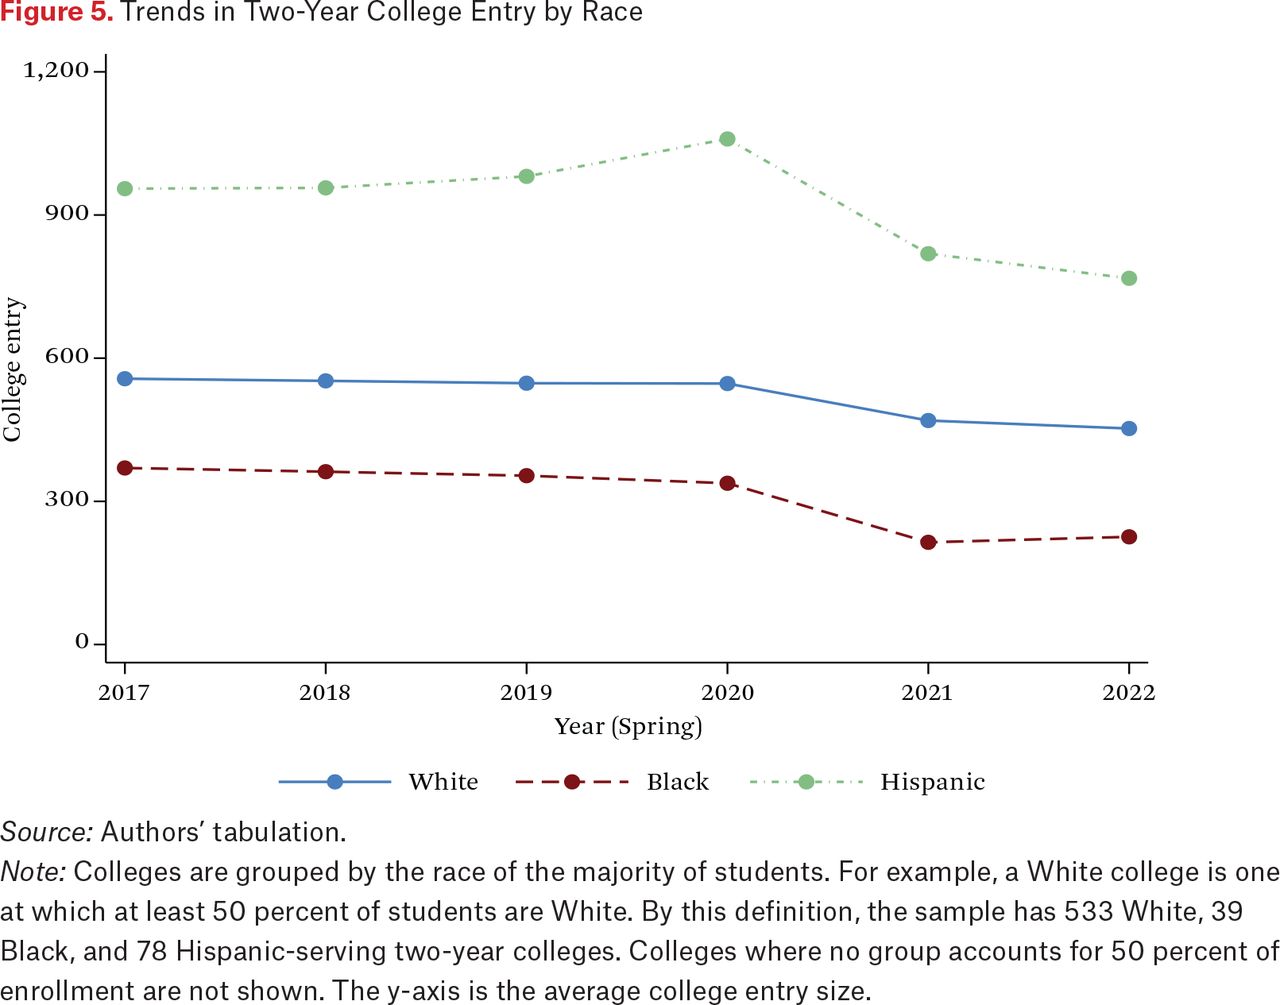
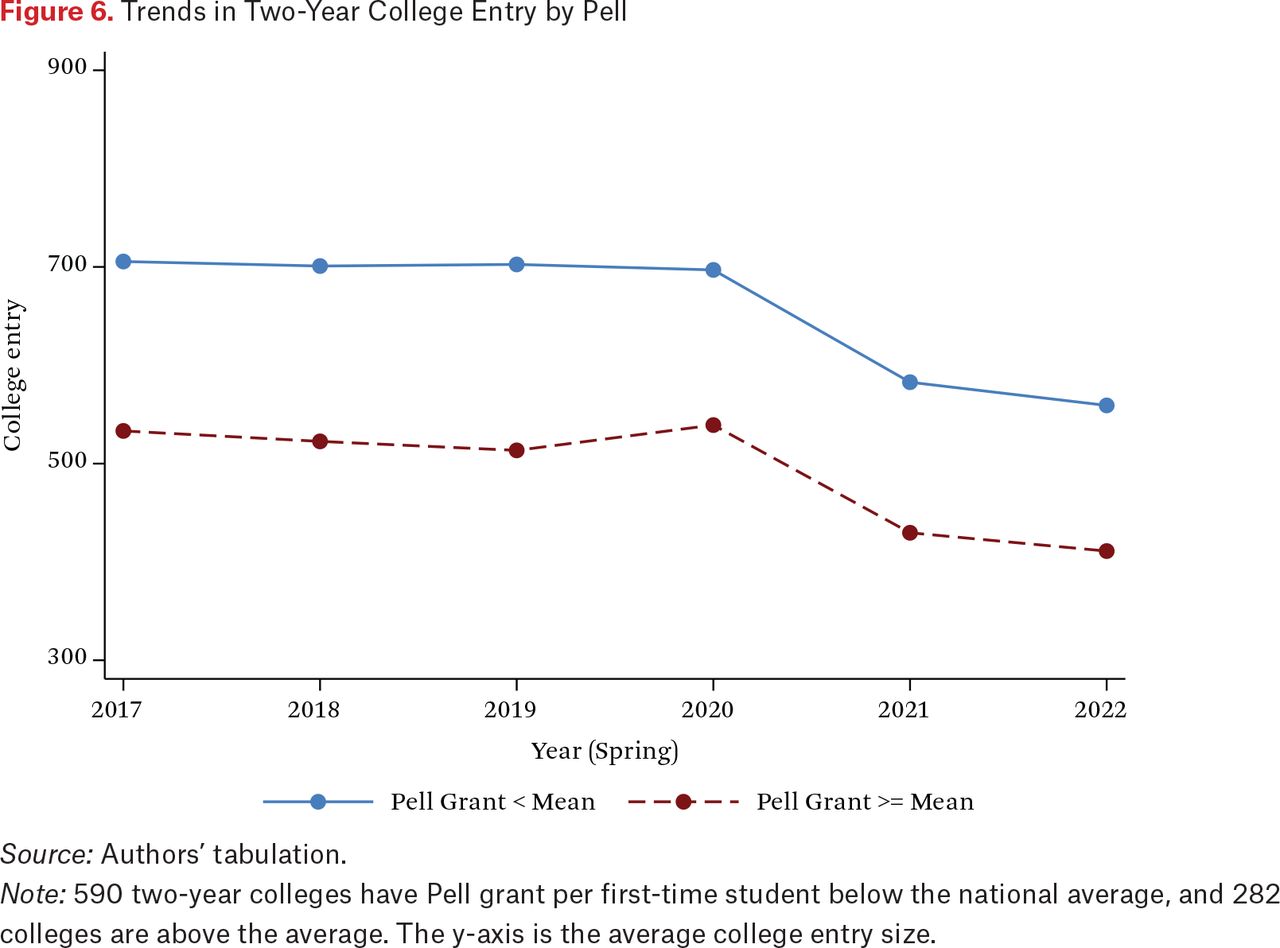
IPEDS does not report college entry by demographic subgroups, so instead we report entry trends by institution-level characteristics: average Pell grant dollars per student and the percent from each race-ethnicity. Figures 5 and 6 show that, in the two-year college sector, entry declined across all demographic groups, but declined most steeply at Hispanic- and Black-serving institutions.17 We also see no evidence of a 2022 rebound for any subgroup. COVID reduced college entry and those low levels have continued.

Trends in Two-Year College Entry by Race
Source: Authors’ tabulation.
Note: Colleges are grouped by the race of the majority of students. For example, a White college is one at which at least 50 percent of students are White. By this definition, the sample has 533 White, 39 Black, and 78 Hispanic-serving two-year colleges. Colleges where no group accounts for 50 percent of enrollment are not shown. The y-axis is the average college entry size.

Trends in Two-Year College Entry by Pell
Source: Authors’ tabulation.
Note: 590 two-year colleges have Pell grant per first-time student below the national average, and 282 colleges are above the average. The y-axis is the average college entry size.
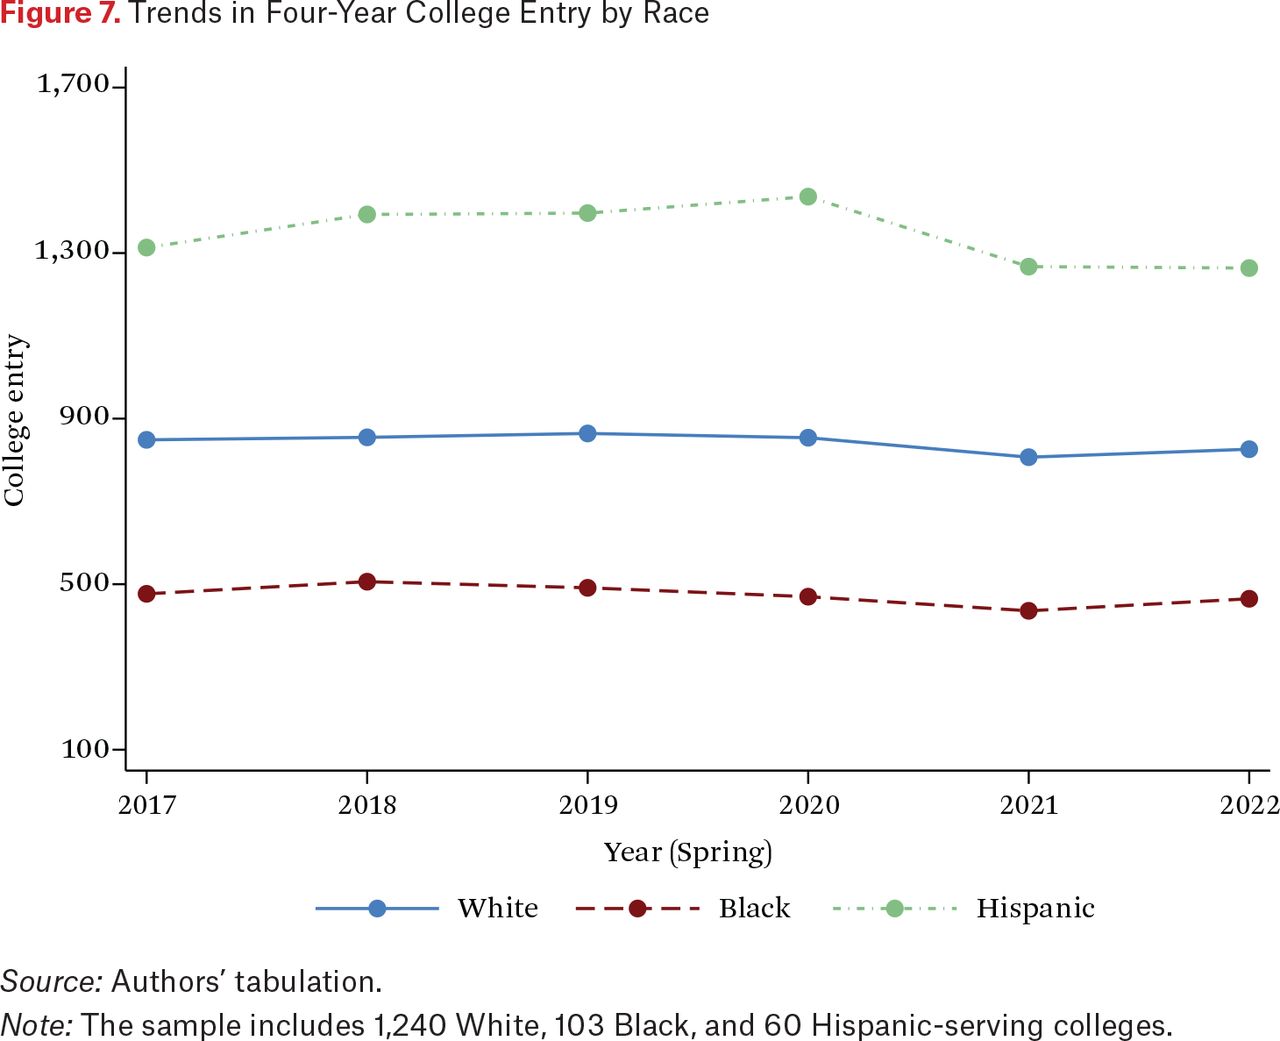
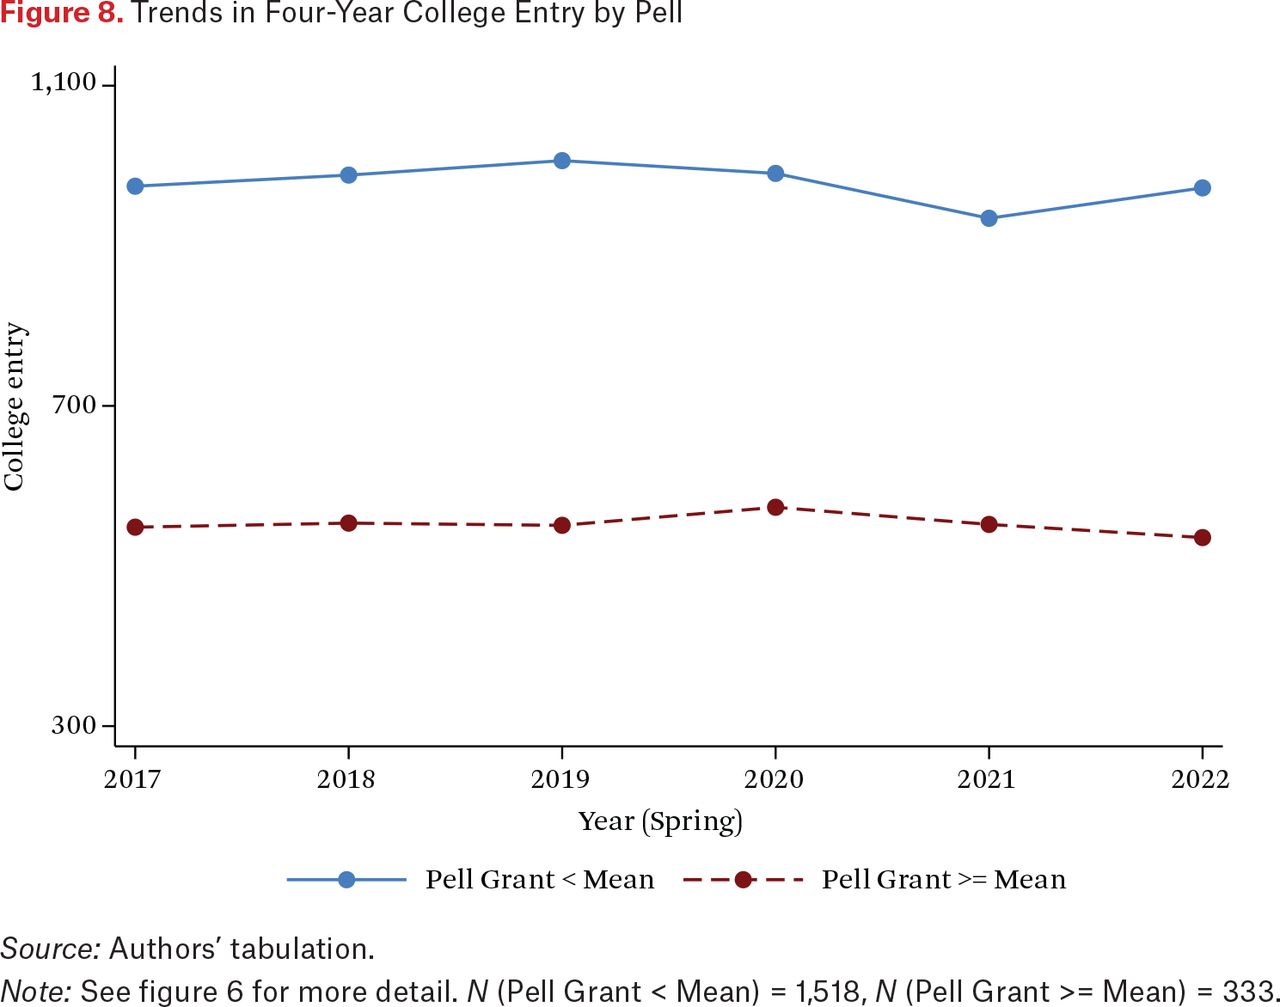
The smaller drop in four-year sector entry, noted earlier, also shows up as less extreme changes in subgroups (figures 7 and 8). Hispanic-serving institutions again saw the largest relative drops in entry, but low- and high-Pell institutions both saw similar drops in entry. For reasons that are unclear, high-Pell four-year colleges saw a slight but persistent decline, whereas low-Pell institutions saw a larger drop followed by a similar-size rebound.

Trends in Four-Year College Entry by Race
Source: Authors’ tabulation.
Note: The sample includes 1,240 White, 103 Black, and 60 Hispanic-serving colleges.

Trends in Four-Year College Entry by Pell
Source: Authors’ tabulation.
Note: See figure 6 for more detail. N (Pell Grant < Mean) = 1,518, N (Pell Grant >= Mean) = 333.
We also calculated how college entry changed for public, private-nonprofit, and for-profit institutions (figures A.3 and A.4). In the two-year sector, the drop in overall entry was concentrated in public institutions, and for-profits saw no decline at all. This is another sense in which the long-term consequences for students are worse than they appear. For-profit colleges are known to have very low economic returns for students (Cellini and Chaudhary 2014).
In this discussion, we interpret these results as the result of effects of the COVID pandemic. Although normally this would be questionable with simple trend lines, it is difficult to conceive of any other factor that could have had nearly the impact of COVID during this period. Even factors such as changes in the economy were themselves driven by COVID and COVID responses. Thus, in this unusual case, we see the simple deviations from the prior trends as causal estimates of the total impact of the pandemic and related policies.
RESULTS: MECHANISMS OF ATTAINMENT VARIATION
In the previous section, we showed how the trends in outcomes changed. In this section, we explore the specific mechanisms behind the increase in high school graduation and drop in college entry by estimating equations (1) and (2), leveraging variation across locations. For all outcomes, we can provide evidence regarding the roles of instructional mode, opportunity cost, and COVID spread and risk. In addition, with high school graduation, we provide evidence regarding the role of academic standards.
For the post-treatment period, we focus on the 2021 school year for three reasons. First, this is the year we have the most covariate variation to work with, especially on instructional mode. Second, some of the covariates, such as relaxation of standards, were only available for 2021. Third, the 2021–2022 outcome data became available too late in the publication schedule for us to incorporate them.
High School Mechanisms
In this section, we examine the specific COVID-related factors shaping the changes in educational attainment shown in the prior section. We begin with high school graduation and continue on to immediate college entry.
Overall Influence of High School Mechanisms
Our estimates of equation (1) are shown in table 1 for the forty-four states from which we have high school data for 2021 graduation effects. All estimates report standard errors clustered at the district level. All specifications shown include district fixed effects and district-specific linear time trends, as outlined in equation (1).
Regression Results for High School Graduation
We start with a model that includes only the instructional mode variables. The first coefficient in column (1) shows that increasing in-person learning from 0 to 100 percent is associated with a small (0.856 percentage point) rise in the high school graduation rate, relative to the omitted hybrid category. But this appears to reflect correlation among the covariates, as instructional mode is no longer related to high school graduation when we include LFP, standards, and COVID cases. This highlights the value of including proxies for all the factors theoretically related to attainment.
In models (2) and (3), academic standards are the only statistically significant predictor of the changes in high school graduation. More precisely, the states with graduation exams that also relaxed their standards saw larger increases in high school graduation rates. This result requires some clarification because our media searches indicate that the official relaxation of standards occurred only in 2020 and these results focus on the 2021 graduating class. One possible explanation is that graduation exams are normally taken before the senior year of high school. Thus canceling tests in the spring of 2020 would have had a delayed effect on students who were high school juniors at the time. Another possibility is that schools and districts followed the leads of their states and kept relaxing standards after 2020. When we estimated the effects for the 2020 graduating class (available on request), the relaxation of standards more clearly increased high school graduation.
None of the other factors is associated with changes in high school graduation in the main specification. As a robustness check, we drop the district linear trends (table A.3) and, in that case, COVID cases are negatively associated with high school graduation. In another version (available on request), we also reestimated the appendix model while centering the interactions on the global means.18 This specification increases precision considerably and shows a clearer role for in-person instruction in increasing high school graduation. Given the inconsistency across specifications, we conclude that higher numbers of COVID cases and higher levels of in-person instruction may have increased high school graduation, but we cannot be sure. In none of these specifications, however, do we see any role for the labor-force participation rate.
High School Mechanisms by Subgroup
The earlier figures showed high school graduation trends were more negative for Black students, Hispanic students, and economically disadvantaged students for the year of interest here 2021. This could be due to two factors: that the groups differ in the mean values of covariates such as instructional mode, sometimes called the endowment effect and the differences in group responses to those covariates, sometimes called the coefficient effect.
We can gauge the endowment effect by examining the differences in means by subgroup. Because the interaction between graduation exams and relaxation of standards is the strongest predictor of changes in high school graduation, we focus on those descriptives in table 2 as an example. Graduation exams are more common in states with fewer Black and Hispanic students. This suggests that the sharper drops in high school graduation may be because more advantaged groups saw greater relaxation of standards.
High School Covariate Means by Subgroup, 2021
To understand the coefficient effects, we also reestimated the regression models, interacting each term in table 1 with race. This yields a large number of coefficients (available on request). In summary, we do not see much evidence of differences in coefficients between racial groups. We also implemented a Blinder-Oaxaca decomposition to more precisely determine the role of coefficients and endowments, but these turned out to be difficult to interpret.19 Overall, then, we conclude that the differential effects of COVID on high school graduation by race are due mainly to differential relaxation of academic standards.
College Mechanisms
Our analysis of college mechanisms focuses on the 2020–2021 school year, meaning the college entry in the fall of 2020.
Overall Influence of College Mechanisms
Our analysis of college instructional mode parallels the high school graduation analysis. Tables 3 and 5 report estimates of equation (2) for two- and four-year colleges, respectively.
Regression Results for Two-Year College Entry
Two-Year College Covariate Means by Subgroup
Regression Results: Four-Year College Entry
Compared with high school, the role of college instructional mode is closer to what we expected. In-person instruction was associated with increased entry and remote instruction shows the opposite pattern. Hybrid, again, is the omitted category.20) This positive role for in-person instruction is not surprising for several reasons. Many two-year college programs, like welding and nursing, are hands on and cannot be carried out remotely (Schanzenbach and Turner 2022). Table 4 shows that Hispanic-serving institutions were more likely to have remote instruction, so instructional mode seems like a clearer contributor to declining enrollment in Hispanic-serving institutions noted earlier (see figures 5 and 6).
We also see some evidence that two-year college entry was driven partly by COVID spread, but we see no significant interactions between instructional mode and COVID spread. LFP is unrelated to two-year college entry. As with instructional mode, it appears that some of the racial differences in COVID trends can be explained by the COVID case “endowment.”
The relationship between instructional mode and entry is weaker at the four-year college level (table 5). In addition to having fewer hands-on programs than two-year colleges, social life is a more central feature of four-year institutions, which are typically residential. For this reason, instructional mode may matter less than the “social mode” or ability to socialize with classmates. Many colleges allowed on-campus social life to continue even as classes were remote and they had little control over off-campus activities. The other coefficients are similar to the two-year college results; again, we see some evidence that COVID spread reduced entry, but no interactions between COVID cases and mode. While the subgroup college entry changes were relatively small in this sector, this is despite similar endowment differences in instructional mode and some other factors (table 6), which reinforces that students were simply less responsive to those differences compared with two-year colleges.
Four-Year College Covariate Means by Subgroup
College Mechanisms by Subgroup
As in the high school analyses, we interacted race with the other covariates and found no substantive differences across the racial subgroups. We see less in-person instruction in the Hispanic-serving institutions, suggesting that the endowment effect might be the driving force behind the college entry differentials for this group trends (see figure 5).
To summarize, instructional mode was a key driver of the large drop in two-year college attendance; COVID cases also played a smaller role in both two- and four-year colleges. Moreover, as at the high school level, the differential attainment trends by subgroup appear to be driven more by endowments of instructional mode and COVID cases than coefficient differences.
DISCUSSION
In this study, we estimate the effects of COVID on high school graduation and immediate entry to two- and four-year colleges, filling out the picture that others started to create regarding K–12 enrollment (Dee and Murphy 2021; Musaddiq et al. 2022) and overall college enrollment (NSC 2021, 2022). The results, combined with those of prior studies, suggest considerable heterogeneity in COVID effects on enrollment across levels of education (such as K–12 versus college) and across types of enrollment (initial enrollment, persistence, and completion). In this discussion, we propose some plausible explanations that may explain some of this heterogeneity and provide a more complete picture of the pandemic’s effects on educational attainment.
Patterns Across Institution Types
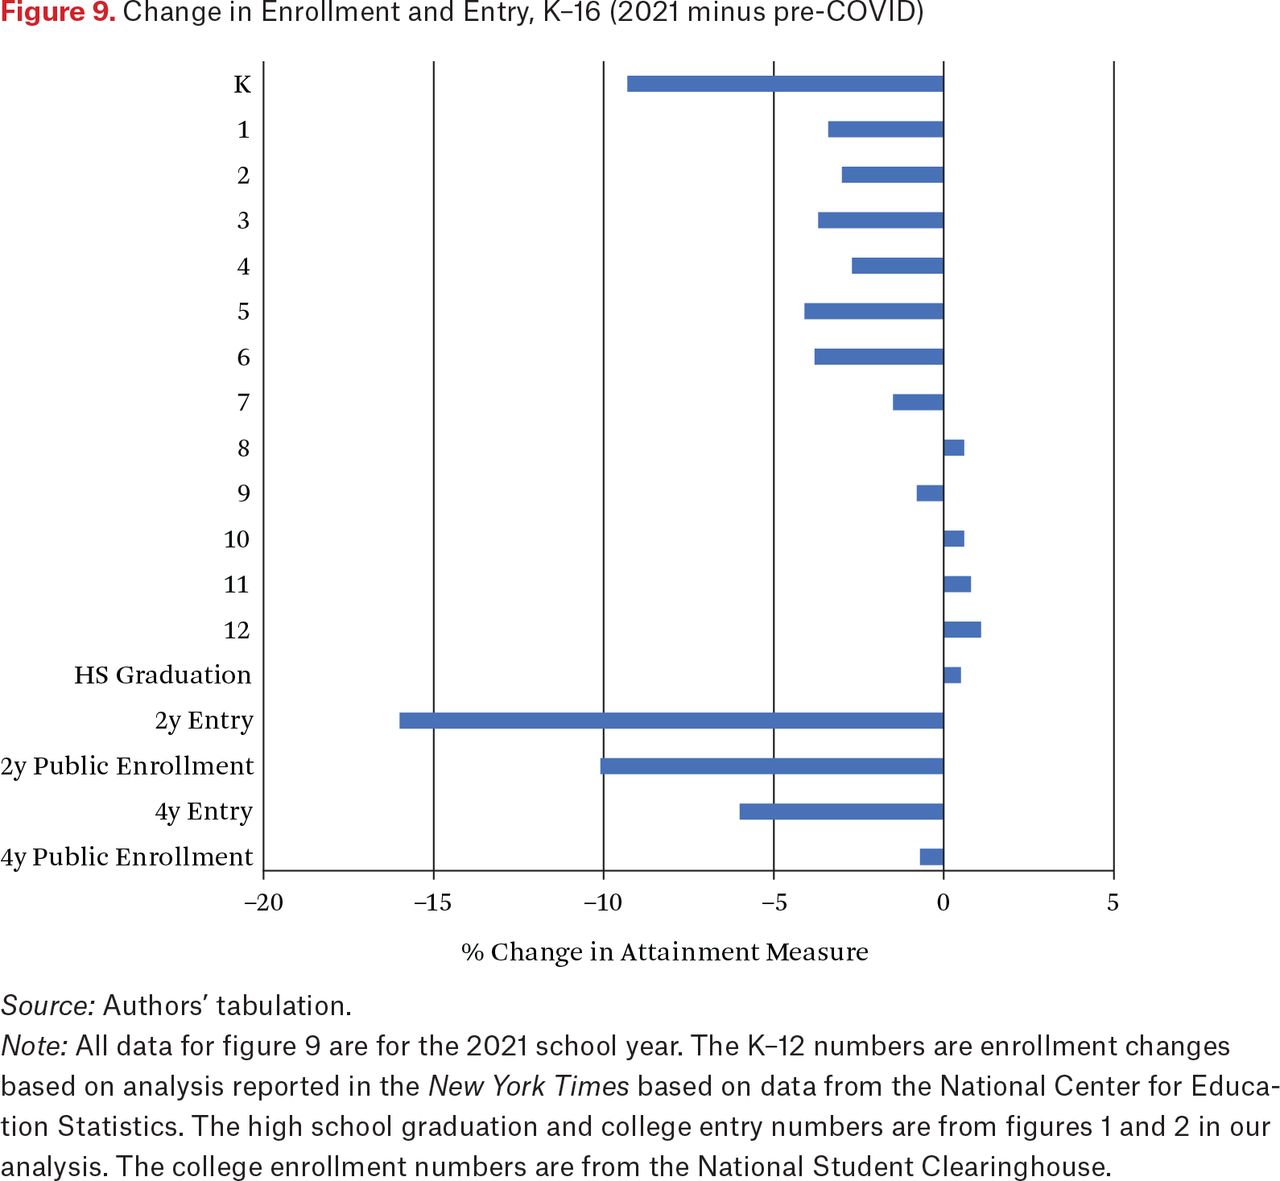
Figure 9 summarizes the results for high school graduation and college entry alongside evidence from other studies on the other educational institutions and levels, from kindergarten through college for the 2021 school year. We see four key patterns and associated explanations.

Change in Enrollment and Entry, K–16 (2021 minus pre-COVID)
Source: Authors’ tabulation.
Note: All data for figure 9 are for the 2021 school year. The K–12 numbers are enrollment changes based on analysis reported in the New York Times based on data from the National Center for Education Statistics. The high school graduation and college entry numbers are from figures 1 and 2 in our analysis. The college enrollment numbers are from the National Student Clearinghouse.
First, we see smaller enrollment declines in high school than in earlier grades. Figure 9 shows, for example, that enrollment increased slightly in grades 10 through 12 but decreased significantly in grades 1 through 5. We offer two general explanations for the smaller enrollment declines in high school, compared with earlier grades: teenagers’ autonomy and their need for nonfamilial social interaction.
We combine the second and third patterns: kindergarten enrollment dropped more than twice as much as other elementary grades—and the transition from high school to college dropped more than high school enrollment and, even more so, high school graduation. We treat these together because, as we argue, they may have a common origin. Kindergarten and the start of college both involve entering and starting in a new education institution and, especially during a pandemic, entry is fundamentally different from persistence and completion.
Fourth, we see larger declines in two-year college enrollment than in four-year college enrollment. We explain below how this is due to differences between two-year colleges and their students vis-à-vis those in four-year colleges, as well as elaborating on all of these patterns and potential explanations.
Mechanisms for Cross-Institution-Type Variation
The first pattern is smaller enrollment declines in high school than in earlier grades. One reason for it is likely that teenagers depend more on their friendships than preadolescents do (Buhrmester and Furman 1987; Claes 1998; Gehring and Feldman 1988; McNelles and Connolly 1999; Noller 1994; Valkenburg and Peter 2007). The quality of adolescent relationships is important to social adjustment (Waldrip et al. 2008).21 As Michel Claes (1998, 167) puts it, “intense relationships with same-sex peers constitutes a universal reality of adolescence.” Conversely, as friendship bonds strengthen, closeness between children and their parents begins to weaken as they move from preadolescence to adolescence (Claes 1998; Gehring and Feldman 1988; Noller 1994).
In a pandemic, this creates a distinctive challenge for teenagers. The pandemic simultaneously increased anxiety (because of the health risk posed to loved ones, uncertainty about the future, and economic hardship), but also made it more difficult to cope as pandemic lockdown reduced the extent and depth of friend interactions that are so important to them. Staying enrolled in high school and college was one of the few steps teenagers and young adults could take to address the problem. Isolation from friends may be partly why teenagers suffered worse depressive symptoms than younger children during the pandemic (Panchal et al. 2021). Staying in high school likely attenuated these symptoms, but not enough to prevent them entirely.22
Similarly, adults report seeking support from friends and family when they experience anxiety (Addison et al. 2007).23 During the SARS outbreak, researchers found that people coped by seeking support, that is, using emotional and other support from friends or family to comfort them (Lee-Baggley et al. 2004). This type of support-seeking is more feasible when people are in direct contact, such as attending schools and colleges in-person. This coping strategy might be even more common among teenagers given the importance of friendships for this group.
A second broad explanation for more stable enrollment in high school is that teenagers have greater autonomy with which to continue attending school, in three respects. First, they can complete their schoolwork more autonomously. Parents are less able to help older children academically because of the higher complexity of material, making homeschooling less effective. Second, and partly for the same reason, teens exert more control over educational decisions, such as whether to attend school. Third, once they reach age sixteen, many high schoolers also have access to cars, directly or indirectly through their friends, making it easier to attend high school, if they choose. The higher levels of autonomy on these dimensions mean that teenagers had more control over the decision to continue in school and, given the many reasons why they would wish to continue, that autonomy may have combined with their own personal motivation to stay in school.
We also considered the possible role of COVID vaccines, which were approved for adolescents before they were approved for younger children. Specifically, the Pfizer-BioNTech vaccine was approved for individuals sixteen years and older on December 11, 2020, but was not approved for ages twelve to fifteen until May 10, 2021, and was only approved on an emergency basis for ages five to eleven on October 29, 2021. Even though vaccines might have played a role in theory, it is unlikely given that COVID spread itself did not predict high school graduation (see table 1). We simply do not see evidence that high school attainment was related to health, which would seem to eliminate vaccines as an explanation.
Patterns two and three involve larger drops for entry versus persistence and completion. One reason for this is likely the high cost of delayed completion. High school students are expected to graduate at a specific time—all students are labeled as Class of YEAR— and failing to graduate in that year could stigmatize students among their peers and make it difficult to continue. Such a clear expected date of completion is less pronounced at other levels of education. Also, students who are held back or who drop out of high school have a very low likelihood of future completion and the costs of noncompletion are considerable (Levin et al. 2006). High school graduation is critical to opening up long-term life options even for those who do not plan to attend college.
Second, completion of a degree usually comes with requirements. Especially at the high school level, the requirements for completion are higher than the requirements for entry and continuation. Essentially anyone who has completed eighth grade is guaranteed admission to a public high school. The higher standard for completion than entry also applies at the college level; although public discourse focuses on hypercompetitive elite colleges, the vast majority of college goers attend nonselective institutions. At both the high school and college level, students are required to take certain courses and maintain minimum grade point averages, especially in core courses.
Why then did high school graduation stay stable? One reason may be that states relaxed many of the standards they have in place for this form of high school completion. As shown in table 1, states with graduation exams who relaxed their standards saw larger increases in high school graduation (other things equal).24 Anecdotally, high school teachers were also told to allow students to pass their courses with quite minimal forms of participation. Colleges might also have relaxed graduation standards, but this is harder to observe.25
Persistence and completion might also have remained more stable because of the coping explanation discussed earlier. Persistence and completion mainly involve maintaining social relationships, which are especially important in a pandemic (Addison et al. 2007; Lee-Baggley et al. 2004), whereas entry involves creating new relationships, which was difficult to do under pandemic social distancing.
The fourth pattern was larger entry and enrollment drops in two-year versus four-year colleges. This pattern cannot be explained by either of the described factors because college entrants are of roughly the same ages and face the same general decision: whether to enter or continue in college.26 However, two-year colleges are different in important ways from four-year colleges. First, as Diane Schanzenbach and Sarah Turner (2022) show, many two-year college programs require hands-on activity, which makes them particularly difficult to carry out remotely. These include mechanical trades and nursing, which encompass a much smaller share of students at the four-year college level. Thus the large drop in two-year college entry and enrollment may just reflect that these hands-on activities were not available or that hands-on learning was more significantly hindered.
A final difference is that students at two-year college have a more tenuous connection to higher education than do students at four-year colleges. Relative to four-year students, two-year students are more likely to be older, to be enrolled part time, and to stop out for both academic and nonacademic reasons. For those reasons, it should not be surprising that the enrollment and progress of two-year students was more disrupted by the pandemic.
CONCLUSION
Considerable attention has been paid to learning loss during the pandemic. Here we extend the literature to focus more on educational attainment. Our preliminary results suggest that high school graduation did not decline during the pandemic—in fact, it increased to an all-time high. In contrast, the immediate transition to two-year colleges was the most negatively affected outcome, dropping by 21 percent two years after the onset of the pandemic. The results were consistently worse for students of color across types of attainment—high school graduation, two-year college entry, and four-year college entry.
We also examined variation in outcome trends across schools and colleges. Instructional mode and COVID cases both predicted educational attainment, especially college entry but perhaps in high school as well. The reduction in academic standards also seems to have propped up high school graduation rates, perhaps especially for white students and those with disabilities.
In addition to trying to understand heterogeneity between educational institutions (such as variation in graduation across high schools), we have identified distinctive patterns in attainment across ages and levels from K–16: high school enrollment and graduation increased while other forms of attainment decreased; entry dropped more than persistence and completion; and entry and enrollment dropped more in two-year colleges. We pose hypotheses for each pattern, and additional research is necessary to test them, but the analysis provides a general sense that these patterns that initially seem erratic were actually fairly predictable.
We note some limitations of the present analysis. COVID created a complex set of interconnected reactions that make it difficult to tease out cause and effect. We have advanced on prior research by considering a variety of factors simultaneously but recognize the difficulties involved in isolating the role each played. Also, even though the IPEDS college data include almost all colleges, we do note issues, especially with the subgroup trends in high school graduation, where missing data are especially high and where robustness checks yield some different conclusions.
The social welfare implications of all of this are a bit unclear. Of course, young people (and older people) are worse off because of COVID, educationally and otherwise. But the relevant question is whether the educational system could have responded better, given the pandemic circumstances. The actual policy response, at both the high school and college level, entailed educational institutions trying to serve students in ways as near as possible to the prior norm, given social distancing rules. One alternative would have been to engage in much less social distancing (more in-person instruction) and serve students exactly as before, but many families were worried about the pandemic and many students—and their teachers—simply would not have shown up; and spread the virus more when they did. Another option might have been to require students, at least at the high school level, to repeat the year and try to catch up. This, too, would have come at considerable cost as high schools would have had to continue serving both incoming and repeating students at the same time. Adding a year also likely would have led some students, eager to finish their schooling and move on, to drop out. Good options were simply not available.
What do these results mean for long-term educational attainment? Will students return to their prior patterns? It seems quite likely that the kindergarteners who redshirted over the past two years will eventually enter school and that these students will continue through the schooling system. But students who have already started school learned less and will therefore be less prepared for higher grades. Also, research suggests that students who do not start college immediately after high school have a lower probability of ever entering or graduating. The lower entry rates we observe therefore signal a likely persistent decline in attainment.
What we do know with more certainty is that human capital declined during the pandemic. Even with high school graduation, which is now at an all-time high, the reduction in standards means that this, too, is a signal of repercussions to come—for students, schools, and college alike—and especially for the most disadvantaged among us.
FOOTNOTES
↵1. This finding aligns with research on the 1916 polio epidemic, which led to a decline in educational attainment (Meyers and Thomasson 2017), though a study of the 1918 flu pandemic found no such effect (Ager et al. 2022).
↵2. Research suggests that school-age children played little role in the early spread of the virus (Goldstein, Lipsitch, and Cevik 2021; Viner et al. 2020), and that reducing class sizes—a large part of the rationale for hybrid schooling—does little to slow the spread of viruses (Bazant and Bush 2021; von Hippel 2021). Also, the switch away from in-person schooling did little to slow the spread of COVID, except perhaps in the districts where the prior level of COVID was highest (Goldhaber, Imberman, et al. 2022; Harris, Ziedan, and Hassig 2021). Unfortunately, the decision to adopt remote or hybrid schooling was not concentrated in the districts with the highest COVID levels—the districts where remote schooling might have made a difference—but instead in districts with more people of color and low-income families, and in Democratic-leaning districts, whether those districts had high levels of COVID (Flamm et al. 2022; Grossmann et al. 2021; Harris and Oliver 2021).
↵3. Other researchers expressed uncertainty about the direction of high school graduation rates during the pandemic. For example, in December 2020 the College Board reported that the pandemic “introduces substantial uncertainty” into projections of high school graduation. Also, an article published in August 2021, more than a year into the pandemic, analyzed the responses of sixteen- to eighteen-year-olds to the Current Population Survey, reporting that “The pandemic reduced the likelihood of students reporting that they were enrolled in high school by about 1.8 percentage points in April 2020 vs. in the same month in prior years, although enrollment rebounded back to typical levels by October 2020” (Chatterji and Li 2021). Our results suggest nearly opposite patterns for high school graduation.
↵4. In general, the direct cost of education did not change during the pandemic. The federal government did institute loan forbearance, which allowed students to delay payments. However, even without forbearance, interest on student loans does not generally accumulate while students are still in college and it seems unlikely students considering entering college would have expected loan forbearance to continue beyond their college exit. Debt accumulation and repayment on loans taken out during the pandemic would thus have been unaffected by loan forbearance. President Biden’s loan forgiveness program was not announced until August 2022, after the period of analysis.
↵5. The cumulative return to education might also have been affected by the noted health effects. COVID not only incurred high immediate costs but also reduced life expectancy and therefore the potential work years during which students could benefit from the return to education. The effect here is similar to that on older workers choosing less in education because they too have fewer working years from which to reap the benefits.
↵6. The evidence on high school graduation exam effects is fairly mixed and generally finds small or null effects, except perhaps among very low performing students (Jacob 2001). Reardon and colleagues (2010) note the possibility of a discouragement effect among very low-performing students. This means that, during the pandemic, students who thought they might not pass the test might have stayed in high school when the requirement was relaxed. Finally, the relaxation of graduation exam requirements could also proxy for broader relaxation of standards.
↵7. For the spring of 2022, the included states are Alabama, Alaska, Arkansas, California, Colorado, Georgia, Iowa, Indiana, Kansas, Maine, Maryland, Missouri, Mississippi, Nebraska, Nevada, New York, Ohio, Oregon, South Carolina, South Dakota, Tennessee, Virginia, Washington, and Wyoming. For the spring of 2021, the only omitted states are the District of Columbia, Hawaii, Michigan, Montana, Oklahoma, Utah, and Vermont (for a summary, see table A.1).
↵8. Although the percentage of enrollment is the most important figure, it translates into a smaller percentage of school districts. This is because our sample disproportionately includes southern states, which have a smaller number of larger, county-level districts. Also, our focus on high school graduation limits us to secondary and unified districts, excluding elementary districts that exist in some states and do not enroll high school students. Data are also missing for roughly 15 percent of districts in the included states.
↵9. The meaning of homeschooling under the pandemic is somewhat ambiguous. If students are enrolled in a school and attended classes in some form (synchronous or otherwise), they would not be counted as homeschoolers. Instead, homeschooling is supposed to be limited to students who are not receiving instruction of any kind from district schools.
↵10. As noted, when students formally transfer to private schooling or homeschooling (legitimate exits), they are removed from the cohort and therefore from the graduation rate calculation.
↵11. We assume that the total number of instructional days did not change because the minimum number of days is specified in state laws.
↵12. This number comes from the Education Commission of the States based on 2016 data (https://www.ecs.org/wp-content/uploads/Info_Request_States_with_exit_exams.pdf ). The states with EOC-based requirements are Florida, Indiana, Louisiana, Maryland, Massachusetts, Mississippi, New Mexico, New York, Oklahoma, Texas, Virginia, and Washington. States with other graduation exams are Florida, Idaho, Massachusetts, Nevada, New Jersey, New Mexico, Ohio, Oregon, and Washington. As the overlap between the lists implies, some states require both: Florida, Massachusetts, New Mexico, and Washington.
↵13. These first-time freshmen data include students attending across state lines (for example, Central Piedmont Community College on the NC/SC border). Two-year colleges sometimes give cross-border residents from local areas in-district tuition (for example, College of Southern Nevada in Las Vegas for students from Arizona and California, less than an hour’s drive away from the borders with both).
↵14. An exception is with LFP, which has variance across all years within districts and counties. This is desirable in the sense that it allows us to use more information about the covariance of LFP and educational attainment, though it does require an assumption that we can extrapolate the pre-COVID covariance to the post-COVID period, even though LFP changed in a sharp and discontinuous way. In any event, the issue is likely a small one because most of the changes over time occur at the time of the pandemic.
↵15. Some students also transferred to private schools, but we would expect these students to have higher-than-expected graduation rates, so this could not explain the observed pattern.
↵16. We note that four states did not report the number of graduates and cohort sizes: Illinois, Mississippi, North Carolina, and North Dakota. We examined the overall trends in graduation in the full-data sample and they are similar to the four excluded states, so the smaller sample we analyze is likely not due to the smaller sample.
↵17. We also reran the results for Pell based on median Pell dollars per student and mean-median Pell dollars per new entrant and the results were very similar.
↵18. For discussion of this method, see Schuetze and von Hippel (2023).
↵19. The Blinder-Oaxaca decomposition is designed to quantify the degree to which the group differences in the outcome (in this case, high school graduation) are due to the endowment and coefficients. Unfortunately, the results of this method were difficult to interpret, especially in high school, because the coefficients on both in-person and remote instruction were of the same sign and magnitude. Also, when there are many coefficients, as in the present case, seeing the net effect of all the coefficients combined is somewhat uninformative. Finally, the Blinder-Oaxaca also includes a third interaction term that adds further complexity to the interpretation.
↵20. The Other category is so rare in the data that the interpretation of these coefficients is not meaningful.
↵21. Closeness as a psychological concept refers, first, to interdependent interactions in range of settings and activities and, second, to the qualitative experience, such as emotional communication and self-disclosure (Collins and Repinski 1994).
↵22. This logic also aligns with the way teenagers and adults cope with anxiety. Research on teenagers who have been physically abused, for example, shows that friends more consistently buffer teenagers from the negative side effects of abuse (Folger and Wright 2013; Runtz and Schallow 1997).
↵23. This is based on the Coping Strategies Inventory. Three of the sixteen items pertain to social relationships and, in one study (Addison et al. 2007), respondents report these as common strategies.
↵24. Appendix tables and figures can be found online at https://www.rsfjournal.org/content/10/1/152/tab-supplemental.
↵25. Many colleges also eased admissions standards, such as waiving SAT and ACT requirements, but this was less important because these scores are not binding constraints for the vast majority of potential college entrants.
↵26. Our data only allow us to identify new college entries of students who just finished high school. The college enrollment numbers, however, include students of all ages. Two-year college students are also more likely to be nontraditional.
- © 2024 Russell Sage Foundation. Harris, Douglas N., Feng Chen, Rylie C. Martin, Ann F. Bernhardt, Christopher R. Marsicano, and Paul T. von Hippel. 2024. “The Effects of the COVID-19 Pandemic on Educational Attainment.” RSF: The Russell Sage Foundation Journal of the Social Sciences 10(1): 152–80. DOI: 10.7758/RSF.2024.10.1.07. COVID mitigation policy data for this report have been provided by Nat Malkus and the American Enterprise Institute. We thank Meghan Kuhfeld and Nicolas Mattei for early conversations in conceptualizing the project. Stacy Overstreet provided important advice regarding the psychological factors involved in attainment decisions. Direct correspondence to: Douglas N. Harris, at dharri5{at}tulane.edu, 208 Tilton Hall, 6823 St. Charles Ave., New Orleans, LA 70118, United States.
Open Access Policy: RSF: The Russell Sage Foundation Journal of the Social Sciences is an open access journal. This article is published under a Creative Commons Attribution-NonCommercial-NoDerivs 3.0 Unported License.
REFERENCES
In this issue


Jump to section
Related Articles
Cited By...
- No citing articles found.