
Article Figures & Data
Figures
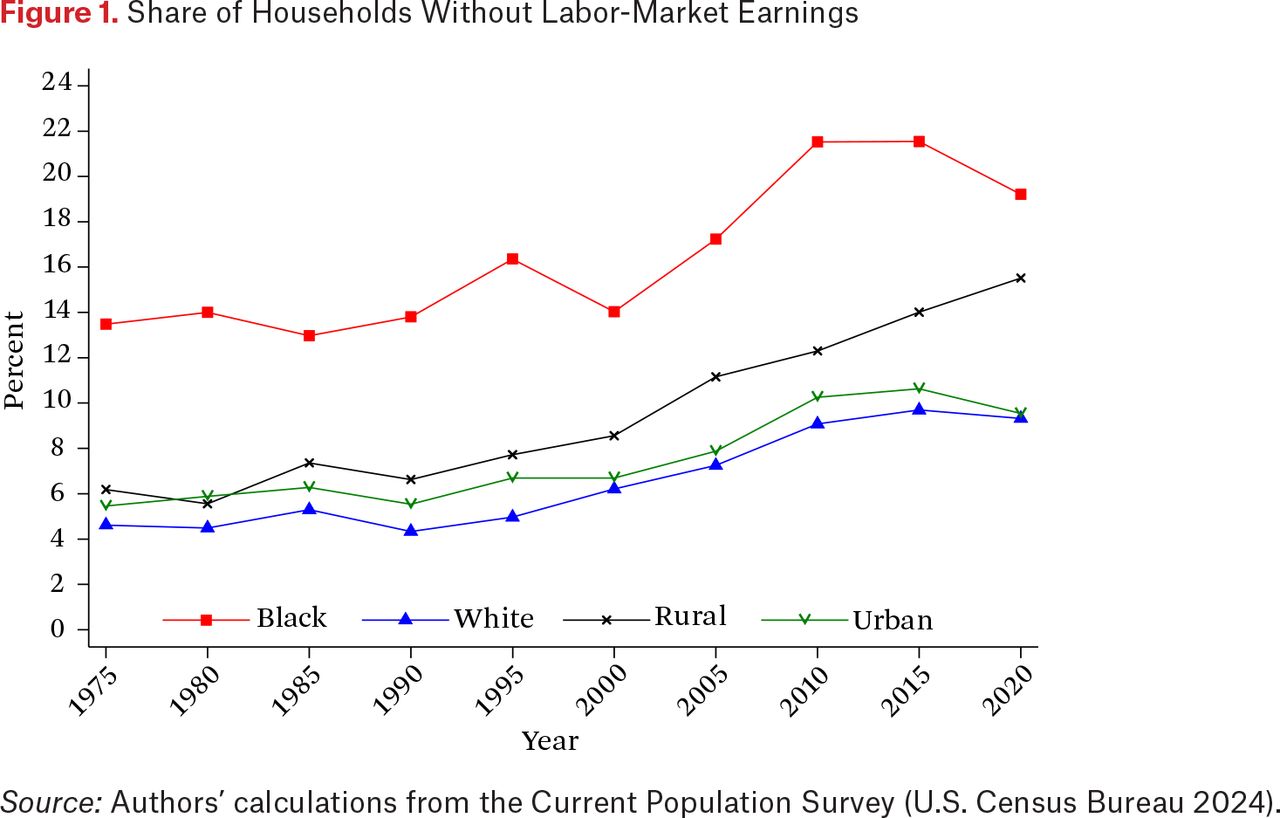
- Figure 1.
Share of Households Without Labor-Market Earnings
Source: Authors’ calculations from the Current Population Survey (U.S. Census Bureau 2024).
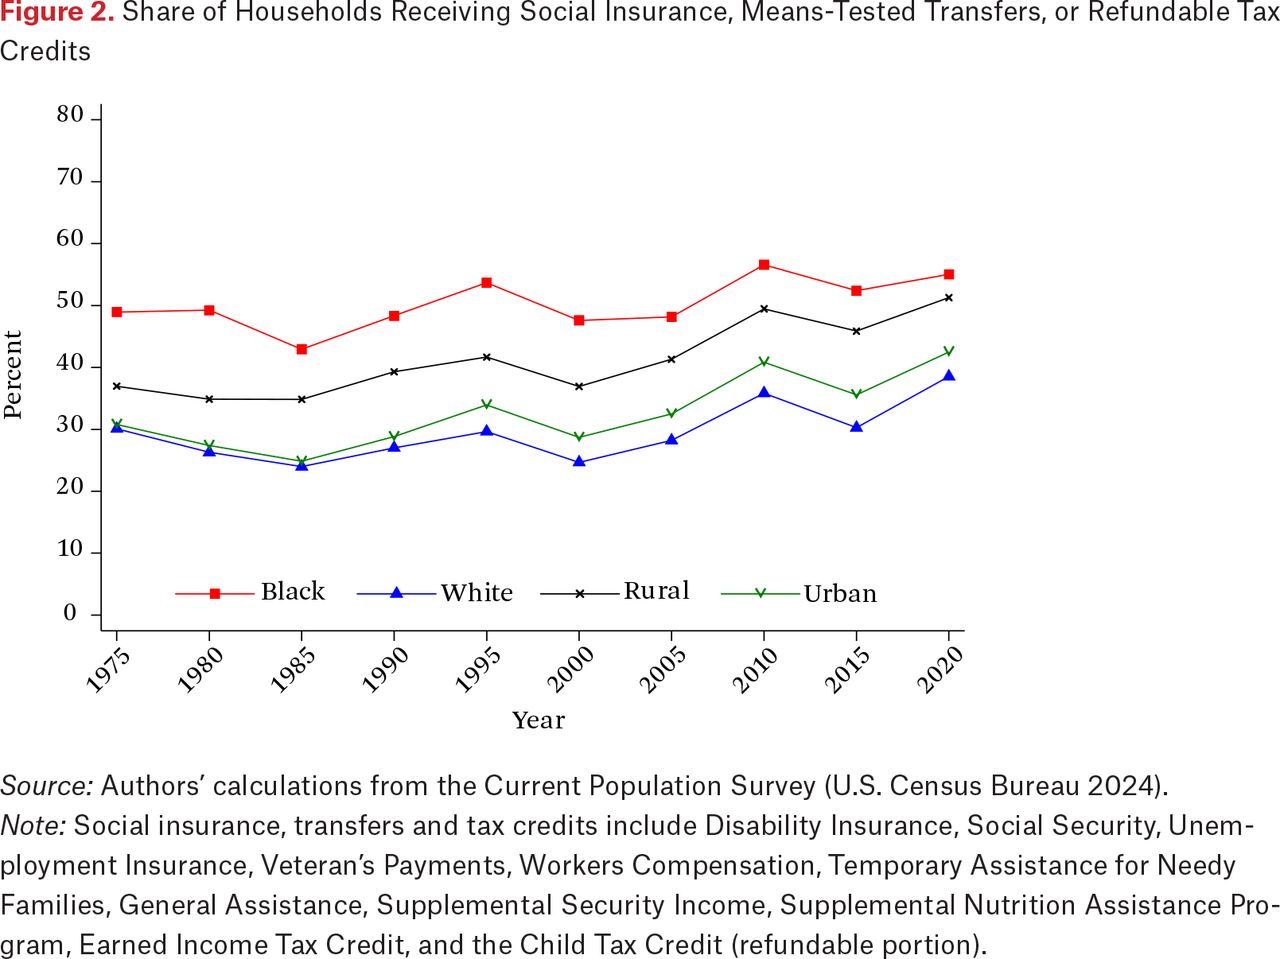
- Figure 2.
Share of Households Receiving Social Insurance, Means-Tested Transfers, or Refundable Tax Credits
Source: Authors’ calculations from the Current Population Survey (U.S. Census Bureau 2024).
Note: Social insurance, transfers and tax credits include Disability Insurance, Social Security, Unemployment Insurance, Veteran’s Payments, Workers Compensation, Temporary Assistance for Needy Families, General Assistance, Supplemental Security Income, Supplemental Nutrition Assistance Program, Earned Income Tax Credit, and the Child Tax Credit (refundable portion).
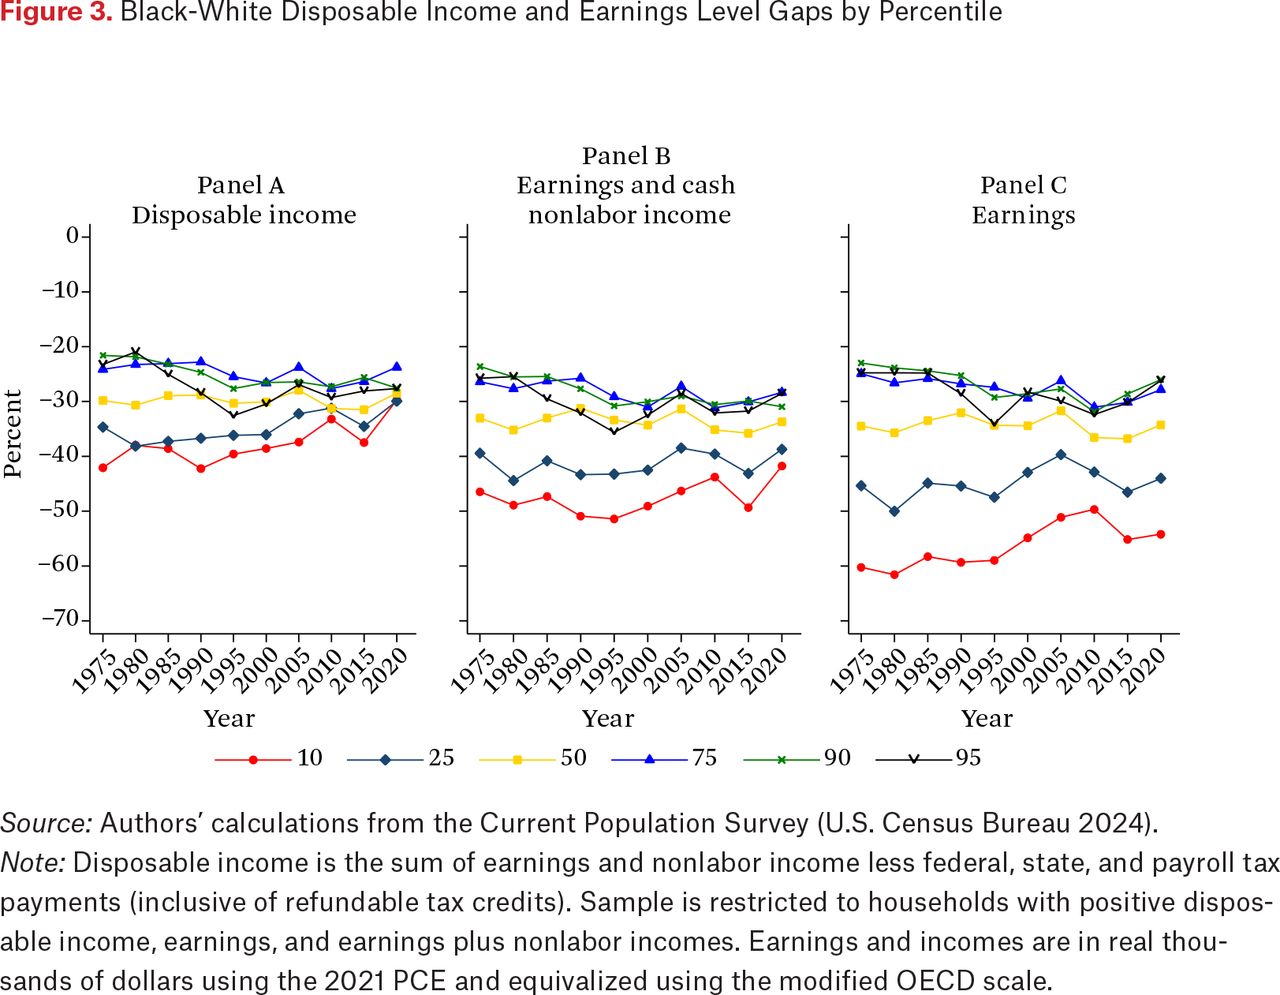
- Figure 3.
Black-White Disposable Income and Earnings Level Gaps by Percentile
Source: Authors’ calculations from the Current Population Survey (U.S. Census Bureau 2024).
Note: Disposable income is the sum of earnings and nonlabor income less federal, state, and payroll tax payments (inclusive of refundable tax credits). Sample is restricted to households with positive disposable income, earnings, and earnings plus nonlabor incomes. Earnings and incomes are in real thousands of dollars using the 2021 PCE and equivalized using the modified OECD scale.
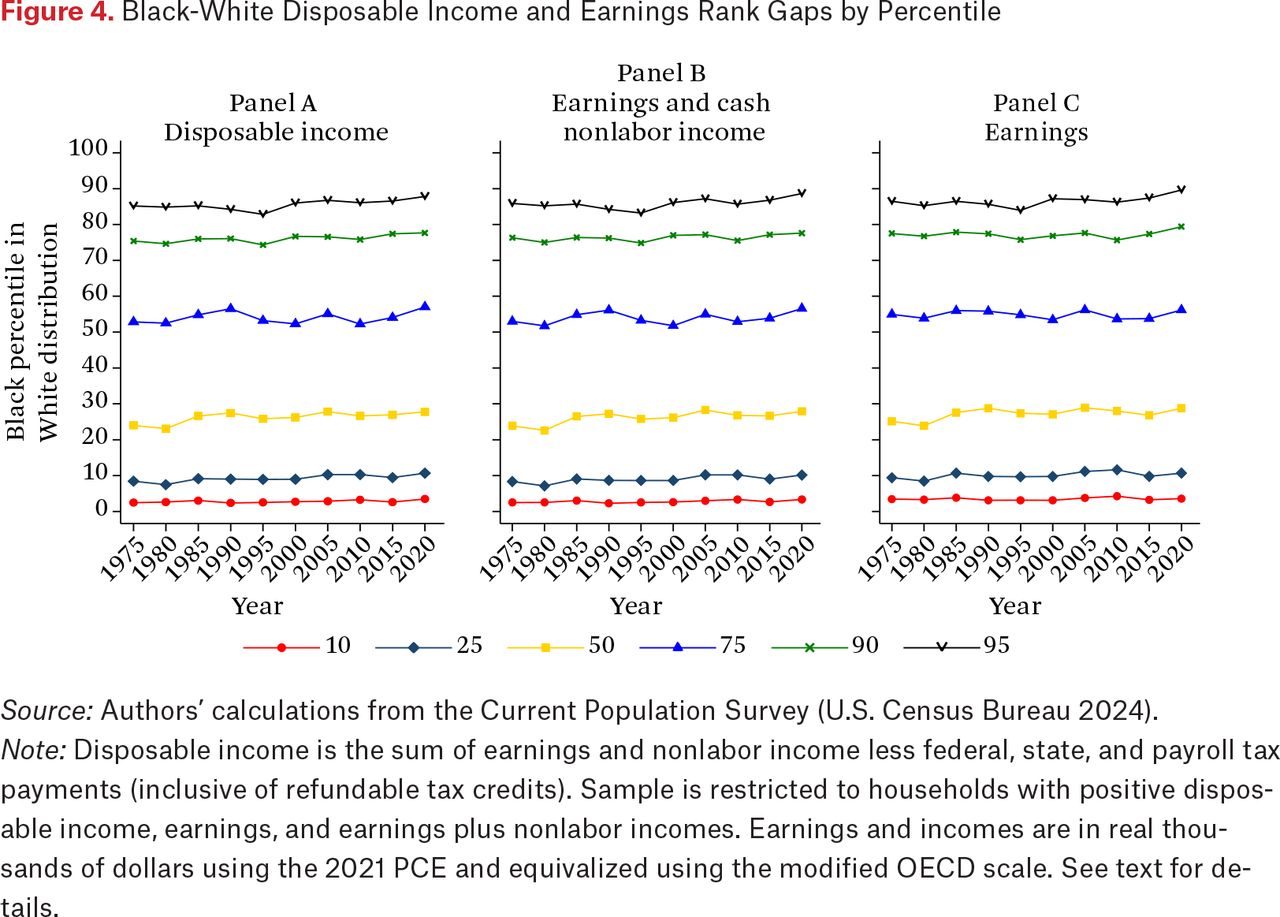
- Figure 4.
Black-White Disposable Income and Earnings Rank Gaps by Percentile
Source: Authors’ calculations from the Current Population Survey (U.S. Census Bureau 2024).
Note: Disposable income is the sum of earnings and nonlabor income less federal, state, and payroll tax payments (inclusive of refundable tax credits). Sample is restricted to households with positive disposable income, earnings, and earnings plus nonlabor incomes. Earnings and incomes are in real thousands of dollars using the 2021 PCE and equivalized using the modified OECD scale. See text for details.
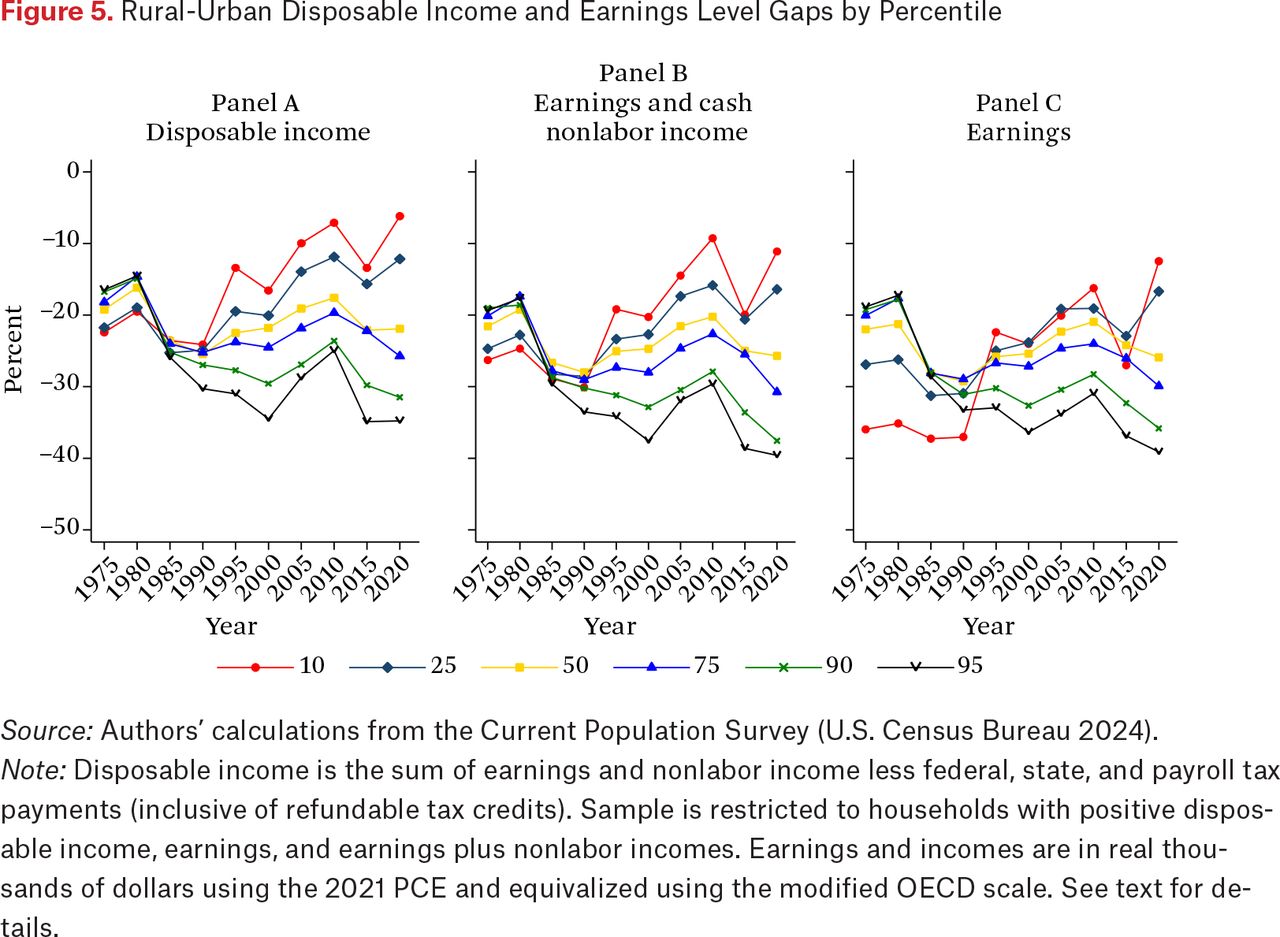
- Figure 5.
Rural-Urban Disposable Income and Earnings Level Gaps by Percentile
Source: Authors’ calculations from the Current Population Survey (U.S. Census Bureau 2024).
Note: Disposable income is the sum of earnings and nonlabor income less federal, state, and payroll tax payments (inclusive of refundable tax credits). Sample is restricted to households with positive disposable income, earnings, and earnings plus nonlabor incomes. Earnings and incomes are in real thousands of dollars using the 2021 PCE and equivalized using the modified OECD scale. See text for details.
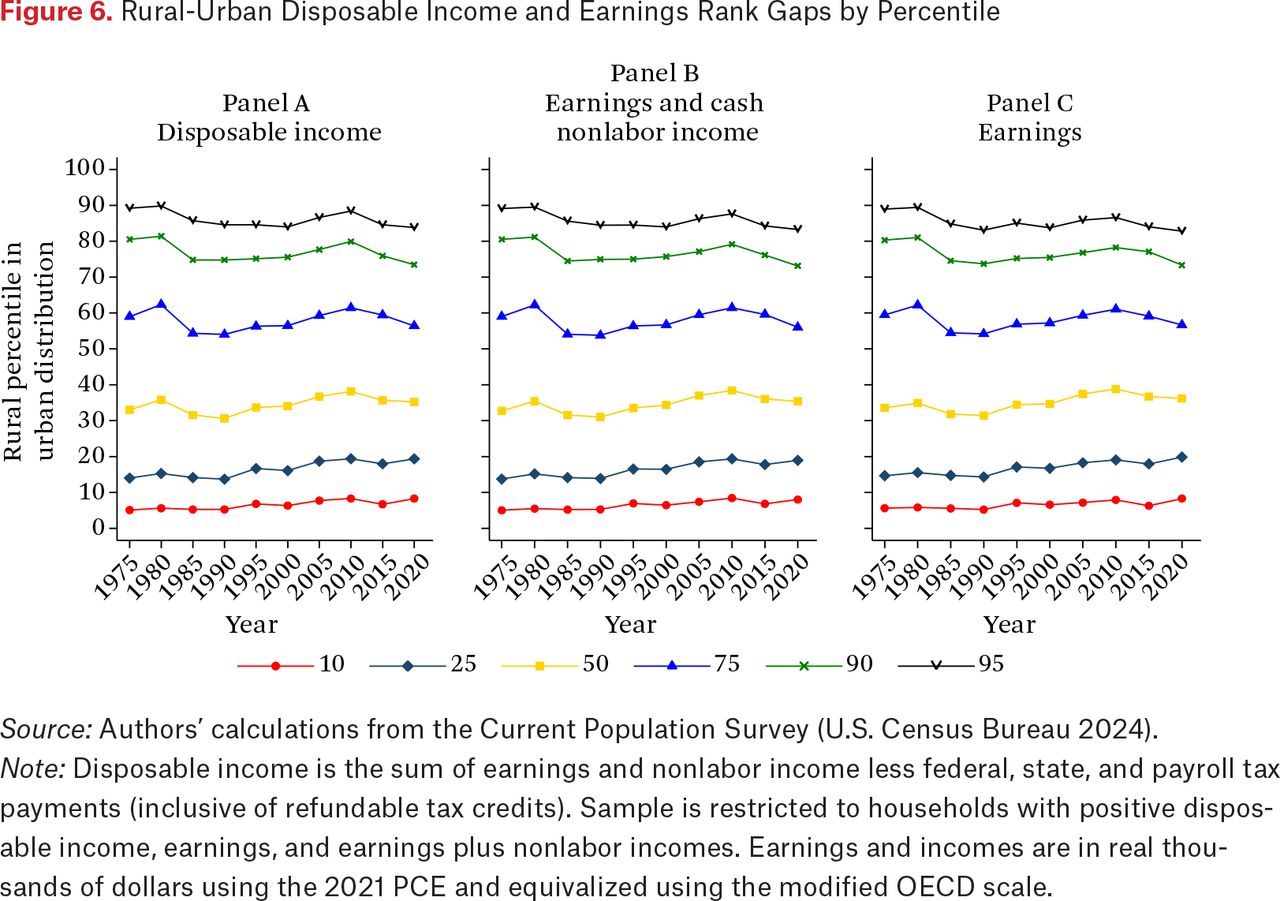
- Figure 6.
Rural-Urban Disposable Income and Earnings Rank Gaps by Percentile
Source: Authors’ calculations from the Current Population Survey (U.S. Census Bureau 2024).
Note: Disposable income is the sum of earnings and nonlabor income less federal, state, and payroll tax payments (inclusive of refundable tax credits). Sample is restricted to households with positive disposable income, earnings, and earnings plus nonlabor incomes. Earnings and incomes are in real thousands of dollars using the 2021 PCE and equivalized using the modified OECD scale.
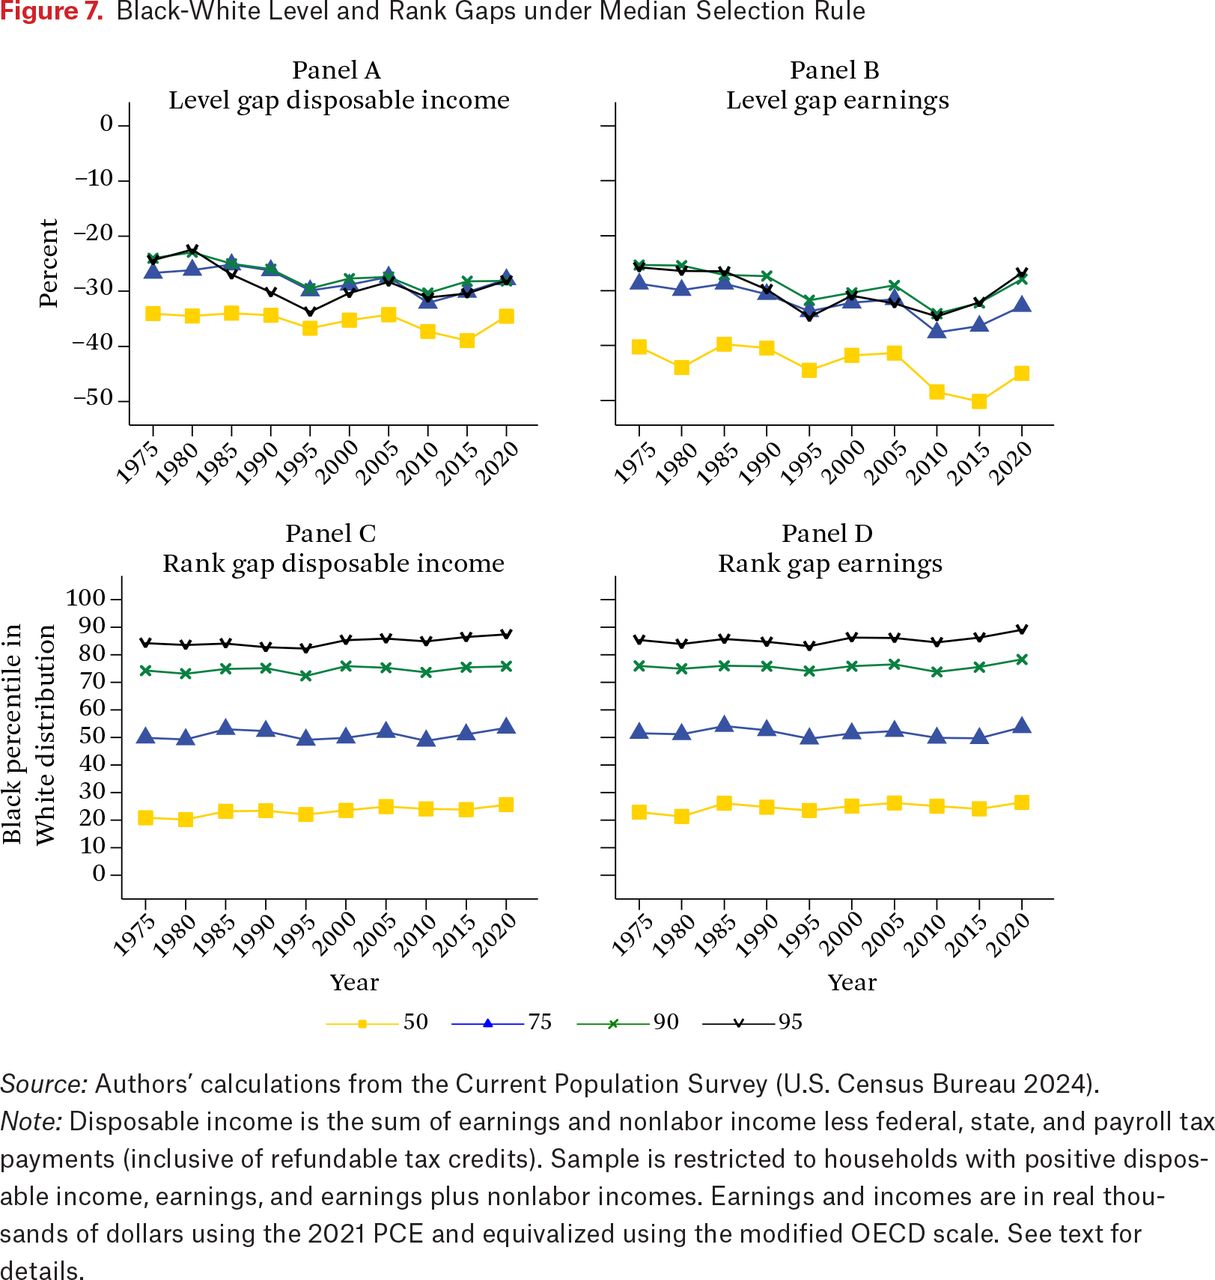
- Figure 7.
Black-White Level and Rank Gaps under Median Selection Rule
Source: Authors’ calculations from the Current Population Survey (U.S. Census Bureau 2024).
Note: Disposable income is the sum of earnings and nonlabor income less federal, state, and payroll tax payments (inclusive of refundable tax credits). Sample is restricted to households with positive disposable income, earnings, and earnings plus nonlabor incomes. Earnings and incomes are in real thousands of dollars using the 2021 PCE and equivalized using the modified OECD scale. See text for details.
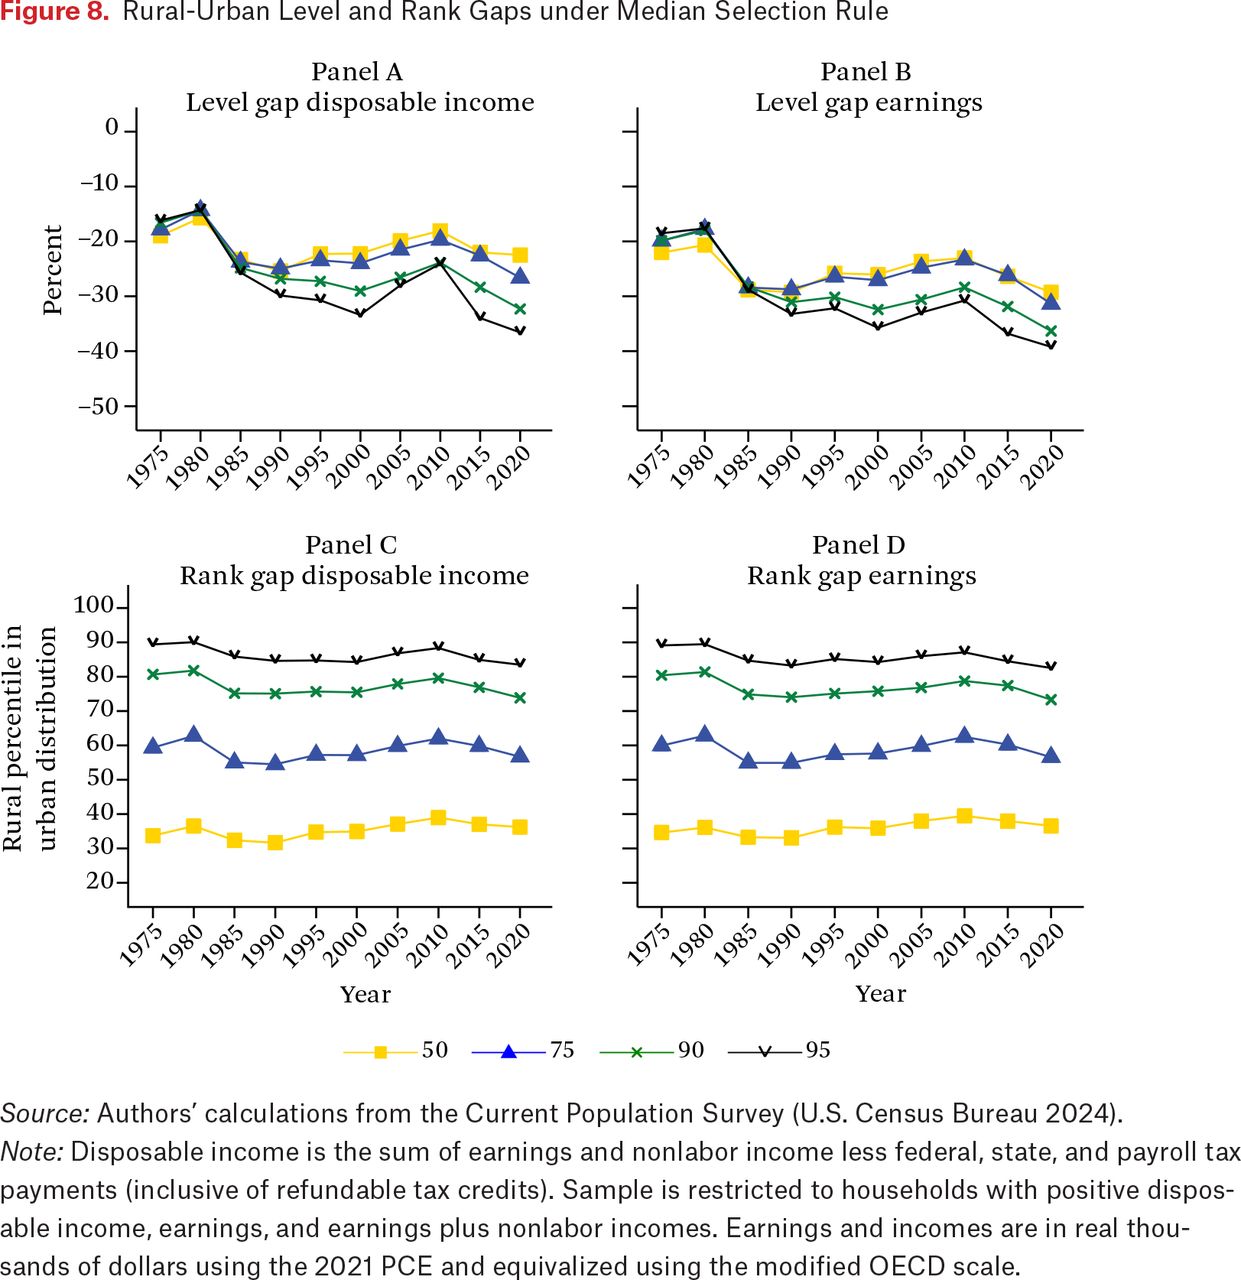
- Figure 8.
Rural-Urban Level and Rank Gaps under Median Selection Rule
Source: Authors’ calculations from the Current Population Survey (U.S. Census Bureau 2024).
Note: Disposable income is the sum of earnings and nonlabor income less federal, state, and payroll tax payments (inclusive of refundable tax credits). Sample is restricted to households with positive disposable income, earnings, and earnings plus nonlabor incomes. Earnings and incomes are in real thousands of dollars using the 2021 PCE and equivalized using the modified OECD scale.
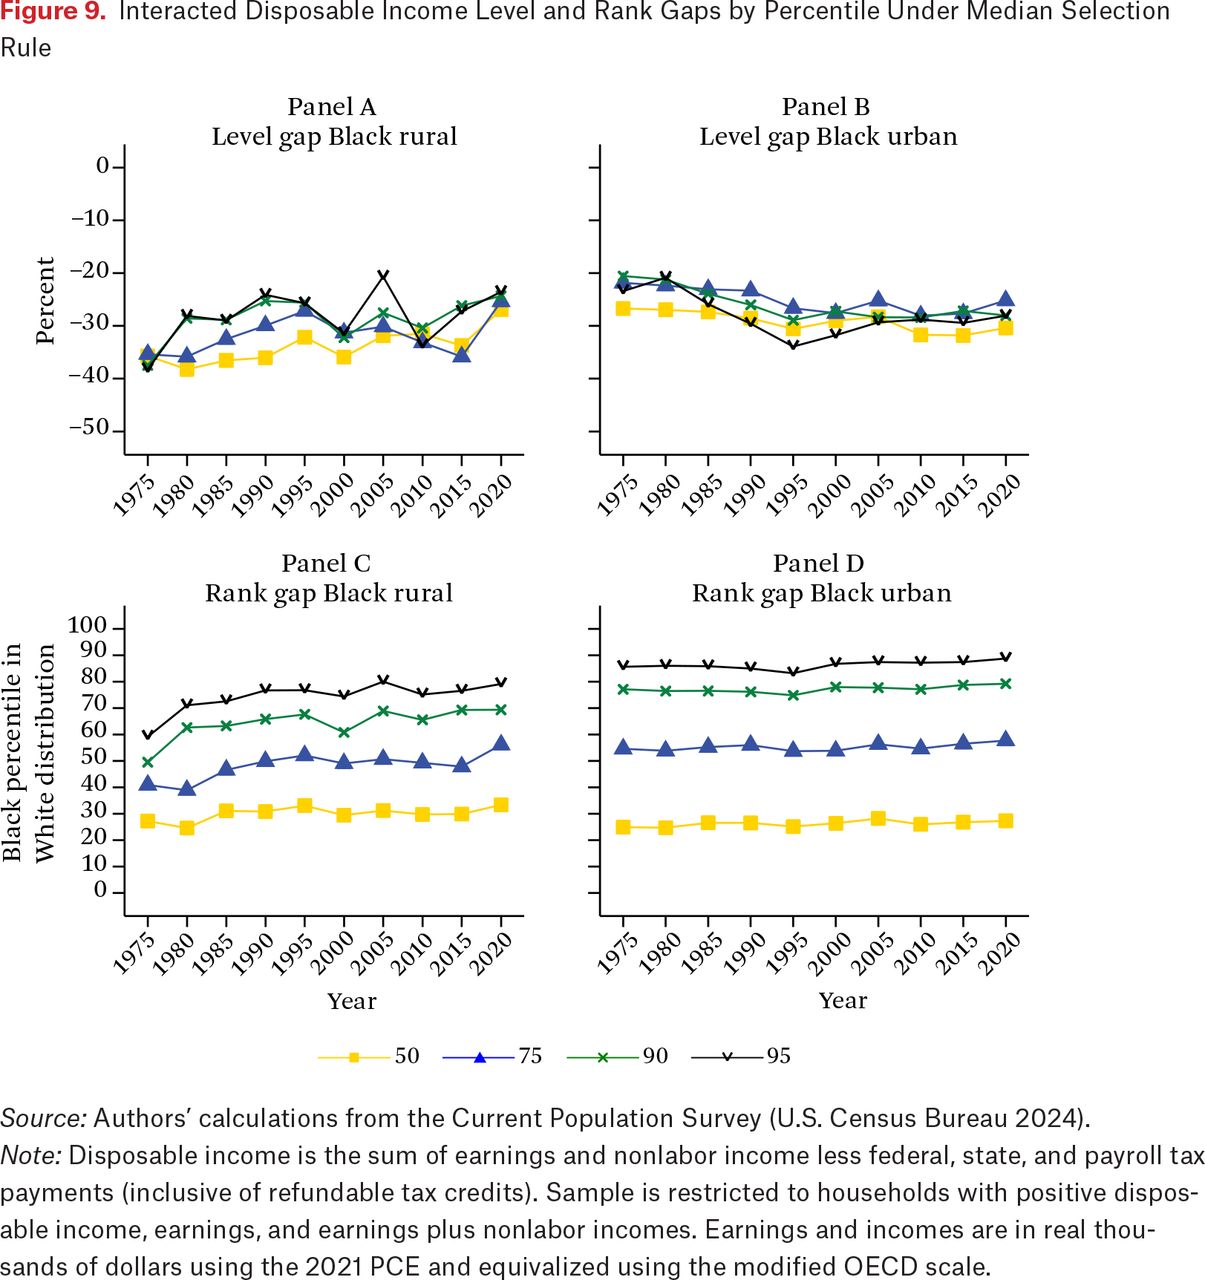
- Figure 9.
Interacted Disposable Income Level and Rank Gaps by Percentile Under Median Selection Rule
Source: Authors’ calculations from the Current Population Survey (U.S. Census Bureau 2024).
Note: Disposable income is the sum of earnings and nonlabor income less federal, state, and payroll tax payments (inclusive of refundable tax credits). Sample is restricted to households with positive disposable income, earnings, and earnings plus nonlabor incomes. Earnings and incomes are in real thousands of dollars using the 2021 PCE and equivalized using the modified OECD scale.
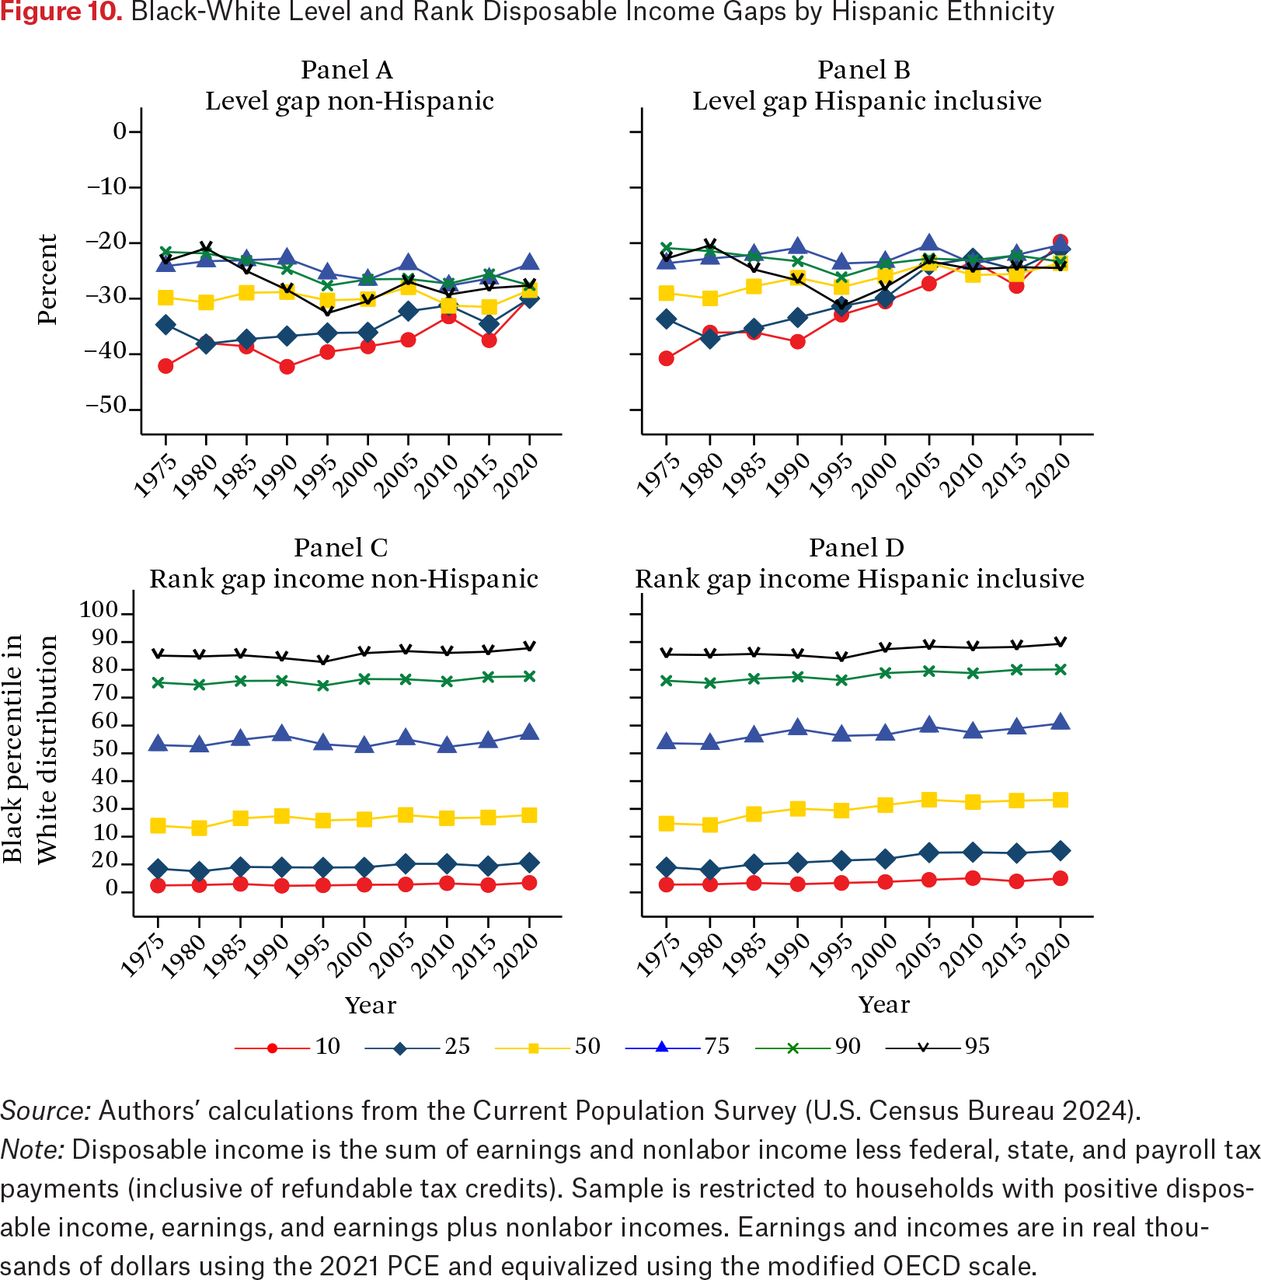
- Figure 10.
Black-White Level and Rank Disposable Income Gaps by Hispanic Ethnicity
Source: Authors’ calculations from the Current Population Survey (U.S. Census Bureau 2024).
Note: Disposable income is the sum of earnings and nonlabor income less federal, state, and payroll tax payments (inclusive of refundable tax credits). Sample is restricted to households with positive disposable income, earnings, and earnings plus nonlabor incomes. Earnings and incomes are in real thousands of dollars using the 2021 PCE and equivalized using the modified OECD scale.


Additional Files
Appendix
Appendix
Files in this Data Supplement:
In this issue


Jump to section
Related Articles
Cited By...
- No citing articles found.