
Abstract
This article uses recently released data from the 2020 Census, along with earlier censuses, to document the geographic spread of several signature dimensions of rural demographic change over the past three decades. These include depopulation, deaths, diversity, and deprivation—the 4Ds—which are now reshaping rural America, perhaps as never before. Rural America is at a crossroads. Since 1990, nonmetro counties have diverged along two tracks, one marked by population growth and renewal, the other by stagnation and lagging economic growth. We show that urbanization is a marker of rural demographic success, and that many nonmetro counties have been left behind in today’s metropolitan and global economy.
Rural America is at an inflection point of recent U.S. demographic history. The 2020 Census now reveals that only 14 percent—roughly forty-six million people—live in nonmetro America. The social and economic implications of widespread rural decline have reverberated throughout society. They are revealed in an uptick in spatially concentrated poverty and growing income disparities (Thiede, Kim, and Valasik 2018), in COVID-related deaths and increasing “deaths of despair” from alcohol and drug abuse (Case and Deaton 2021; Cheng, Sun, and Monnat 2020; Knapp et al. 2019), in the politics of rural disaffection, resentment, and extremism, including White nationalism and antigovernment hate groups (Cramer 2016; Edelman 2021; Feinburg, Branton, and Martinez-Ebers 2022) and, ultimately, in rural voting trends and Trumpism (Albrecht 2019; Johnson and Scala 2022; Mettler and Brown 2022; Monnat and Brown 2017).1 Now is an especially propitious time to take demographic stock of the state of rural America.
This article presents recently released data from the 2020 Census, along with earlier censuses, to document the diverging trajectories in four signature dimensions of America’s rural population change since 1990. These include depopulation, deaths, diversity, and deprivation—the 4Ds—which are now reshaping rural America, perhaps as never before. To be sure, rural America has suffered historically from depopulation (Johnson and Lichter 2019). What is new over the past decade is that rural America, for the first time, lost population in the aggregate and in the majority of all nonmetro counties (Lichter and Johnson 2023). Depopulation is a consequence of chronic out-migration and aging in place, which has pushed the number of rural deaths to levels in excess of births, reinforcing a downward demographic spiral. Rural in-migration, including some recently arrived immigrant and refugee populations have at the same time increased racial and ethnic diversity, a trend reinforced by White depopulation, out-migration, and natural decrease. The influx of historically disadvantaged populations may offset rural decline but also potentially heightens economic deprivation—poverty and inequality—among rural people and places left behind (Lichter and Johnson 2020; Ulrich-Schad and Duncan 2018). The demographic impacts on rural America are cumulative over time and inextricably linked to global and urban economic restructuring (that is, offshoring of jobs and transnational migration). We provide an empirical benchmark and substantive insights about recent rural demographic change as well as key methodological lessons for a growing interdisciplinary research community focused on rural America (see Clark, Harper, and Weber 2022).
Our analyses of recent population change reveal divergent tracks—“two rural Americas”—that point to new policy challenges as well as potential opportunities for renewed growth and rural economic development (for example, green energy or recreational development). Our objectives are both descriptive and didactic. We provide up-to-date estimates of depopulation, deaths, diversity, and deprivation over the 1990 to 2020 period. Census data tell a familiar story of chronic and widespread rural population decline, rapid aging and dying in place, growing racial and ethnic diversity, and upticks in absolute and relative economic deprivation. Yet, another story is sometimes overlooked: ongoing urbanization and economic development across rural America (Johnson and Lichter 2020). This article highlights evidence of growing spatial inequality and rural demographic differentiation. National patterns and trends may obfuscate underlying spatial variation, masking the emergence of rural slums or ghettos (Brown, Mettler, and Puzzi 2021; Parker 2022) and overlooking new patterns of rural gentrification (Sherman and Schafft 2022). Our empirical approach, based on data from the past four U.S. Censuses, highlights cumulative rural disadvantages and advantages that are rooted in self-reinforcing patterns of local-area depopulation, deaths, diversity, and deprivation.
BACKGROUND
Urbanization continues apace in the United States. Indeed, over the past half century, U.S. resettlement patterns are revealed in continuing metropolitanization, a product of the ongoing transformation from a rural agrarian society to an urban industrial and postindustrial society, and population deconcentration, the centripetal expansion of metropolitan regions to the suburbs and beyond. Rural growth and development have languished, left behind by ongoing urbanization (Fuguitt 1972; Silva 2019; Wuthnow 2018).
The 4Ds of depopulation, deaths, diversity, and deprivation are most often associated with metropolitan inner-city populations, that is, with the so-called urban underclass (for a recent review and critique, see Wacquant 2022). William Julius Wilson (2011) in his seminal book When Work Disappears: The World of the New Urban Poor describes the loss of good jobs in the city, the massive exodus of the White middle class, growing Black concentration and segregation, and the rise of the “truly disadvantaged” and an “underclass”—mostly poor Black and Brown people. Throughout much of the 1950s and 1960s, major metropolitan cities, especially in the Rust Belt, suffered from heavy population losses to the suburbs (especially of non-Hispanic Whites). The 1965 passage of Hart-Celler Act, followed by Immigration Reform and Control Act of 1986 (IRCA), opened the door to new immigration from Latin America and Asia, joining African Americans left behind in poor inner-city neighborhoods. Racial diversity accelerated. Urban neighborhoods were transformed, unmasking widespread neighborhood inequality and racial segregation, along with ethnoracial disparities in “deaths of despair” (that is, drug-related deaths and homicides). Inner-city deprivation took a myriad of forms: concentrated poverty, welfare dependence, inadequate and overcrowded housing, family disruption, and joblessness; meanwhile, mass incarceration mushroomed (Massey and Denton 1993; Wilson 2012).
Pessimistic narratives of inner-city decline and dysfunction have seemingly moved to the countryside and to small-town America (Albrecht and Albrecht 2000; Jensen 2018; Ramirez and Villarejo 2012). America’s spatial boundaries have blurred over time with advances in transportation and communication networks, which have knitted together America’s rural and urban populations as never before (Lichter and Brown 2011). Rural and urban America represent flipsides of the same demographic coin, which argues the need for a spatially inclusive perspective that acknowledges spatial interdependence—social, demographic, and economic—rather than impermeable spatial boundaries (Lichter and Ziliak 2017).
Growing spatial interdependence is revealed in each of the 4Ds. For example, chronic rural population losses from nonmetro out-migration have redounded to metropolitan America, both directly and indirectly through the large second-order effects of high fertility. Rural-to-urban migration historically has been selective of young, mostly White adults of reproductive age, leaving behind an aging-in-place older population along with higher death rates no longer balanced by births (Johnson 2021). A burgeoning immigrant and refugee population in new immigrant destinations has helped offset White population losses in some rural areas. In-migration and fertility among immigrant groups have transformed the racial and ethnic composition of many small towns, especially among young adults and children (Lichter 2012; Johnson and Lichter 2016). That rural America has historically exported many of its “best and brightest”—those with high education and skilled occupations—has further reinforced persistent poverty and economic inequality in left-behind rural communities. Recent influxes of disadvantaged minority populations into rural areas further contributes to the geographic concentration of poverty across rural America (Lichter, Parisi, and Taquino 2022; Thiede, Kim, and Valasik 2018). Although not always appreciated, rural and urban America arguably have followed similar and interrelated trajectories of population growth and decline, but during different historical periods and for different reasons having different social and political implications.
The 4Ds of Rural Demographic Change
Our stylized portrait of America’s rural demographic transformation, of course, risks obfuscating a fuller understanding and nuanced appreciation of recent change and variation among rural people and places. There is no single rural America. The usual narrative of rural decline is incomplete and often wrong. Whether rural America is failing or succeeding is not always obvious or straightforward. As with growing disparities between metro and nonmetro America (that is, the so-called rural-urban divide), rural America itself is seemingly increasingly divided along two demographic tracks, each differentiated by one or more of the 4Ds. One track is marked by chronic rural decline, now and into the future; the other is represented by resilience, growth, and revitalization.
Depopulation
Among all nonmetro counties (defined in 2013), more than 40 percent reached their population peaks in 1950 or earlier (Johnson and Lichter 2019). Over the last decade, nonmetro counties lost population in the aggregate for the first time (Johnson 2023), which is consistent with the usual narrative of rural decline. Data from the 2020 Census in fact reveals that the majority of the nation’s 3,143 counties (or equivalents) saw their population shrink since 2010. These were overwhelmingly nonmetro counties, where roughly two-thirds lost population between 2010 and 2020. This figure contrasts sharply with the 20 percent of all metro areas that lost population between the last two censuses (Mackun, Comenetz, and Spell 2021).
This story of rural decline, however, fails to acknowledge that nonmetro population change is due to endogenous growth or decline in a fixed universe of nonmetro counties, and growth or decline from nonmetro-to-metro reclassification. Most studies focus on the first and ignore the second (Johnson and Lichter 2020; Lichter, Thiede, and Brooks 2023). This is a mistake. Between 1980 and 2020, nearly twenty-three million rural people were lost to reclassification when their counties of residence were redefined as metro by the U.S. Office of Management and Budget (OMB) either because they grew enough to become new metro areas or were absorbed into existing metro areas. These were rural demographic winners but were not counted as such. The clear lesson is that reclassification hides the success, at least demographically, of many flourishing rural counties.
As we describe in this article, the urbanization of rural America, if nothing else, gives caution to the usual claims of rural decline. Reclassified rural counties have often grown more rapidly than the metro counties they join, reinforcing the process of urbanization (Johnson and Lichter 2019; Lichter, Brown, and Parisi 2021). More important, the decades-long winnowing of growing nonmetro counties from the nonmetro universe means that many nonmetro counties—as they are defined today—are increasingly left behind in America’s urban economy. Prospects for rural population and economic growth arguably will become even more limited in the future (Lichter and Johnson 2023).
Deaths
America’s rural population is aging rapidly. The baby boom generation has moved into retirement ages, driving up death rates to a point where rural deaths are no longer offset by births among a shrinking population of young adults depleted by chronic out-migration (Johnson 2020). Between 2010 and 2019, 46 percent of all U.S. counties experienced natural decrease, of which the large majority (79 percent) were classified as nonmetro (Johnson 2020). Since 2019, nonmetro areas also have suffered disproportionately from COVID-19 and deaths of despair (that is, opioids and alcoholism), further driving up rural death rates, even when adjusted for differences in age composition (Brooks, Mueller, and Thiede 2020; Mueller et al. 2021; Peters et al. 2020; Spencer et al. 2018).
High rates of mortality are a singular measure of population health and well-being, a clear indicator of social inequality and racial stratification (Jones et al. 2023). Indeed, the mortality gap between rural and urban America has grown since the turn from the twentieth century (Cosby et al. 2019; Elo et al. 2019). Life expectancy has declined in rural America but increased overall in urban America (Singh and Siahpush 2014; Abrams, Myrskylä, and Mehta 2021). Age-adjusted rural-urban differences also are broadly experienced across most major causes of death (such as cardiovascular disease or cancer). Much of the literature centers on rural-urban disparities in health insurance enrollment and access to health-care providers (that is, declining numbers of rural hospitals), as well as differences in health-care knowledge, such as education, and behavior, such as smoking and obesity (Cossman et al. 2010; James and Cossman 2017).
What about within-nonmetro variation in death rates and natural decrease? High amenity and retirement rural areas, in particular, are the most obvious counterpoint to the usual pessimistic image of declining health and growing mortality in rural America. The U.S. Department of Agriculture has developed a natural amenities scale that locates rural counties on a continuum from no amenities to six or more (Economic Research Service 2023). Between 1970 and 2015, population growth rates increased monotonically with increases in amenities, as defined by standard deviations (SD) from the mean. For example, for counties with natural amenities three or more SDs from the mean, nonmetro population growth from 1970 to 2015 increased by 166 percent. In counties at least one SD below the mean, population declined on average over this period. High amenity counties are often heavily populated by highly educated and affluent older persons with physical and financial access to hospitals, primary care physicians, and health specialists (Johnson 2023). New rural in-migration of older adults is sometimes characterized as “gray gold” or “rural gentrification” (Brown et al. 2011; Sherman 2021). Unlike aging in place in dying rural communities, newly arrived older retirees in recreation and retirement communities often bring needed human capital, leadership skills, income, and tax dollars to local rural economies without making large demands on government infrastructure or displacing indigenous local workers.
Diversity
Rural America is diversifying as never before (Lee and Sharp 2017; Lichter 2012). Although racial minority and immigrant populations have made rural America their home for decades, they often remained invisible—at least until recently. They have been spatially isolated and forgotten in poor Black Belt counties of the deep South, including the Mississippi Delta region, on remote Indian reservations in Oklahoma and other parts of the agricultural heartland, and in the Southwest, especially along the lower Rio Grande borderland, where Latinos and Mexico-origin immigrants have lived for centuries. The difference today is the extraordinary spatial diffusion of America’s burgeoning immigrant population, made increasingly visible by working side-by-side with Whites in new destinations. Latinos, in particular, are now employed in corporate agriculture (picking fruits and vegetables), dairy farms, aquaculture, slaughterhouses, timber, and construction (Lichter and Johnson 2020).
The racial transformation across rural America is a complicated tale of racial and spatial divergence. For much of rural America, Whites are the overwhelming share of the population. Data from the 2020 Census show that 76 percent of the nonmetro population remains non-Hispanic White, down only slightly from 2010 (80 percent), but still substantially higher than in metro counties overall. In other regions and counties, Blacks, Hispanics, and Native Americans predominate but remain separated geographically from the White majority living elsewhere and from each other (Lee and Sharp 2017). According to D. W. Rowlands and Hanna Love (2021), the “future of rural America is increasingly marked by growing diversity and expanding inequity within and across regions.” If racial integration in a multicultural society is defined by racial mixing (of all kinds), then most rural counties seemingly are still characterized as largely monoracial rather than multiracial.
Growing rural diversity, in the aggregate, largely reflects increases in America’s Hispanic population (Johnson and Lichter 2016). Since 1990, nearly two-thirds of all rural population growth was due to Hispanic population growth (Lichter and Johnson 2023). From 2010 to 2020, the rural population declined in the aggregate, largely because Hispanic and minority population growth has slowed and can no longer fully offset White population loss. Still, roughly two hundred rural counties experienced population growth, but only because minority population growth offset White decline. White natural decrease and out-migration are now characteristic features of much of rural America, but they also are highly selective of some types of counties (such as agricultural and extractive) but not others, an empirical regularity that further amplifies the demographic and economic consequences of the Hispanic diaspora. The key empirical question today is whether new minority population growth provides a demographic lifeline to dying rural communities or instead has occurred in tandem with White growth and economic development in still-growing rural counties (such as high amenity or retirement areas). Is racial diversification a key to rural growth? Or is it a consequence of rural growth, which is fueled by a global and urban racially diverse population of recent rural arrivals? The answer informs our general understanding of rural renewal or stagnation.
Deprivation
Economic deprivation, especially poverty and inequality, are inextricably linked as both cause and effect to each of the other 4Ds—to rural depopulation, deaths (natural decrease), and diversity. Depopulation is a clear economic indicator of rural economic resilience and sustainability (Peters 2019). It is rooted demographically in population aging, a result of chronic out-migration of young adults and their children. Schools and hospitals risk closing, good jobs evaporate, and the local tax base erodes, culminating in a cycle of economic decline and out-migration. This is most evident in rural communities historically dependent on extractive industries, on agriculture, dairy, textiles, mining, and forestry, where the mechanization and consolidation of production, along with offshoring, has affected rural communities especially hard. Jobs previously filled by dwindling numbers of working- and middle-class Whites are now attracting low-wage and non-unionized workers from Mexico and other parts of Latin America, who have filled the labor void. Racial and ethnic diversity has brought new demands for moderate-income housing, schools, and social services. Even with population and job growth, rural poverty often remains high and persistent (for example, rural central Appalachia), passed along from generation to generation, and reinforced both by new in-migration and selective out-migration (that is, by education and social class).
Some scholars have recently introduced the idea of emerging rural ghettos (or rural slums) populated by a new “rural underclass” (Burton, Garrett-Peters, and Eason 2011; Eason 2012), an idea that has clear parallels to concentrated inner-city poverty (Wilson 2011, 2012). Rural ghettos take various forms, including Hispanic boomtowns such as those home to slaughterhouses or meatpacking plants (Lichter 2012), isolated rural trailer parks, now relegated to the countryside by new local zoning ordinances (Brooks and Mueller 2020; Salamon and MacTavish 2017), persistent Black-White segregation in southern rural communities (Lichter et al. 2007), municipal underbounding and racially selective annexation (Aiken 1987), and newly concentrating rural poverty (Thiede, Kim, and Valasik 2018). The clear implication is that the 4Ds may cluster in some rural counties or regions, reinforcing rural deprivation of all kinds.
This gloomy demographic scenario may of course mischaracterize other rural success stories. How commonplace is rural affluence or prosperity? Is growing rural affluence revealed in urbanization but hidden from public view by nonmetro-to-metro reclassification? Although evidence is lacking, growing affluence could simply be located in the excess mortality and out-migration of less educated and poor residents. Clear lessons come from gentrifying inner-city neighborhoods, which have rebounded over the past decade from chronic population decline, White flight, and neighborhood poverty. Is this demographic and economic transformation—rural gentrification—now emerging in some rural counties? In the ski regions of the Rockies or in scenic areas of New England and the Upper Great Lakes? If so, then the usual rural narrative should be amended. Of course, whether rural gentrification should be regarded as success is a value judgment. As a demographic process, it nevertheless argues the need for identifying those predisposing conditions (such as proximity to metro areas and natural amenities) or rural development strategies that lead to success, however it is defined.
CURRENT STUDY
The recent release of data from the 2020 Census, along with previous censuses and census products (such as the Current Population Survey or American Community Survey), provide a timely opportunity to take stock of rural America. This is accomplished by placing the empirical spotlight on the 4Ds—depopulation, deaths, diversity, and deprivation—which reveal growing rural-urban social and economic disparities (Clark, Harper, and Weber 2022), while underscoring spatial interactions at the so-called rural-urban interface (Lichter and Brown 2011; Lichter and Ziliak 2017). We complement the usual urban-centric focus on metropolitan America and the rural-urban divide, emphasizing instead the urbanization of rural America, which we regard as an indicator of full participation in mainstream society and the American way of life. Of course, success has different meanings to different people. We update and reorient the conventional narrative of rural decline to one highlighting divergent tracks of rural demographic change (that is, two rural Americas). Our study provides a conceptual framework and empirical baseline that serves as a point of departure for renewed analyses and discussions of rural America in transition.
METHODS
We use data on all 3,141 U.S. counties for much of our analyses, but focus our discussion largely on nonmetropolitan counties. Counties are inclusive of the entire U.S. population (unlike cities and communities) and the boundaries that define them are generally stable over time. Harmonized county data from 1990 to 2020 include county indicators of the 4Ds, including tabulations from the recently released 2020 Census, intercensal and postcensus population estimates, and the American Community Survey. Additional analyses are based on fertility and mortality data from Centers for Disease Control and Prevention (CDC), historical poverty and economic data from the Economic Research Service of the U.S. Department of Agriculture, and the Social Vulnerability Index developed by CDC’s Agency for Toxic Substances and Disease Registry (ATSDR).
Measurement
Here we briefly describe how we measure and justify each of the 4Ds at the county level.
Depopulation
Our baseline analyses focus on interdecadal county population growth and decline, comparing nonmetropolitan with metropolitan counties as they are defined by OMB in 2018. We consider growth and decline over the 1990 to 2020 study period as well as over the past decade, documenting the changing share of counties experiencing absolute population decline. Our analyses also consider the substantive implications of using a fixed 1993 definition of nonmetropolitan counties and following them prospectively until 2020. This is important because population change over time can be partitioned into population change in the universe of counties classified as nonmetro throughout the study period (endogenous change), and population change that results from administrative transfers of counties from nonmetro to metro status (reclassification).
Deaths
We use county data on births and deaths since 1990 as well as highlight the converging trajectories of birth and death rates over the study period. We also consider natural population change, which we define as the difference between births and deaths over the past decade or the entire 1990 to 2020 study period. Natural decrease occurs when deaths exceed births, which in turn either depresses county population growth rates or exacerbates decline. Our time series of births and deaths does not include the COVID-19 pandemic, which dramatically altered mortality patterns and accelerated the incidence of natural decrease in both rural and urban America.
Diversity
Our analyses present population growth differentials among America’s racial and ethnic populations. To harmonize race data each decade, we focus on Hispanics, non-Hispanics Whites, non-Hispanic Blacks, and non-Hispanic Asians, and all other groups (including mixed race populations). We use the Simpson Diversity Index, which measures the probability that any two people, drawn randomly from a county, will be of a different race or ethnicity.2 A diversity index of 40, for example, indicates that the probability that any two county residents will be of a different race is 40 percent. We document significant increases nationally in the diversity index, as well as growing heterogeneity across U.S. counties.
Deprivation
National estimates of nonmetro poverty over the 1990 to 2019 period are based on data from the U.S. Census Bureau’s Annual Social and Economic Supplement to the Current Population Survey. We also draw on two sources of county data from the Economic Research Service (2023). County data for 1990 come from the decennial census STF3 and the 2019 data are from the ACS five-year 2015–2019 cumulative file. Individuals or families are defined as poor if their total money income from earnings, Social Security, and other pre-tax cash income (such as public assistance, interest income) is below a specified poverty income threshold based on family size and composition. The average poverty threshold for a family of four was $26,172 in 2019. The poverty threshold was $12,490 for a single-person household. We supplement our analysis of poverty and income with the newly available Social Vulnerability Index (SVI) developed by the Centers for Disease Control and Prevention (2023). The SVI identifies community vulnerability to hazardous events, and its ability to respond to natural and human-made hazardous events. For our purposes, we focus on the subcomponent of the SVI that measures vulnerability based on socioeconomic status. It is a composite indicator of unemployment, housing cost burden, lower education attainment, absence of health insurance and poverty, which closely align with the concept of deprivation. Our time series ends in 2019, before the onset of the COVID-19 pandemic, which distorted national and subnational patterns of employment, earnings, family structure, and census coverage.
Empirical Approach
Our empirical approach is largely descriptive. We identify diverging county patterns of nonmetro population growth and decline, natural increase and natural decrease, racial diversity and homogeneity, and poverty and affluence. We also provide evidence of whether patterns of convergence or divergence across each of the 4Ds are overlapping or distinct, which has implications for a growing spatially concentrated rural underclass. The percentage distribution of each of our 4Ds across nonmetro counties is provided in the online appendix.3
RESULTS
We discuss our results according to the 4Ds.
Depopulation
Large shares of nonmetropolitan counties—roughly 40 percent—reached their population peaks in 1950 or earlier (Johnson and Lichter 2019). This empirical fact is based on nonmetro counties as they are defined today (in the 2010s). Over the past century, nonmetro counties have lost population, both from endogenous population decline in a fixed set of counties and from a winnowing process in which fast-growing, more population counties are reclassified as metropolitan. Here we focus on population growth for all metro and nonmetro counties as defined in 2018 by OMB.
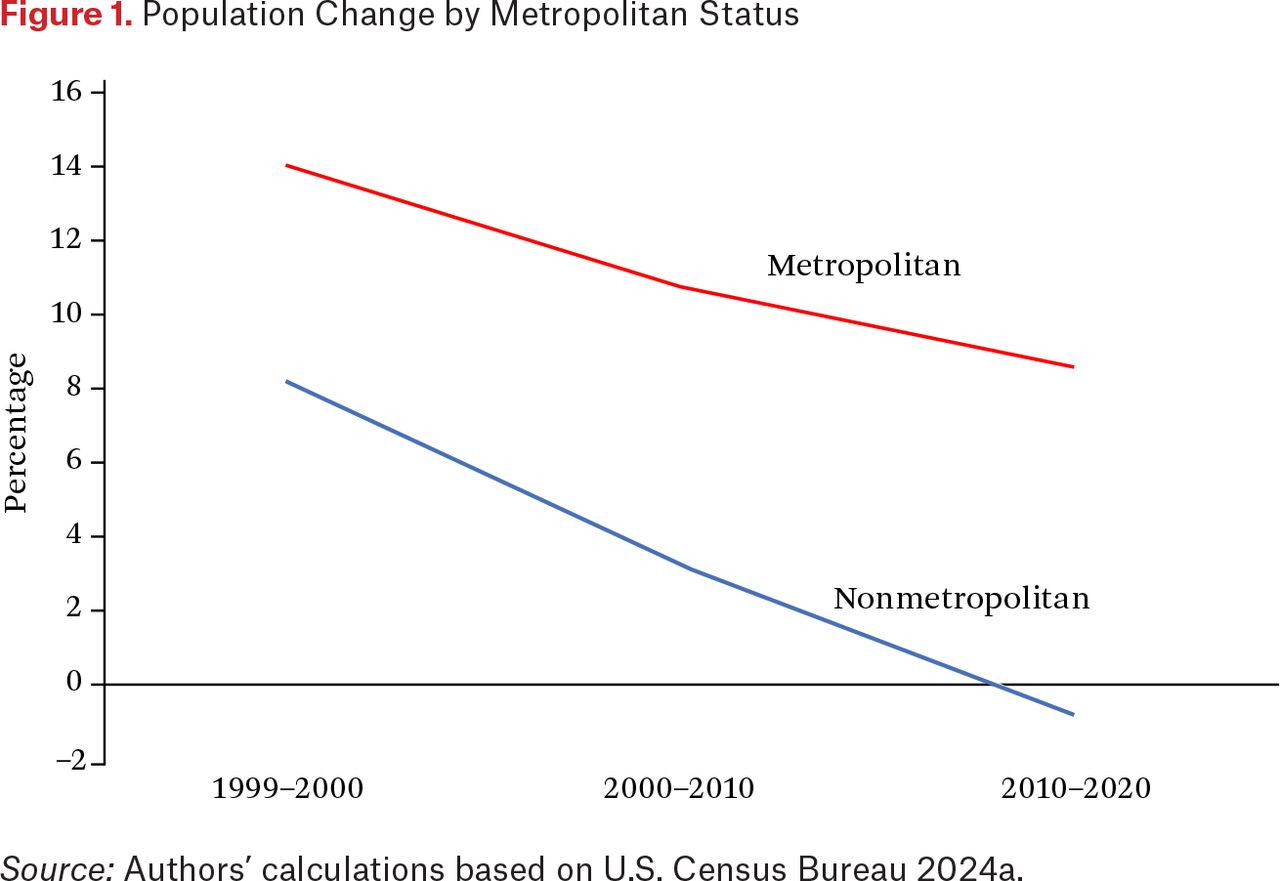
As a baseline, figure 1 provides population growth rates for 1990–2000, 2000–2010, and 2010–2020. These data show interdecadal declines in nonmetro population growth rates. Indeed, for the first time, today’s nonmetro counties experienced absolute population decline between decennial censuses.4 Population decline now characterizes many parts of rural America and portents a stark demographic future. To be sure, county population losses have been commonplace over the past century, yet nonmetro America in the aggregate continued to grow as a result of new immigration and high fertility. Today, the urbanization process has clearly accelerated, both from absolute nonmetro population decline and rapid metro population growth and reclassification.

Population Change by Metropolitan Status
Source: Authors’ calculations based on U.S. Census Bureau 2024a.
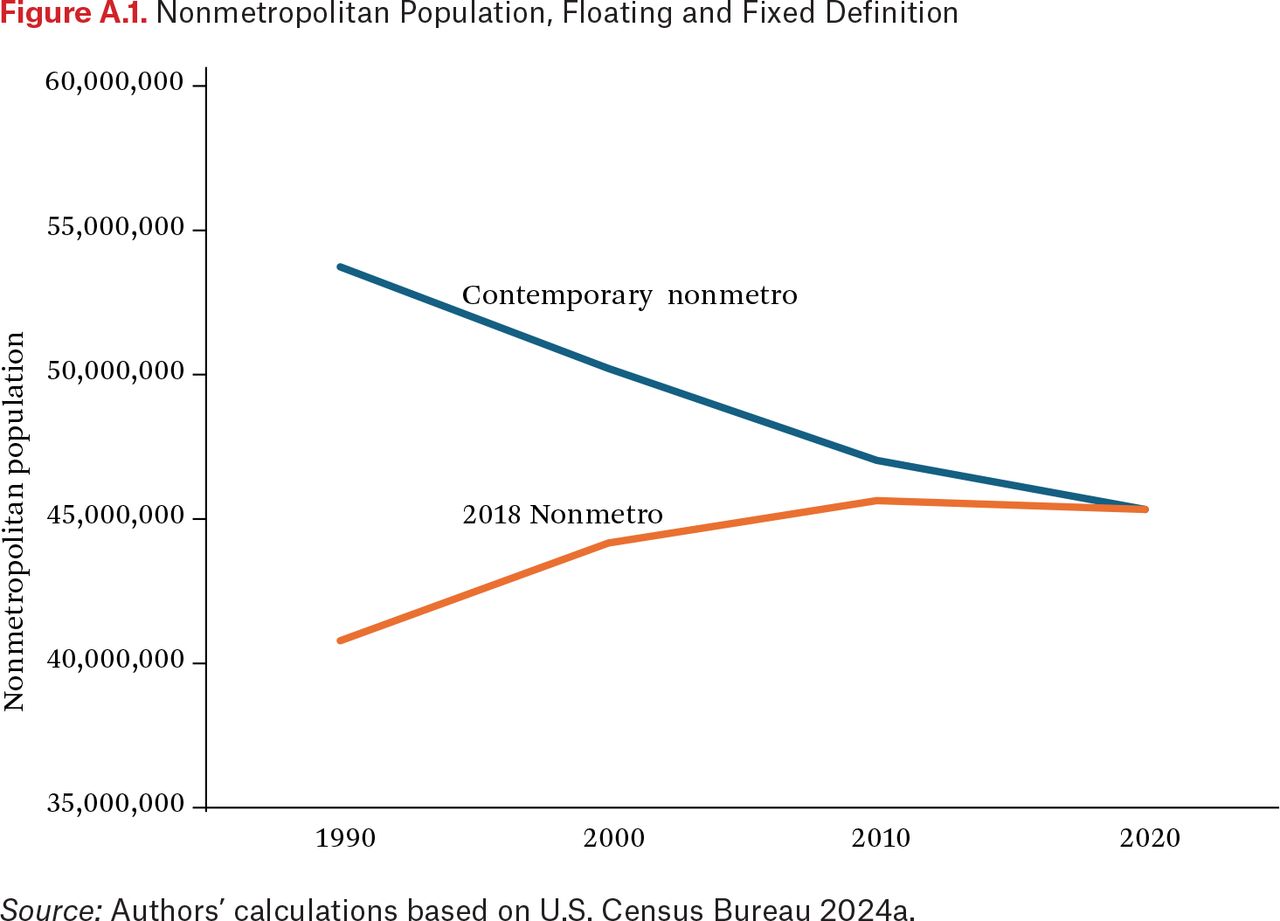
Growth rates today are seemingly diverging between metro and nonmetro counties, but also within nonmetro counties. In supplemental analyses provided in figure A.1, we illustrate that the comparatively slow nonmetro population growth during the 1990s and 2000s, along with nonmetro population decline in the 2010s, has been reinforced by nonmetro-to-metro reclassification. The floating contemporary definition redefines growth each decade using updated metro classifications based on the most recent census counts. In the absence of reclassification, however, roughly sixty-three million people would have been counted as living in nonmetro counties in 2020 (data not shown). Instead, nonmetro America was officially home to only forty-six million in 2020. Along with slow or declining rates of endogenous population growth, metro reclassification has taken a large bite out of America’s nonmetro population.
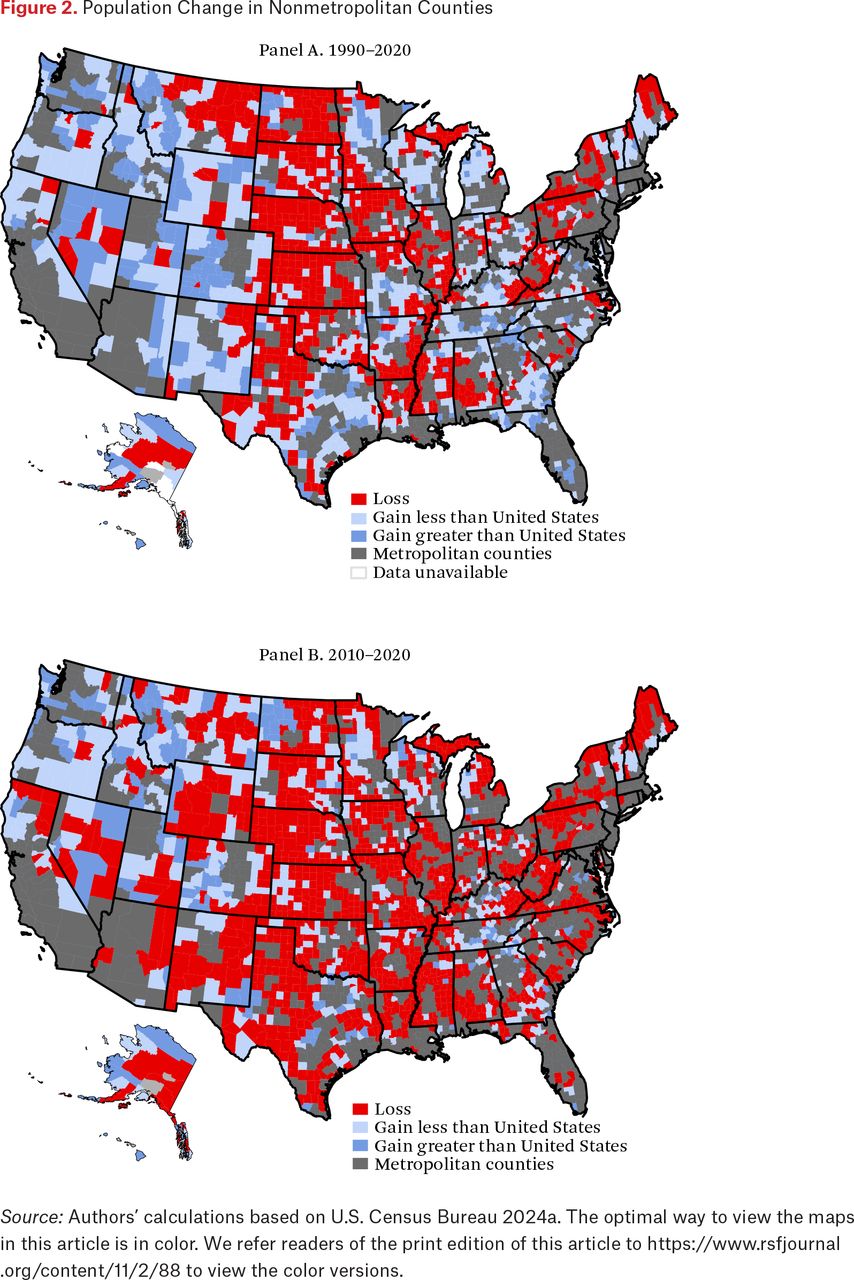
The maps in figure 2 highlight the geographic reach of nonmetro decline across America since 1990 (panel A) and over the past decade (panel B). Here we identify counties with growth rates higher than the U.S. average, counties with positive growth but less than the U.S. average, and counties that experienced population loss. For the entire period, population loss occurred in nearly one-half (46 percent) of all nonmetro counties. These included nonmetro counties in the agricultural heartland, in the so-called Black Belt in the Mississippi Delta and Deep South, and in the lower Rio Grande River valley (panel A, figure 2). Only a small fraction of nonmetro counties over the period experienced population growth rates exceeding the national average (13 percent).

Population Change in Nonmetropolitan Counties
Source: Authors’ calculations based on U.S. Census Bureau 2024a. The optimal way to view the maps in this article is in color. We refer readers of the print edition of this article to https://www.rsfjournal.org/content/11/2/88 to view the color versions.
Diverging trajectories of growth and decline are further illustrated in panel b of figure 2, which provides a map of county population changes over the past decade. The key point here is that nonmetro population losses have increased and are more widely distributed across the United States. Between 2010 and 2020, 67 percent of all nonmetro counties lost population and the share growing faster than the U.S. average dropped from 13 to 8 percent. Nonmetro growth has languished. This statistical portrait nevertheless is not without nuance, especially if population change is tracked using a fixed universe of nonmetro counties in 1993 rather than 2018. Of the 395 nonmetro counties reclassified as metro between 1993 and 2018, 36 percent grew faster than the U.S. average over the 1990 to 2020 period. The commonplace narrative of rural counties left behind—rural depopulation and dying small towns—is at odds with evidence showing that many nonmetro counties reclassified as metro over the study have flourished, as did a significant number of counties that remained nonmetropolitan throughout.5
Deaths
Shifting trajectories of rural growth and decline are rooted in the demographic processes of migration, fertility, and mortality. High rates of nonmetro-to-metro out-migration, along with low rates of nonmetro in-migration, have slowed rural growth trajectories over the past century. Nonmetro out-migration is highly selective of young adults of reproductive age, thus reducing fertility. With net out-migration and low fertility comes population aging and higher death rates. High death rates are now a characteristic demographic feature of rural America (Brooks, Mueller, and Thiede 2020; Johnson 2020; Monnat 2020) that is redefining its demographic vitality and long-term sustainability.
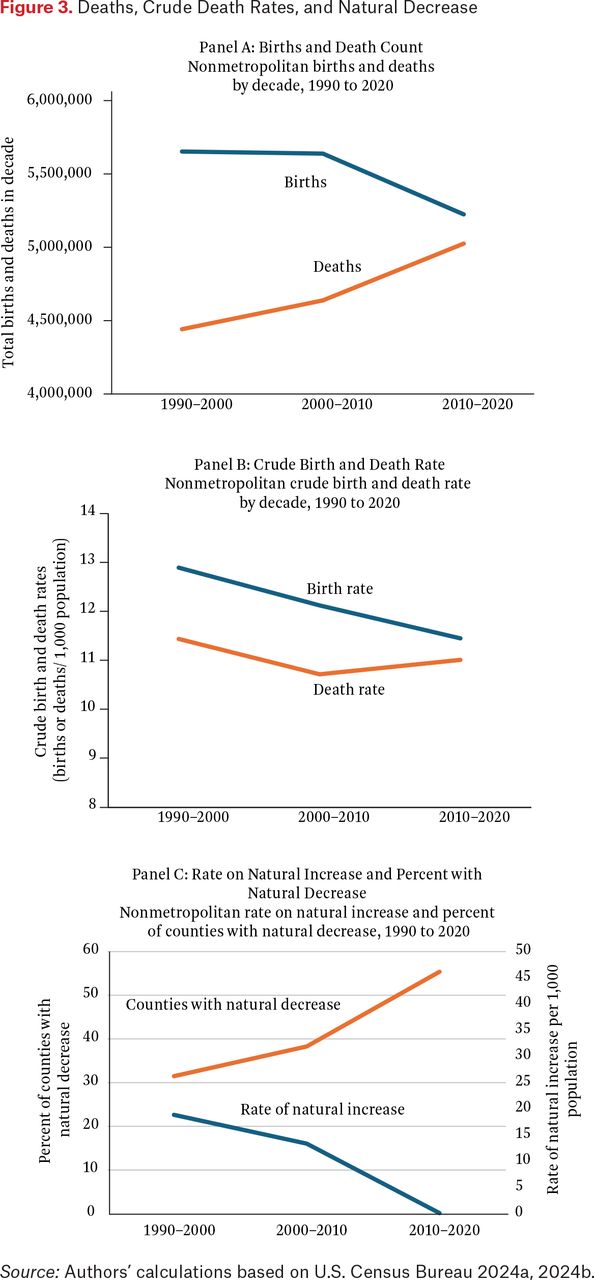
Figure 3, panel A shows converging trajectories of nonmetro births and deaths, along with birth and death rates, for 1990–2000, 2000–2010, and 2010–2020. Births and birth rates have plummeted, especially over the past decade. The number of deaths, on the other hand, has marched upward from decade to decade. Crude death rates have increased from 10.7 deaths per 1,000 in the 2000s to 11.0 per 1,000 in the 2010s (see figure 3, panel B). Diverging trajectories of fertility and mortality reflect especially rapid population aging in rural and small-town America. Indeed, the share of the nonmetro population aged sixty-five and older increased from 15.4 percent in 1990 to 19.5 percent in 2020 (data not shown). Nonmetro age-standardized death rates declined during the 2000s but then stagnated between 2010 and 2019, and metro age-standardized deaths continued to decline after 2010 (Curtin and Spencer 2021). The mortality gap between metro and nonmetro counties is growing quite independent from metro-nonmetro differences in population aging (see online appendix 2).

Diverging rates of fertility and mortality are responsible for unprecedented declines in rates of rural natural increase since 1990, from roughly eighteen more births than deaths per thousand during the 1990s to virtually zero growth from natural increase over the past decade (see figure 3, panel C). Even more striking is that the majority of all nonmetro counties (55 percent) over the past decade experienced natural decrease, up from just 22 percent in the 1990s.6 Much of nonmetro America is locked in a long-term downward demographic spiral, rooted in chronic out-migration that is no longer offset by natural increase.
The county map in figure A.2 illustrates the dramatic increase in the incidence of natural decrease counties in the past decade. In all, 38 percent of all nonmetro counties had more deaths than births between 1990 and 2020, and an additional 18 percent experienced natural decrease from 2010 to 2020 after having natural increase before 2010. The important point is that natural decrease has proliferated and spread across America’s nonmetro counties. Not surprisingly, the excess of deaths over births was most common among counties that lost population, especially during the past decade. These data raise policy questions about the resiliency and sustainability of America’s nonmetro counties, and about where public interventions and investments are most likely to reap demographic dividends.
Diversity
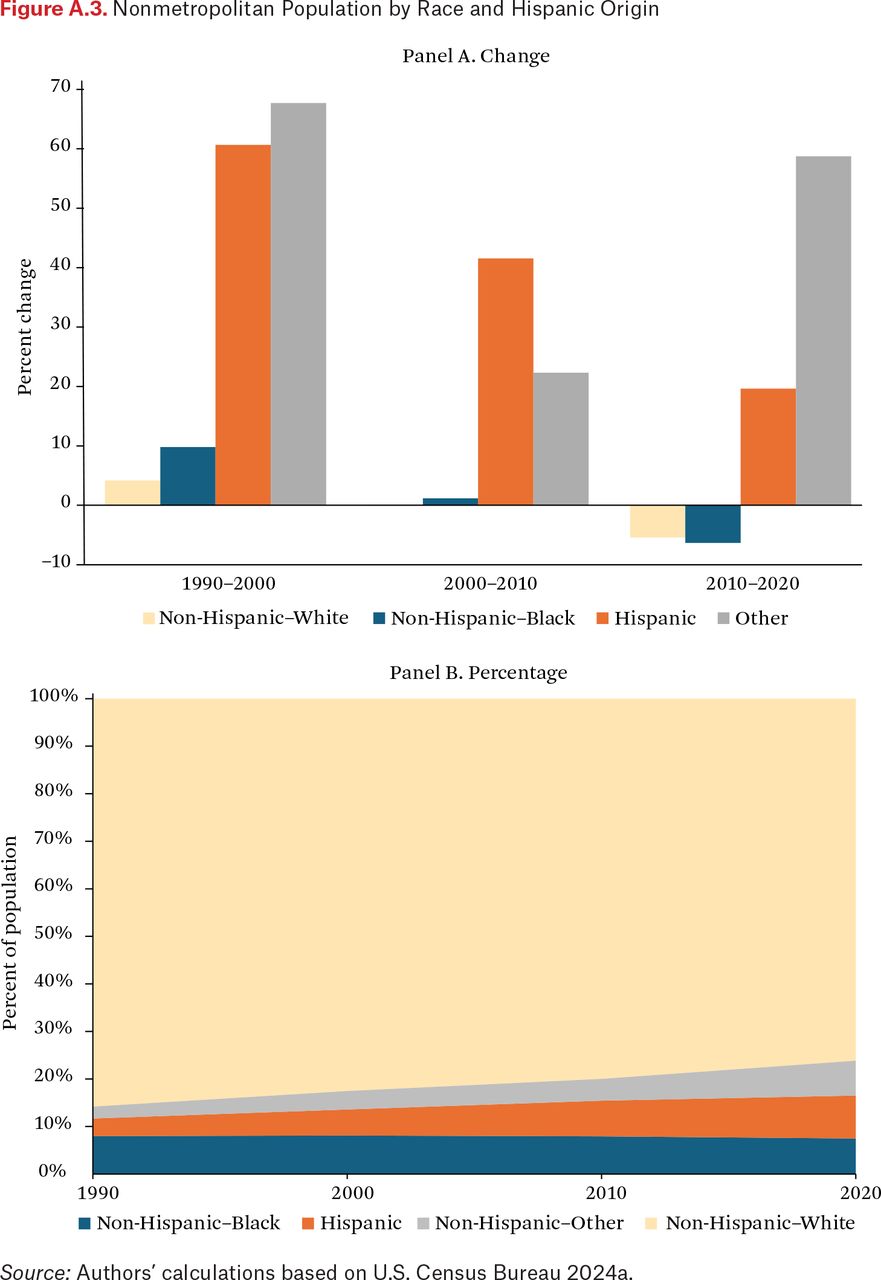
Perhaps ironically, increasing numbers of racial minority and immigrant populations have provided demographic counterweight to chronic rural depopulation and economic decline. All of the growth in nonmetro areas over the past two decades was a result of growth in the non-White and non-Black populations (see figure A.3, panel A). Rural economic restructuring has provided new jobs—in corporate agriculture, hospitality, and the service industry—that have attracted minority and immigrant workers with limited skills and education. The result is that the White population in rural America declined from roughly 85 percent in 1990 to about 75 percent in 2020. Additionally, with the onset of the pandemic, natural decrease will continue to rise in nonmetro America (Johnson 2023).7
Diversity has increased significantly over the past three decades in rural America. Our baseline analyses of nonmetro diversity scores, based on the Simpson Diversity Index, show steady decade-to-decade increases. The diversity index estimates the probability that any two randomly drawn residents of the county will have different ethnoracial backgrounds. In 1990, the diversity index in nonmetro America was roughly 18, meaning that rural residents had a less than 1 in 5 probability of exposure to persons of another race in their counties of residence (data not shown). By 2020, the diversity index climbed to nearly 31, about a 1 in 3 probability of exposure to other residents in the county was entirely random.8 Rural racial and ethnic diversity is now higher than ever.
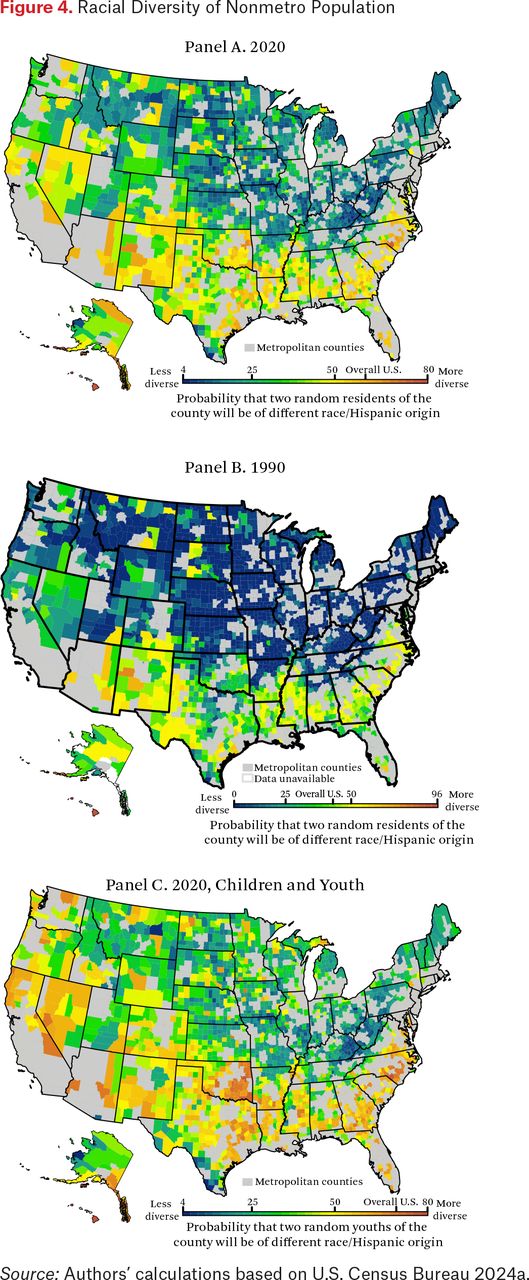
Racial diversity, of course, is distributed unequally across America’s nonmetro counties. The post-1990 rise in new immigrant destinations, especially among Hispanics, results from their spatial dispersal from traditional destinations, mostly in the Southwest, to other rural counties produced increasing concentrations of minorities and immigrants. This conclusion is clearly supported in figure 4, panel A, which provides county-to-county variation in the diversity index in 2020. More diverse counties in the Midwest, as well as in the Texas and New Mexico, reveal substantial residential mixing of non-Hispanic Whites, Hispanics, and Native Americans. Interestingly, counties along the lower Rio Grande River remain overwhelmingly Hispanics, which is revealed both in very low ethnoracial diversity and spatial isolation from non-Hispanic populations.

Racial Diversity of Nonmetro Population
Source: Authors’ calculations based on U.S. Census Bureau 2024a.
The map also highlights considerably more racial diversity in the South and West than elsewhere. The high level of ethnoracial diversity in the old slave and plantation South is a vestige of historical Black settlement patterns. In much of the Black Belt crescent—from the Delta to Virginia—the diversity index exceeds 50 (figure 4, panel A). This means that local residents—predominantly Black and White—are as likely to be exposed to someone of different race as someone of the same race or ethnicity. These patterns of diversity contrast sharply with racially homogamous and predominantly White nonmetro counties in much of Appalachia (Kentucky, Tennessee, and West Virginia), the agricultural heartland, and northern New England states.
To highlight the shifting geography of ethnoracial diversity—both past and future—we provide two additional county maps. Figure 4, panel B maps county diversity scores in 1990, which suggest much lower diversity in the past. This is indicated by comparing the counties in 1990 and 2020. In 1990, far fewer nonmetro counties had diversity scores of 50 or higher. To anticipate America’s racial future, figure 4, panel C provides a map of county diversity scores for children and youth under age twenty. Growing racial and ethnic diversity occurs from the bottom up—starting with children. The main conclusion here is self-evident. Children are far more exposed to a diverse population (of other) children. Compared with panel A, which focuses on overall exposure to diversity, panel C shows many more counties with high levels of child diversity. Today’s rural baby boom population of mostly aging Whites will be succeeded over the next two decades by increasingly diverse populations of children as they transition into adulthood and bear children of their own.
Deprivation
The War on Poverty in the 1950s and 1960s brought sharp declines in the poverty gap between metro and nonmetro areas, but this was replaced in the 1990s by a 3 to 4 percent poverty gap that persists today. The official poverty rate in 2019 was 15.4 and 11.9 percent, respectively, in nonmetro and metro areas (see online appendix 3). Direct comparisons are difficult because the official measure does not adjust for spatial differences in the cost of living, consumption patterns, household living arrangements (cohabitation and doubling-up), informal work, or in-kind income. As an alternative measure, the Census Bureau’s Supplemental Poverty Measure (SPM) accounts for most government benefits and geographic differences in the cost of living. The SPM reveals higher poverty estimates than the official measure, at least until the pandemic (Fox and Burns 2021). In 2020, the nation’s official rate exceeded the SPM for the first time (11.4 versus 9.1 percent). Moreover, the SPM in 2015 was 13.2 percent in nonmetro areas, slightly lower than the 14.5 percent in metro areas (Shapiro and Sherman 2016). Unambiguous interpretations of the official poverty rate, especially when comparing metropolitan and nonmetropolitan areas, have been made difficult by nonmetro-to-metro reclassification. More populated, faster-growing, less remote, and more economically vibrant counties with lower poverty rates are most likely to be reclassified as metro over time, leaving behind mostly slow growing or declining counties with higher poverty rates (Johnson and Lichter 2020).9
Whether nonmetro counties are on divergent economic trajectories is similarly unclear. Are chronically poor nonmetro counties diverging from other nonmetro counties that have become less impoverished and more affluent over time? Figure 5 presents county maps that identify low-poverty counties, where the percentage of the population in poverty is less than 0.75 of the U.S. poverty rate; counties with moderate levels of poverty, where the percentage is between 0.75 and 1.25 times the national rate; high-poverty counties, where the percentage is 1.25 to 1.50 times higher than the national rate; and very high-poverty counties, where the percentage is at least 1.50 times higher (or 50 percent higher) than the national rate. County poverty in panel A is compared with U.S. poverty data for the 1990s; panel B is based on the 2010s. Divergence would be revealed in increasing shares of nonmetro counties below and above the national poverty rates.

In fact, the overall pattern is one of declining poverty rates between 1990 and 2019. This is clearly revealed by substantial declines in the number of high-poverty nonmetro counties (see figure 5). The percentage of very high-poverty counties dropped from 33 percent to 23 percent between 1990 and 2019. In particular, very high-poverty counties are far fewer today not only in the southern Black Belt, but also in the high plains of West Texas, central Appalachia (especially West Virginia), and isolated parts of the upper Midwest (especially the Dakotas). Extreme poverty is much less prevalent today than in 1990 if measured by the official poverty rate. At the other end of the county poverty distribution, the percentage of low-poverty counties increased from 11.4 percent to 16.6 percent in 2019. The expansion of low-poverty counties is plainly observed in the agriculture heartland, extending from the Dakotas to Kansas.
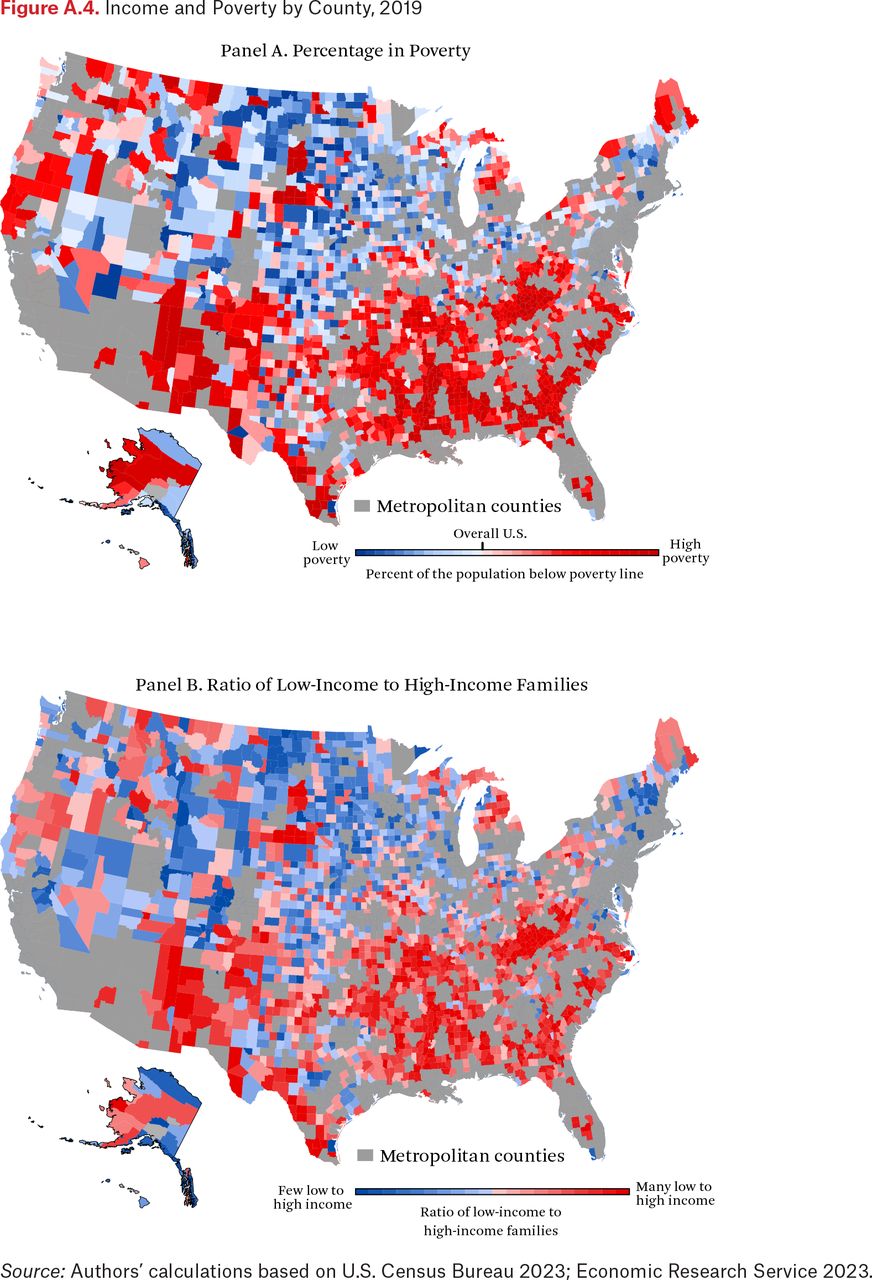
The geography of rural poverty remains striking, as indicated by continuing widespread rural poverty. The county map in figure A.4 (panel A) illustrates the substantial concentrations of relatively high poverty, especially in the South. Our comparison of nonmetro county poverty rates, measured in relative terms, does not obviate the need for place-based policy interventions. Income inequality is often extreme in high-poverty counties. This is revealed in figure A.4, panel B, which documents county variation in the ratio of percentages of low-income families (less than $25,000 annually) to high-income families (more than $150,000 annually) in 2019. A low ratio suggests high levels of family income inequality—a pattern revealed in counties with many poor families and comparatively few affluent families. The substantive point here is clear. Income inequality is most extreme in the South and least extreme in the Midwest.
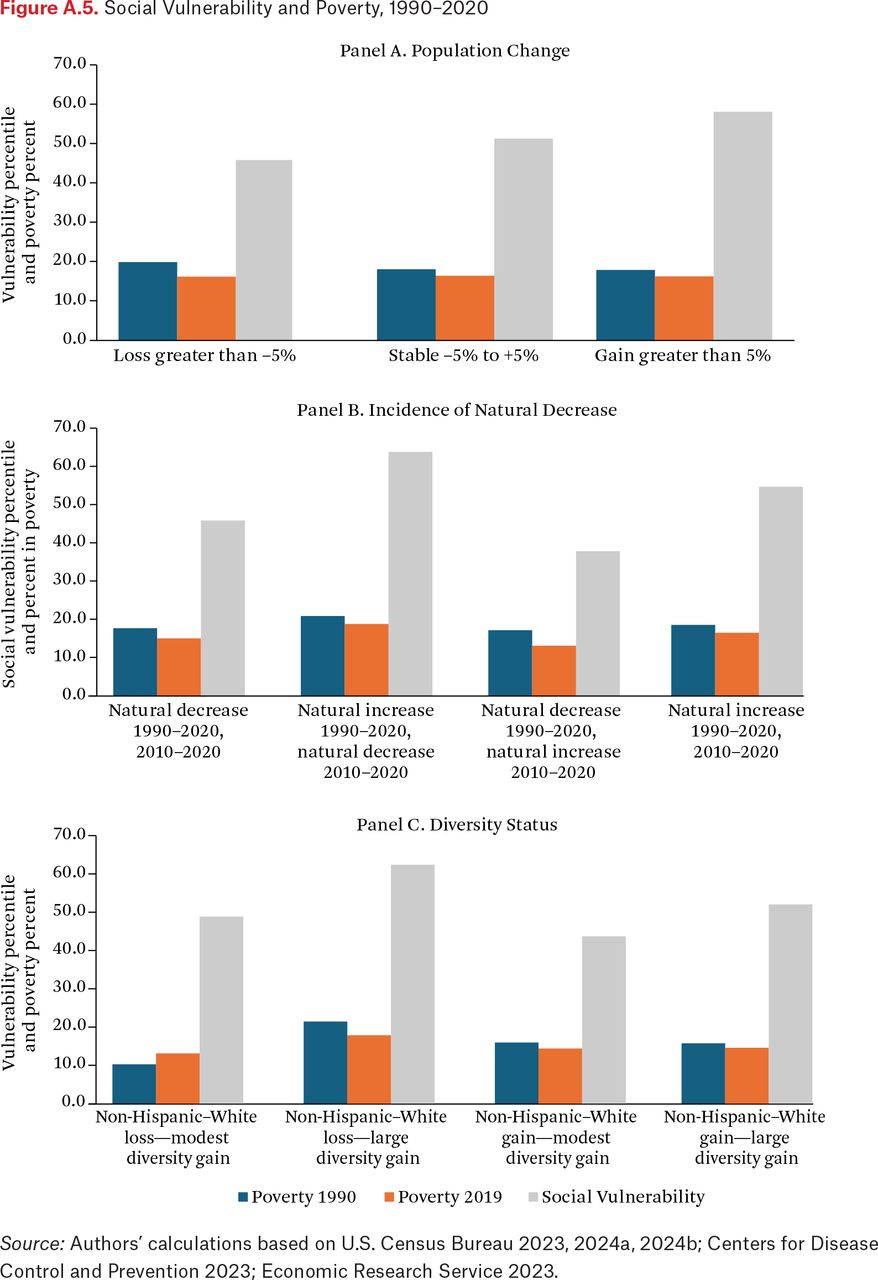
Finally, as a coda to our analyses of rural deprivation, we also consider whether the 4Ds overlap in ways that suggest a cumulative disadvantage in nonmetro America. In figure A.5, we show the statistical association between county poverty rates in 1990 and 2019 and each of the other 3Ds—depopulation, deaths, and diversity—as well as the Social Vulnerability Index. We ask a straightforward question: To what extent are depopulation (versus growth), deaths (natural decrease versus natural increase), diversity (above 0.50 versus below), and deprivation (above and below poverty) associated with the SVI?
These supplementary analyses reveal widespread declines in county poverty rates between 1990 and 2019. The only exception is nonmetro counties that experienced White population decline and gains in racial diversity, where poverty rates increased between 1990 and 2019. The largest declines in poverty were observed in counties that experienced natural increase in the 2010s despite experiencing natural decrease over the entire study period. These counties are newly experiencing natural increase, which has been accompanied by low poverty. Each of these Ds is more strongly linked to variation in SVI than to county poverty rates, either in 1990 or 2019. The SVI in 2020 is highest in counties that have grown rapidly (more than 5 percent over the past decade), that have recently experienced natural decrease, and that have experienced White population decline (along with substantial increases in diversity). The implication is that high rates of population growth of minorities, coupled with White decline and natural decrease, is linked to increasing social and economic vulnerability in nonmetro counties.
DISCUSSION AND CONCLUSIONS
Our fundamental goal has been to provide an up-to-date demographic benchmark of rural America over the recent period of rapid social, economic, and political change (Mettler and Brown 2022; Ulrich-Schad and Duncan 2018). Achieving this goal is now possible with the release of the 2020 Census, along with earlier censuses and other federal demographic data. These data provide spatially fine-grained information on depopulation, deaths, diversity, and deprivation—the 4Ds. Rural America is at a demographic inflection point, one marked by the continuing transformation from a rural to urban society. This is indicated by persistent metro-nonmetro gaps in social and economic well-being, but also by growing disparities within nonmetro America. As in the past, rural people and places today are divided along divergent trajectories. One connotes growing prosperity and spatial inclusion into mainstream (urban) society, the other highlights a rural America left behind, excluded from urban America’s economic largess (Cramer 2016; Wuthnow 2018).
Indeed, we describe one rural America as experiencing population growth, and the other as facing chronic depopulation and decline over the recent past, much like the nation’s inner cities in the 1950s and 1960s (Wilson 2011). One avenue to success in rural America is revealed by population increase, urbanization, and ultimately reclassification to metropolitan status. Other rural areas continued to gain population because their natural and built amenities enabled them to attract amenity and retirement, or as economic and service centers for proximate rural areas. However, we also document the lack of demographic resilience or sustainability—incipient low fertility and high mortality—across large geographical swaths of rural America. Natural decrease—the growing excess of deaths over births—has supplanted natural increase, which historically has been a demographic counterweight to chronic rural out-migration. In addition, our analyses highlight the unprecedented uptick in racial and ethnic diversity in many parts of rural America. Yet the lack of diversity in other rural counties means that they are diverging racially and culturally from the rest of the country. Whether rural diversity is an economic panacea or an indicator of rural decline is much less clear. Finally, we place America’s nonmetropolitan counties along different economic trajectories, with opposing ideal-types as endpoints (for example, rural slums at one end and rural gentrification at the other). It is unclear, of course, whether the usual cultural narrative of left-behind rural Americans needs some revision, especially if many thinly settled rural counties have become prosperous new destinations for in-migration from urban areas (Sherman and Schafft 2022).
If nothing else, our framing and empirical approach suggest that rural development strategies and policy interventions must address a moving target, one made difficult by unusually rapid changes in rural depopulation, deaths, diversity, and deprivation. Place-based interventions have targeted rural America with new funding for local economic development and infrastructure, such as fiber optics, public transportation, and rural schools (Brown and Shucksmith 2017; Partridge and Rickman 2008; Pipa and Geismar 2022). Competing scholarly claims concerning equity and efficiency of place-based policies are increasingly commonplace and difficult to adjudicate. On the one hand, place-based investments directed at “dying” small towns may be justified from an equity standpoint, but are often discounted if efficiency matters more to policymakers. Whether depopulating rural counties can be revived is unclear, especially if they lack basic ingredients necessary for sustainability and long-term economic success, such as access to health care, infrastructure, good schools, and civic governance. On the other hand, public investments may be better targeted at persons rather than places, even if they incentivize individual choices that occur at the expense of communities, that is, out-migration of rural youth (for a discussion, see Parker, Tach, and Robertson 2022). Others have argued for greater investments in rural communities, but only if there is some likelihood of success. Prospects for success depend on local endowments, a skilled or educated population, adequate physical infrastructure, attractive natural resources or amenities, and a political and civic culture that ensures viability over the long-term. Still others suggest that regional development should subsume community development. The putative goal is to better link small or remote rural communities to thriving urban or metro regional employment centers (Brown and Shucksmith 2017; Tsvetkova, Partridge, and Betz 2017).
Our focus on the 4Ds is hardly exhaustive of the many demographic challenges facing rural America, especially as communities confront an increasingly urban-dominated national and global economy. For example, rural America faces housing challenges that often exacerbate problems of labor mobility (such as being anchored to housing that cannot be easily sold and therefore abandoned at a loss) and population aging (trapped in older housing ill-adapted to persons with problems of mobility and self-care). For rural people, moving to opportunity or, alternatively commuting to opportunity, can deplete the size and economic viability of local communities and erode resilience and long-term sustainability. The economic incentives of people and places are often working at cross-purposes (Carr and Kefalas 2009). Our focus on the 4Ds does not obviate the need for a much broader research and policy agenda devoted to rural housing, education and schools, public transportation, social service delivery systems, and health care. Our analyses underscore growing complexity, as well as demographic and economic fragmentation in rural America and the need to appreciate this in policymaking.
As we have illustrated, the U.S. decennial census is a national resource for better understanding and responding to rural growth and decline, in general, and to specific at-risk rural places in particular. The U.S. Census was first conducted in 1790 and provides longitudinal demographic data spanning more than two centuries. Census data help policymakers, businesses, and researchers better understand and respond to the unmet needs of America, including rural people and places. The census provides finely grained spatial-racial data for rural governments and administrative units (such as boards of county commissioners). Yet the current census is limited to five demographic complete-count questions: sex, birthdate, Hispanic origin, race, and relationship to the householder (the first person listed on the questionnaire) and place of residence. Unfortunately, the nation’s statistical system has not adapted sufficiently to rural America’s increasing economic, political, and racial heterogeneity. Nor has it been immune to political influences that undermine complete-count data, especially data pertaining to America’s most vulnerable people and smallest places.
To be sure, the annual American Community Survey has been a boon to the study of spatially delimited political or administrative units, including rural communities and small towns. For smaller mostly rural places, however, estimates of population, economic and social parameters are often imprecise, fluctuating markedly from year to year due to small sample sizes. Recently implemented data privacy algorithms add another element of imprecision to the data from all the major Census Bureau data products, especially for smaller places, including much of rural America. The availability of high-quality, spatially explicit data is crucial, especially during a period of rapid economic change and growing demographic heterogeneity. Few national panel studies are currently of sufficient sample size to confidently address critical policy questions (such as childcare, reproductive health and childbearing, and mental health) concerning rural people and places, either in the aggregate, or when disaggregated at the regional, state, or local levels. This will require oversampling rural areas or providing detailed comparative studies of specific rural communities, much like the Three Cities Study or Los Angeles Family and Neighborhood Survey. Rural and small-town America is in transition. Now, perhaps more than ever, it is imperative that we have the high-quality data needed to take demographic stock of the state of rural America and to build a spatially inclusive society and statistical gathering system.
Appendices

Nonmetropolitan Population, Floating and Fixed Definition
Source: Authors’ calculations based on U.S. Census Bureau 2024a.

Population Patterns in Nonmetropolitan Counties
Source: Authors’ calculations based on U.S. Census Bureau 2024b.

Nonmetropolitan Population by Race and Hispanic Origin
Source: Authors’ calculations based on U.S. Census Bureau 2024a.


FOOTNOTES
↵1. The current state of rural America also is revealed in upward mortality trends and declining life expectancy, which have diverged significantly with metropolitan areas (Brooks, Mueller, and Thiede 2020; Probst et al. 2020). This is due to limited access to health care—insurance and primary medical care—but also to unhealthy behaviors, often the result of low education and lack of knowledge (that is, related to diet, obesity, smoking, substance abuse, and occupation-linked deaths).
↵2. We calculated a diversity index (DI), which measures the racial and ethnic diversity of the population (Meyer and McIntosh 1992). It is calculated as follows: DI = 1 – (H2 + W2 + B2 + A2 + N2 + M2 ), where H is the proportion Hispanic, W is the proportion non-Hispanic white, B is the proportion non-Hispanic black, A is the proportion non-Hispanic Asian, N is the proportion non-Hispanic Native American, and M is the proportion non-Hispanic multiracial (that is, those with two or more races (in 1990 there was no multiracial category, so M included those of Other races)). The values of DI range from 0, which would indicate that a county is made up entirely of one race-ethnicity, to a maximum value of 0.83, which would be attained if each race-ethnicity constitutes exactly one-sixth of the population.
↵3. See online appendix at https://www.rsfjournal.org/content/11/2/88/tab-supplemental.
↵4. Just after the end of our study period, nonmetropolitan counties experienced a modest population gain since the 2020 Census because net migration gains to nonmetro counties exceeded the substantial natural decrease from the COVID-19 pandemic. The factors occasioning the migration gains are not yet fully understood but include both selective in-migration gains from metro areas and reduced out-migration from nonmetro areas (Johnson 2023; Peterson, Winkler, and Mockrin 2024).
↵5. Using the 1993 definition of nonmetro counties, the nonmetro population would have increased by 1 percent rather than declined by 0.6 percent between 2010 and 2020.
↵6. The incidence of natural decrease has without question risen significantly in nonmetro counties in the last decade, even using the 1993 metro definition, 47 percent of the counties classified as nonmetro saw a natural decrease between 2010 and 2020. Additionally, with the onset of the pandemic, natural decrease will continue to rise in nonmetro America (Johnson 2023).
↵7. Reclassification also contributed to the growing diversity of nonmetro areas. In previous research, we found that Whites represented a disproportionate share of the population in counties that were reclassified from nonmetro to metro. The combination of White loss, in part through reclassification, and nonmetro minority gain accelerated nonmetro diversity (Lichter and Johnson 2023).
↵8. We also estimated the mean diversity score for counties, which gives each county, regardless of racial composition, equal weight (rather than weighting by nonmetro population size). For each decade, the mean diversity scores were slightly higher, which reflects the outsized impact of highly diverse outlier counties. The nonmetro county diversity mean was roughly 31 in 2020. This compares with a metro mean diversity score of 42 in 2020.
↵9. In previous research on the impact of nonmetro to metro reclassification, we found that nonmetro areas that have transitioned to metro status included higher percentages of college-educated people, higher per capita incomes, lower poverty rates, and a smaller proportion of their population over sixty-five. Such reclassification exacerbates the deficit of human capital in nonmetro areas and increases the gap between metro and nonmetro areas (Johnson and Lichter 2020).
- © 2025 Russell Sage Foundation. Lichter, Daniel T., and Kenneth M. Johnson 2025. “Depopulation, Deaths, Diversity, and Deprivation: The 4Ds of Rural Population Change.” RSF: The Russell Sage Foundation Journal of the Social Sciences 11(2): 88–114. https://doi.org/10.7758/RSF.2025.11.2.05. Direct correspondence to: Daniel T. Lichter, at dtl28{at}cornell.edu, Cornell Brooks School of Public Policy, 3226 Martha Van Rensselaer Hall, Cornell University, Ithaca, NY 14853, United States.
Open Access Policy: RSF: The Russell Sage Foundation Journal of the Social Sciences is an open access journal. This article is published under a Creative Commons Attribution-NonCommercial-NoDerivs 3.0 Unported License.
REFERENCES
In this issue


Jump to section
Related Articles
Cited By...
- No citing articles found.