
Abstract
We examine the contribution of the U.S. tax and social safety net to ameliorating racial and geographic household income gaps using nearly five decades of data from the Current Population Survey Annual Social and Economic Supplement. Our results paint a mixed portrait of economic progress of Black and rural households relative to their White and urban counterparts over the last fifty years. The tax and transfer systems in any given year provide substantial redistribution to low-income Black and rural households, which has resulted in a narrowing of level gaps. However, those gaps have been exacerbated in the upper tail of the distribution, suggesting that the tax code does not undo the underlying economic forces pulling White and urban incomes apart from Black and rural households in the top half of the distribution. This is borne out in the stagnation of rank positional gaps across race and geography.
The U.S. tax and transfer systems have changed fundamentally over the past five decades, resulting in lower effective tax rates at both the top and bottom of the income distributions as well as huge new outlays on social insurance and safety net programs (Auerbach and Slemrod 1997; Grogger and Karoly 2005; Piketty and Saez 2007; Moffitt and Ziliak 2019). Whether and to what extent these reforms have attenuated long-standing group differences in disposable incomes across race and geography is not well understood. Although generally examined in isolation, Black and rural households share many impediments to upward economic mobility relative to their White and urban counterparts, including lower school quality and educational attainment, reduced access to high-paying jobs and entrepreneurial capital, community disinvestment, among others (Wilson 1987; Lichter and Ziliak 2017; Gooden and Myers 2018; Chetty et al. 2020). Many aspects of the reforms have been targeted toward households with lower pretax incomes, which tend to be overrepresented among Black and rural households. As a result, it is possible that these redistributive features of the tax system and social safety net have helped improve the distribution of after-tax and transfer income among Black and rural households relative to White and urban households, respectively.
Drawing on nearly five decades of data from the 1976–2021 Current Population Survey Annual Social and Economic Supplement (CPS ASEC), we estimate a series of level and rank inequality measures, exploring disposable income gaps across race and geography. Although the economic status of Blacks relative to Whites, and rural relative to urban residents, has been of long-standing interest to both research and policy, much of the extant literature has focused on average group differences in employment, marriage, and earnings, or specific points in the income distribution such as poverty rates (for early treatment of the economic plight of the Black family, see Myrdal 1944; Moynihan 1965; for early treatment of the rural family, see Breathitt 1967; for recent volumes on Black versus White households, see Gooden and Myers 2018; on rural versus urban households, see Lichter and Ziliak 2017; Clark, Harper, and Weber 2022). Patrick Bayer and Kerwin Charles (2018) recently extended the study of Black-White earnings gaps from the well-known level gap approach, for example, comparing the 25th percentile of Black earnings with the 25th percentile of White earnings, to rank earnings gaps that yield insights into where in the White earnings distribution the earnings of a Black worker would place. The rank gap approach speaks to the relative economic mobility of groups. We expand on their work in this article by focusing on definitions of income that incorporate taxes—inclusive of redistributive tax expenditure programs such as the Earned Income Tax Credit (EITC) and the Child Tax Credit (CTC)—as well as cash welfare and food assistance programs such as the Supplemental Nutrition Assistance Program (SNAP), and by examining gaps not only between Black versus White households, but also between rural versus urban households (for evidence that these policy changes differentially improved rural relative to urban poverty rates, see Nolan, Waldfogel, and Wimer 2017; for evidence that expansions of the Earned Income Tax Credit in the mid-1990s reduced Black-White after-tax income inequality, see Hardy, Hokayem, and Ziliak 2022).1
Our results paint a mixed portrait of economic progress of Black and rural households relative to their White and urban counterparts over the last fifty years. The tax and transfer systems in any given year provide substantial redistribution to low-income Black and rural households, which has resulted in a narrowing of level gaps over time. However, those same gaps have been exacerbated in the upper tail of the distribution, suggesting that the tax code does not undo the underlying economic forces pulling White and urban incomes apart from Black and rural households in the top half of the distribution. The divergence tends to be more extreme when comparing rural with urban than Black with White households, resulting in overall converged disposable income level gaps between Black and White households, and a divergence in level gaps between rural and urban households. By contrast, changes in positional disposable income inequality for both groups have been much more muted since the 1970s, with little upward mobility of Black households in the White distribution, with the possible exception of the median, but more progress of low-income rural households in the urban distribution, though no change at the top.
POLICY LANDSCAPE
By the mid-1970s, the nation was roughly ten years into an expanded set of social, political, and economic rights for Black Americans. The Civil Rights Act of 1964 prohibited racial discrimination and racial segregation across education, the workforce, and public spaces (Hardy, Logan, and Parman 2018). The Voting Rights Act of 1965 and the Fair Housing Act of 1968 extended to Black Americans the promise of long-awaited political influence and improved access to housing, though arguably unfulfilled (Rothstein 2017). Additionally, although the mid-1970s mark the end of a roughly three-decade period of Black-White male labor-market convergence (Smith and Welch 1989; Heckman and Donohue 1991), social welfare programs were greatly expanded to be more inclusive of Black households. The antipoverty transfer programs of the Great Society placed an emphasis on direct assistance to families by way of cash welfare for families below poverty, called Aid to Families with Dependent Children (AFDC), which operated as an entitlement and matching grant to states with relatively weak employment requirements and high benefit reduction ratios. In-kind food assistance was provided by the Food Stamp Program, which was operational nationwide by 1975 and codified in its modern form with the Food Stamp Act of 1977 (Currie 2003; Hoynes and Schanzenbach 2016).
With the election of President Ronald Reagan in 1980, the discourse on the provision of direct cash assistance shifted and, for many, a perception emerged that the costs of redistribution through welfare programs outweighed the benefits, due in part to concerns of moral hazard and higher nonparticipation in the labor force among Black families (Loury 1986; Murray 1984). AFDC’s limited provisions requiring employment risked disincentivizing work. Yet empirical evidence (Darity and Myers 1983, 1984) demonstrates that welfare generosity was not a clear causal factor in determining rates of labor-market nonparticipation among Black families.
As these arguments were taking shape, the Tax Reform Act of 1986 (TRA86) led to a large increase in the EITC, with noticeable impacts on poverty and labor supply among unmarried women with dependent children (Eissa and Liebman 1996; Eissa and Hoynes 2004). Enacted in 1975 to initially offset payroll tax liability among workers with low earnings, the EITC grew from a modest tax credit into an economically meaningful wage subsidy operating through the tax system (Hotz and Scholz 2003; Nichols and Rothstein 2016). TRA86 also continued a trend begun with the 1963 Kennedy Tax Act of slashing top marginal tax rates from more than 90 percent to 70 percent, to 50 percent with the tax reform of 1981, to 28 percent by 1986. Moreover, not only were rates cut, but the number of marginal tax brackets also shrank from sixteen in 1980 to four in 1986. Each bracket was much wider than in the 1970s, meaning those with substantially different taxable incomes faced similar marginal tax rates. Some have argued this heralded an unleashing of inequality at the top (Alvaredo et al. 2013).
Over the next two decades, tax policy developments would mark additional changes to top marginal tax rates (higher in 1993 and 2009, and lower in 2001, 2003, and 2017), enhancements to the size and reach of the EITC, and the introduction of the partially refundable Child Tax Credit, a tax benefit to working families that at once excludes very low-income working families and reaches much higher in the income distribution. The CTC was greatly expanded in generosity, delivery, and reach as part of the 2021 American Rescue Plan, providing benefits monthly to working and nonworking families alike. However, this program lasted only six months, and by 2022 the CTC returned to the same structure of 2017 that restricted the credit to working families only and at reduced generosity.
Significantly, the 1996 welfare reform eliminated the entitlement feature of cash welfare, instead allocating block grants to states that could be used in a broad range of ways to ostensibly reduce poverty and promote marriage; the reform led to a dramatic reduction in direct cash assistance provided to families with low incomes (Blank 2002; Moffitt 2003; Grogger and Karoly 2005). However, several studies exploring racial disparity in the delivery of social services identified disproportionately harsh sanctions among Black families on the welfare caseload (Bonds 2006; Kalil, Seefeldt, and Wang 2002; Fording, Soss, and Schram 2007). Related work demonstrates that states with a higher proportion of Black families in the state or on the welfare caseload provide relatively fewer cash benefits (Hardy, Samudra, and Davis 2019; Parolin 2021). By the late 1990s, the EITC and food assistance from SNAP would overtake cash welfare as the dominant form of economic assistance for families facing exposure to low income (Hardy, Smeeding, and Ziliak 2018).
Around the same time as the Civil Rights Act of 1964 and Great Society package of antipoverty programs and expansions, policymakers recognized that rural places—and the people residing in them—were in dire need of additional investment (Caudill 1963; Breathitt 1967; Duncan 1999; Eller 2008). The passage of the 1965 Appalachian Regional Development Act created the Appalachian Regional Commission (ARC) and signaled a new acknowledgment of needed attention and resources to parts of rural America that had largely been ignored since the Tennessee Valley Authority three decades earlier (Bradshaw 1992; Ziliak 2012; Kline and Moretti 2014).
Rural economic conditions have historically been depressed relative to those of urban areas and yield similar gaps to those observed across race—including in education, earnings, poverty, and health outcomes (Islam, Minier, and Ziliak 2015; see also Lichter and Ziliak 2017; Tickamyer, Sherman, and Warlick 2017; Clark, Harper, and Weber 2022). Several studies have documented widening disparities in economic outcomes between coastal U.S. cities and their rural counterparts (Black and Sanders 2012; Austin, Glaeser, and Summers 2018; Ziliak 2019). Across rural America more generally, out-migration into larger cities has resulted in large shifts in local-area economic well-being, as well as altered access to social and health services, and educational opportunities (Bollinger, Ziliak, and Troske 2011; Lichter and Graefe 2011; Snyder and McLaughlin 2004). Social scientists have documented uneven impacts from globalization and trade that have disrupted the economic and social stability of many rural communities, leading to higher exposure to and persistent challenges with job loss, poverty, lowered life expectancies, and opioid abuse (Autor, Dorn, and Hanson 2021; Case and Deaton 2015; Monnat 2019). Additionally, although much of the rural-urban divide is couched in terms of challenges facing a White working class, rural America grapples with relatively underdiscussed racial and ethnic gaps in poverty—poverty rates among rural racial minorities are roughly two to three times higher relative to rural Whites (Harvey and Harris 2017; Slack, Thiede, and Jensen 2020). In short, the social, economic, political, and geographic boundaries separating rural from urban America have given rise to stark, measurable inequities across the rural-urban divide (Lichter and Brown 2011).
We aim to understand how these changes to the tax and welfare systems over the past five decades have potentially reshaped or otherwise reordered economic inequality between races and regions. Most income transfers and refundable tax credits are targeted to lower-income households, and even though the 1996 welfare reform led to a retrenchment in cash assistance, other changes such as the expansions of SNAP, EITC, CTC, and disability may have differentially improved the outcomes of Black and rural households relative to their White and urban counterparts given the lower pretax and transfer incomes of Black and rural families. On the other hand, the various tax reforms affecting middle- and upper-income households may, if anything, have favored White and urban households given tax rate cuts and base broadening. Our analysis focuses on the entire distribution, permitting us to identify where and how in the distribution the combined forces of tax and transfer reforms affected relative incomes across race and geography.
DATA
The data come from the Current Population Survey Annual Social and Economic Supplement (CPS ASEC) for survey years 1976–2021 (calendar years 1975–2020). The CPS is a stratified random sample of roughly sixty thousand households from the noninstitutionalized population in the United States conducted monthly by the U.S. Census Bureau on behalf of the Bureau of Labor Statistics. The ASEC is a supplement to the monthly survey collected in March of each year that includes an additional thirty thousand households (as of 2001) over the normal monthly sample. The supplement contains detailed information on annual earnings and incomes from the prior calendar year, employment, hours worked, and family structure. Information is collected at the person, family, and household level, with weights provided by census to make the sample representative at the corresponding level.
Our sample consists of individuals between the ages of twenty-five and sixty (inclusive), which captures the time after formal schooling is completed for most individuals and prior to retirement. For our baseline sample, we follow Bayer and Charles (2018) and classify individuals into one of three racial-ethnic groups—non-Hispanic White, non-Hispanic Black, or other—where the other group consists of Hispanic individuals of any race, as well as those non-Hispanics who self-identify as Asian, Native American, Pacific Islander, or other group. Prior to the 2003 survey, individuals could only choose one racial category, but in every year thereafter respondents had the option to select multiple race categories. Consequently, after 2002 we classify individuals as Black if they select Black alone, as White if they select White alone, and the remaining individuals as other race. A common alternative is to not separate race from ethnicity, and given the growth of the Hispanic population over the sample period, in a robustness section we also provide estimates of Black-White race gaps inclusive of those with Hispanic ethnicity.
In addition to comparisons between race and ethnicity, our study aims to understand changes in the distribution of income in rural households relative to urban households. A preferred approach would be to classify rurality based on the USDA’s rural-urban continuum codes that are assigned to each county in the nation (for the codes, see Economic Research Service 2024). However, county identifiers are suppressed in public release versions of the ASEC for the majority of counties, and thus, as is standard, we proxy the measurement of rural and urban using the census designation of residing in a metropolitan or nonmetropolitan area. As Kenneth Johnson and Daniel Lichter (2020) note, much of the metropolitan population growth in recent decades has occurred because of Census Bureau reclassification of nonmetro areas, and thus some of the changes we identify will reflect this reclassification. Metro status is missing for roughly 10 percent of the sample before 1985 and then less than 1 percent per year thereafter. The higher rates stemmed from the fact that fewer geographic areas were sampled and for confidentiality reasons had to be suppressed from public release. Because it reflects survey design, we assume it is missing completely at random and unrelated to the outcomes of interest, and thus we drop those individuals with missing metro status. To further understand the Black-White and rural-urban divides, we evaluate inequities by the intersection of race and geography and compare Black rural households with White rural households and Black urban households with White urban households where race and geography are defined as described (Slack, Thiede, and Jensen 2020).
The focal outcome variable in our analysis is equivalized disposable (after-tax and transfer) household income. We define disposable income as the sum of earnings; nonlabor nontransfer income such as rent, interest, and dividend income; cash welfare transfers such as from AFDC and its replacement Temporary Assistance for Needy Families (TANF); social insurance inclusive of unemployment, disability, workers compensation, and retirement or survivors benefits; and in-kind transfers such as SNAP. From gross income, we subtract tax payments for payroll (Social Security and Medicare), federal, and state taxes. The federal and state taxes include refundable EITC and CTC credits, as well as stimulus payments that were distributed during the COVID-19 pandemic.
Because the CPS ASEC does not collect tax information, we use NBER’s TAXSIM program to estimate tax payments and credits. We first use a series of household relationship pointers to identify tax filing units in the household, and then for each tax unit in the household we simulate tax payments and credits (NBER 2024). Most households consist of a single tax unit, but some have multiple filers; in those cases we aggregate tax payments up to the household level. Focusing on the household rather than the tax unit is justified under the assumption that members of the same household share resources. However, households with two or more adults have higher potential earning power than those with one adult, and those with young children face constraints on labor-market time owing to childcare responsibilities. Thus, to account for household size and composition, we equivalize household disposable incomes using a modified OECD scale.2
Earnings make up about 80 percent of total income and includes all jobs, whether in paid employment or self-employment, including farm income and with self-employment losses allowed. For confidentiality purposes, earnings in the public release file are top coded, and the method of top coding changed over time. Starting in 2011, the Census Bureau implemented a process known as rank-proximity swapping whereby individuals with earnings above the top code are ordered from lowest to highest and randomly assigned earnings of the individual within a small neighborhood of the person’s earnings. This approach has the advantage of preserving the rank order of the distribution above the top code. The Census Bureau released rank-proximity values for all individuals above the top code back to 1975, and thus we use these consistent top code values for our analysis (for a description of rank-proximity swapping, see Moore 1996). We make this substitution prior to constructing tax liabilities in TAXSIM.
An additional complicating factor in the analysis of earnings is the substantial increase in earnings nonresponse in the CPS (Bollinger et al. 2019). Today more than 40 percent of earnings values in the ASEC are missing due to nonresponse, whether from failure to respond to the earnings question (item nonresponse) or failure to respond to any part of the ASEC (supplement nonresponse). For those individuals with missing earnings or the whole supplement, the Census Bureau imputes values by using information from other respondents. Christopher Bollinger and his colleagues (2019) show that this imputation imparts bias into inequality estimates, and thus for our analysis we drop those households where any individual has imputed earnings (or hours worked), as well as those with an imputed ASEC supplement. We then reweight the sample by using an inverse probability weight. Specifically, for each year and gender we estimate a probit model of the probability of not being imputed as a flexible function of age, education attainment, race, ethnicity, marital status, metro status, interactions of many of these variables, along with state fixed effects. The ASEC person weight is then divided by the fitted probability of nonimputation from the probit model.3 Creating new weights for each year allows us to maintain a nationally representative sample in the face of changing nonresponse over time. This minimizes measurement error, due to nonresponse, from confounding our estimates of earnings and income inequality over time. All income data are inflation adjusted using the personal consumption expenditure deflator with 2021 base year.
Table A.1 presents weighted summary statistics of selected socioeconomic characteristics of sample individuals, both overall and by race and rural status.4 The table reveals common themes in comparing Black with White individuals and rural with urban residents. Specifically, relative to Whites, Blacks have lower education attainment; lower rates of marriage and higher rates of never married; and substantially lower equivalized household earnings, nonlabor income, and disposable income. A similar pattern obtains in comparing rural with urban residents. The notable exception is that rates of marriage are higher in rural areas, and rates of never married are lower.
METHODS
We are interested in understanding the evolution of Black-White and rural-urban gaps in disposable incomes across the distribution. These gaps can occur both in terms of income levels (level gap), as well as position in the comparison group income distribution (rank gap). Following Bayer and Charles (2018), we estimate a series of weighted quantile regressions at various quantiles (q) of equivalized disposable income for each year of the sample.
Specifically, let (yit) be the natural log of equivalized disposable income for individual i in year t, then the Black-White level gap is estimated as
where B is an indicator variable if the individual is Black, O is an indicator variable if the individual is Hispanic or a race other than Black or White, A is a vector of indicator variables capturing five-year age ranges from age twenty-five to sixty, and υ is a random error term. The omitted group is White individuals, and thus under the null hypothesis that Black incomes lie below White incomes, the coefficient γt(q) < 0 represents the log point difference in Black and White incomes at quantile q in year t. When the estimated  is small the coefficient is approximately a percent gap, but this does not hold when the coefficient is large. Thus, for ease of interpretation, we convert the coefficient to a percent gap as 100 *
  .
.
To estimate the Black-White rank gap, we first construct the rank order of the White income distribution from the 1st to 99th percentile and then assign where in the White distribution each Black and other race individual’s income would place, denoted as R(yit). The corresponding weighted quantile rank gap regression is
where  indicates how many percentile points lower a Black person’s disposable income is in the White disposable income distribution at quantile q. Rather than present the coefficient directly as a percentile point deficit, we instead transform it as
  . For example, if at the 25th percentile we estimate a 10 percentile point deficit for Blacks then this implies that at the 25th percentile the average Black household income would fall in the 15th percentile of the White income distribution.
The analysis of rural-urban level and rank gaps follows the exact same approach as in equations (1) and (2), but rather than controlling for race and ethnicity (Bit, Oit) in the regression we include an indicator variable that takes a value of 1 if the individual resides in a rural area. The level gap regression then provides estimates of the percentage gap in rural disposable incomes relative to urban incomes, and the rank gap provides estimates of where a rural household would place in the urban household disposable income distribution.
To evaluate Black-White and urban-rural interactions, we augment equations (1) and (2) to include race, ethnicity, and geographic indicators as well as an interaction between the indicator for Black race and the indicator for residing in a rural area. The level gap regression coefficient on Black race now gives the percentage gap in Black urban disposable incomes relative to White urban disposable incomes, and we sum the coefficients on Black and the Black-rural interaction term to produce the estimates of the percent gap in Black rural disposable incomes relative to White rural incomes. To estimate rank gaps, we first assign each rural household a place in the urban distribution, and then implement the fully interacted model and select the coefficients as in the level gap analysis to create estimates of where a Black rural (urban) household would place in the White rural (urban) disposable income distribution.
For each model, we estimate disposable income gaps at the 10th, 25th, 50th, 75th, 90th, and 95th percentiles. However, as noted, withdrawal from the labor force among Black workers in recent decades has been substantial, in part from mass incarceration and declining opportunities in low-wage labor markets from trade and automation (Abraham and Kearney 2020; see also Chandra 2000; Western and Pettit 2005; Neal and Rick 2014; Bayer and Charles 2018; Blundell et al. 2018). James Ziliak (2019) documents a similar pattern among rural workers relative to urban workers. If withdrawal from the labor force is selective by race or rurality, then estimates of level and rank gaps could be biased. A common approach in the literature to deal with nonrandom labor-force participation is to assign a median selection rule for nonworkers (Neal and Johnson 1996; Chandra 2000; Bayer and Charles 2018). Specifically, under a median selection rule if a nonworker were to work, it is assumed that they would earn a wage in the bottom half of the distribution; in other words, nonwork is assumed to be concentrated among those workers with fewer formal credentials, lower skills, and thus lower wages.5 To implement this in a log earnings regression, nonworkers are added back to the sample with log earnings set to 0, and then estimation focuses on the upper-half of the earnings distribution. The cost of the median selection assumption is that comparisons in the bottom half of the distribution are not identified.
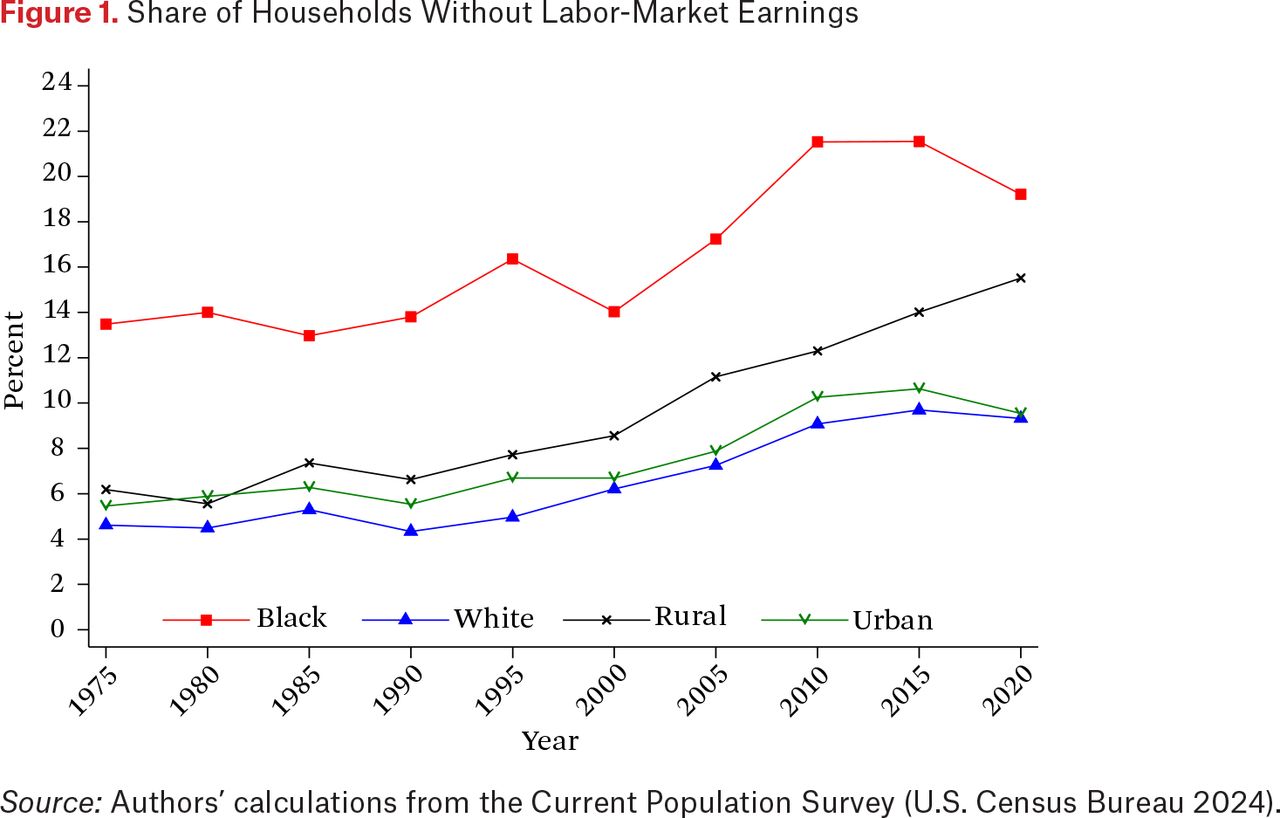
These analyses are all at the individual level, and it is possible that labor-force withdrawal among some members of a household could be offset by continued (or new) employment among other workers, that is, the so-called added worker effect (Lundberg 1985; Cullen and Gruber 2000; Stephens 2002). To examine this possibility, in figure 1 we present the share of Black and White and rural and urban households reporting no earnings in the year.6 The figure makes clear that for all groups there has been a secular rise in households with no earnings, especially after 2000. Among Black households, the share with no earnings increased two-thirds from 12 percent in 2000 to 20 percent in 2020; for White households, it increased by the same percentage, from roughly 6 percent to 10 percent. During that period, rates of nonwork among rural households doubled, from 8 to 16 percent, and among urban households it increased by two-thirds. Despite substantive level gaps across groups in the share without earnings, the rate of change, at least over the past two decades, is not too different, which weighs against potential selective labor-force withdrawal biasing our estimates. Moreover, our primary outcome is disposable income, not earnings, and the share of households reporting no or negative disposable income is trivial, averaging about 1 percent per year. However, as part of a robustness section we re-estimate the models under the median selection rule.

Share of Households Without Labor-Market Earnings
Source: Authors’ calculations from the Current Population Survey (U.S. Census Bureau 2024).
RESULTS
We begin our results by presenting the Black-White level and rank gaps, followed by the corresponding estimates for rural and urban residents. This is followed by a robustness section examining level and rank gaps at the intersections of race and geography, the influence of selective labor force withdrawal on the estimated gaps, and the sensitivity of the Black-White gaps to combining race and Hispanic ethnicity. All estimates are weighted using the person-level inverse probability weight that adjusts for imputed household-level earnings and ASEC supplement. For ease of presentation, we only show results in five-year increments from calendar years 1975 to 2020. Annual estimates are available on request.
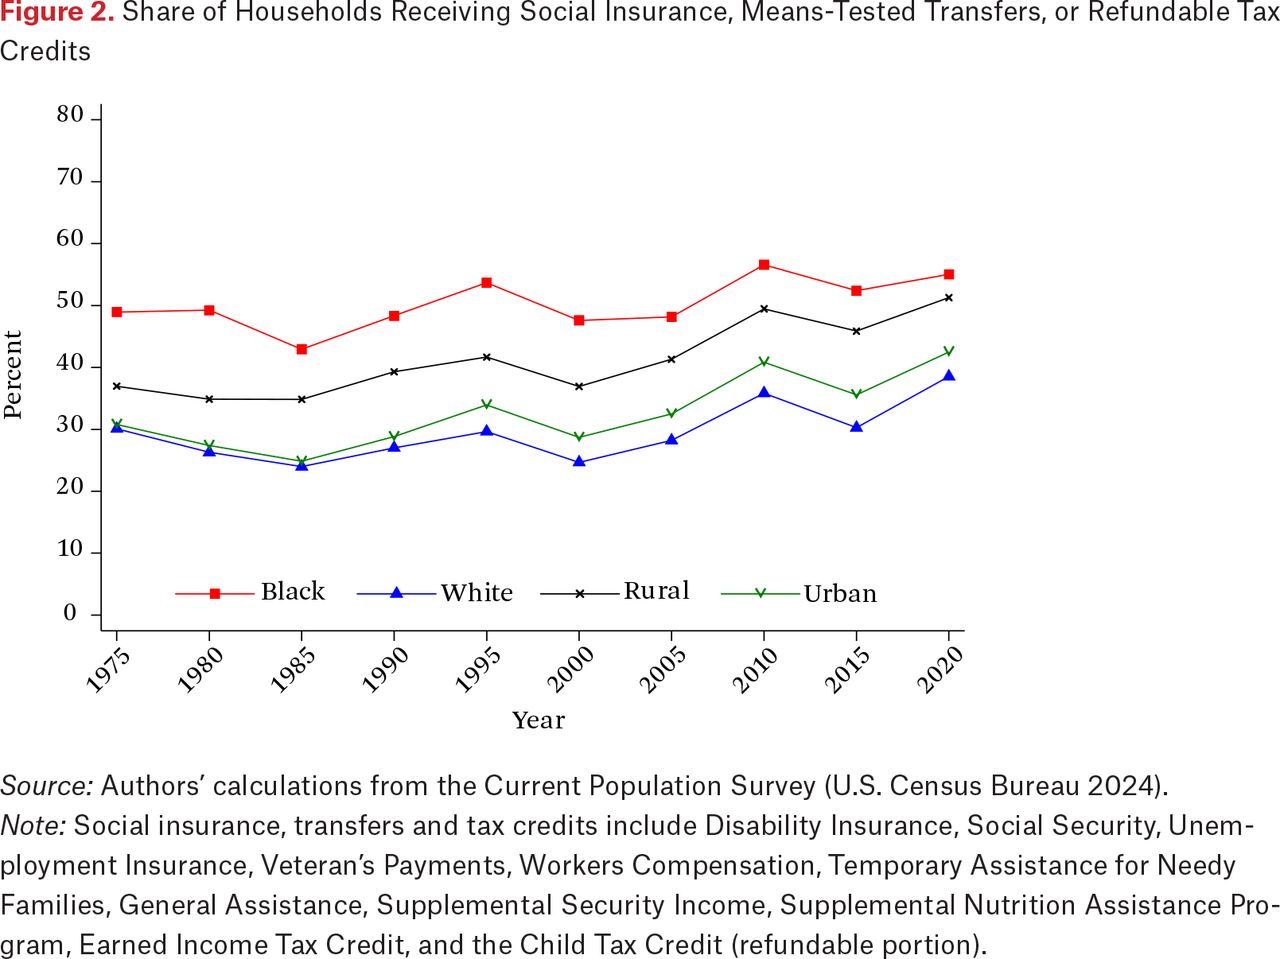
To fix ideas on the potential redistributional reach of the social safety net across race and geography, in figure 2 we present trends in the share of households receiving assistance from social insurance (Disability Insurance, Social Security, Unemployment Insurance [UI], Workers Compensation, Veteran’s Payments), means-tested transfers (AFDC/TANF, SSI, SNAP), or refundable tax credits (EITC, CTC).7 The figure reveals that in a typical year before the COVID-19 pandemic about one in two Black households received assistance from the safety net, which is on average about 20 percentage points higher than White households. The corresponding rural-urban gap is about 10 percentage points higher among rural households. A distinct cyclical component to receipt is evident, driven especially by the rise and fall of UI and SNAP payments surrounding major economic recessions. The upward trend in participation is most prominent among White and rural households.8 Whether and to what extent these patterns of average receipt affect level and rank gaps depends on where in the respective distributions the benefits are flowing, which we turn to next.

Share of Households Receiving Social Insurance, Means-Tested Transfers, or Refundable Tax Credits
Source: Authors’ calculations from the Current Population Survey (U.S. Census Bureau 2024).
Note: Social insurance, transfers and tax credits include Disability Insurance, Social Security, Unemployment Insurance, Veteran’s Payments, Workers Compensation, Temporary Assistance for Needy Families, General Assistance, Supplemental Security Income, Supplemental Nutrition Assistance Program, Earned Income Tax Credit, and the Child Tax Credit (refundable portion).
Black-White Gaps
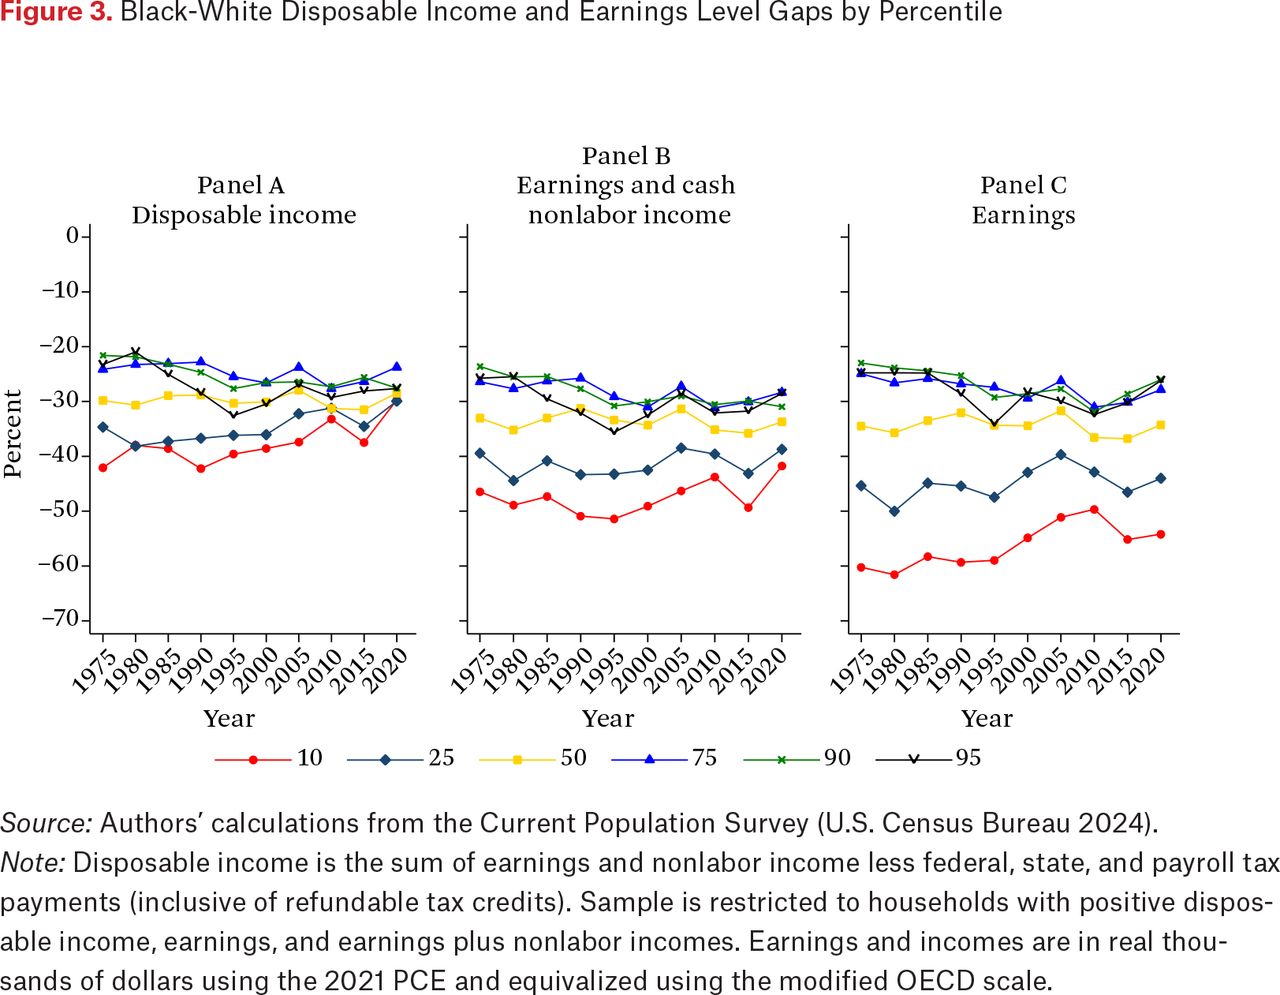
Panel A of figure 3 presents estimates of the Black-White level gap in equivalized disposable income. The panel suggests remarkable convergence across the distribution in Black-White disposable income level gaps—Blacks in the bottom half of the distribution gained relative to Whites—from a 40 (35) percent deficit in the mid-1970s at the 10th (25th) percentile to a 30 percent deficit by 2020—whereas Blacks at the top half of the distribution fell relative to Whites from roughly a 20 percent deficit to nearly 30 percent. Blacks in the middle of the distribution were unchanged over the entire period at a 30 percent level gap.

Black-White Disposable Income and Earnings Level Gaps by Percentile
Source: Authors’ calculations from the Current Population Survey (U.S. Census Bureau 2024).
Note: Disposable income is the sum of earnings and nonlabor income less federal, state, and payroll tax payments (inclusive of refundable tax credits). Sample is restricted to households with positive disposable income, earnings, and earnings plus nonlabor incomes. Earnings and incomes are in real thousands of dollars using the 2021 PCE and equivalized using the modified OECD scale.
These patterns in level gaps can emerge because the underlying income levels could be diverging, or they could be trending in the same direction (up or down) but at different growth rates. Figure A.3 presents trends in the log level of inflation-adjusted disposable incomes where it is apparent that incomes are rising for both Black and White households, but they are growing faster for Blacks than Whites in the left tail of the distribution, and slower in the right tail.
Panels B and C in figure 3 isolate components of disposable income, with earnings plus cash nonlabor income from both private sources such as rent, interest, and dividend income as well as cash transfers from social insurance and mean-tested transfers (but not in-kind programs like SNAP) in panel B, and earnings alone in panel C. Beginning with earnings in panel C, we see substantial reduction in earnings gaps at the 10th percentile starting in the mid-1990s, albeit from a very large 60 percent deficit and falling to just 50 percent. At the 25th percentile, the earnings level gap declines from 45 percent to 35 percent. This narrowing of the level gap at the 10th and 25th percentiles coincides with the expansion in the EITC; Bradley Hardy, Charles Hokayem, and James P. Ziliak (2022) show that Black workers responded more to the EITC expansion than White workers in the bottom half of the distribution. Adding cash nonlabor income to earnings in panel B has the effect of attenuating the level gap at the 10th and 25th percentiles by about 10 percentage points prior to 2000 and by about 5 points thereafter, but with little effect at the median and above. Taken as a whole, the tax and transfer systems jointly reduce Black-White level gaps in the bottom half of the distribution, but the tax code does more of that redistribution at the median. Remarkably, disposable income gaps in the top half of the distribution are nearly identical to the earnings and earnings plus cash nonlabor income gaps, indicating that redistribution in the tax code does little to mitigate Black-White level income differences in the top half of the distribution.
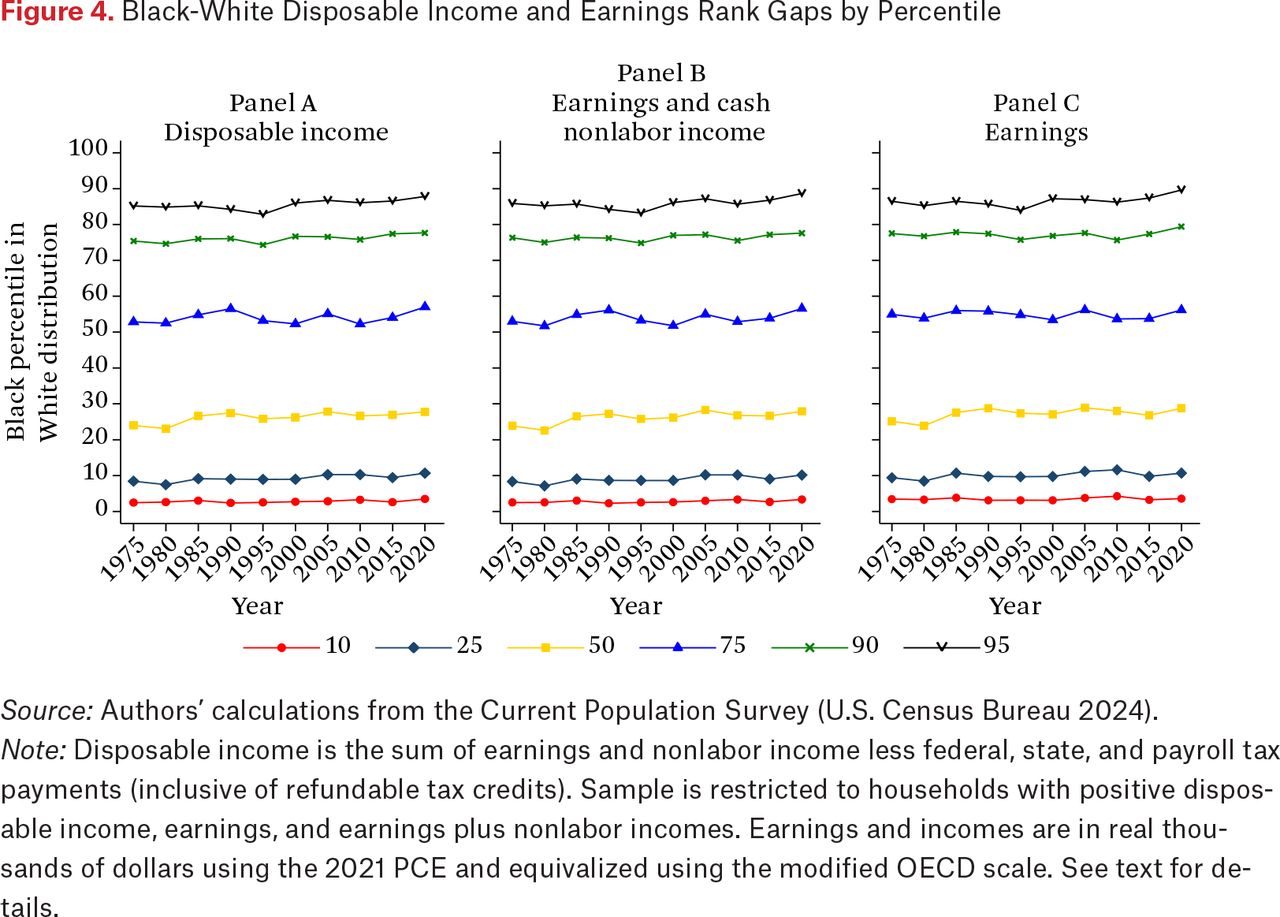
Even more stunning is the lack of Black progress in the White distribution, as depicted by the rank gaps in figure 4. The typical Black household at the 10th percentile of the disposable income distribution has income that would only place them at the 2nd percentile of the White distribution (panel A). This was true in 1975 and in 2020, with no change in the intervening years. At the 25th percentile, Blacks are placed at about the 10th percentile of the White distribution, showing a percentile point gain over the last forty-five years. The only positional gain is at the median, where Black progress improved by about 5 percentile points from the 25th percentile of the White distribution in 1975 to the 30th percentile in 2020. There have been no gains in the top half of the distribution, with the 75th percentile Black individual placing in the 55th percentile of the White distribution, and the corresponding ranks for the 90th and 95th percentiles being about the 75th and 85th percentiles of the White distribution, respectively. Panels B and C demonstrate that these rank gaps were basically the same for earnings plus cash nonlabor income and earnings alone, suggesting that the tax and transfer systems do not improve Black mobility relative to Whites for most of the distribution. Similarly, Zachary Parolin, Matthew Desmond, and Christopher Wimer (2023) explore poverty and inequality reduction from U.S. social safety net programs since 1967 and document that policy changes since the 1990s have created a regime that at once lowers poverty levels while exacerbating inequality among the poor.

Black-White Disposable Income and Earnings Rank Gaps by Percentile
Source: Authors’ calculations from the Current Population Survey (U.S. Census Bureau 2024).
Note: Disposable income is the sum of earnings and nonlabor income less federal, state, and payroll tax payments (inclusive of refundable tax credits). Sample is restricted to households with positive disposable income, earnings, and earnings plus nonlabor incomes. Earnings and incomes are in real thousands of dollars using the 2021 PCE and equivalized using the modified OECD scale. See text for details.
To reconcile the reduction in level gaps at the bottom of the distribution with the stagnation of the rank gaps, it is helpful to visualize the Black and White earnings distributions side by side, but overlapping to reflect the fact that the median of the Black distribution lies at the 25th percentile of the White distribution, and the 25th percentile of the Black distribution is likewise positioned atop the 10th percentile of the White distribution. Because the tax and transfer systems redistribute earnings to lower-income households, the left tails of each distribution compress to the right, and the distributions narrow in such a way that the measured distance between the 25th percentile of the Black distribution and the 25th percentile of the White distribution is now less. This represents a decrease in the earnings level gap. Although the distributions change shape so that the 25th percentiles are now closer together, the 25th percentile of the Black distribution is still in line with the 10th percentile of the White distribution: the rank measure does not improve.9
Rural-Urban Gaps
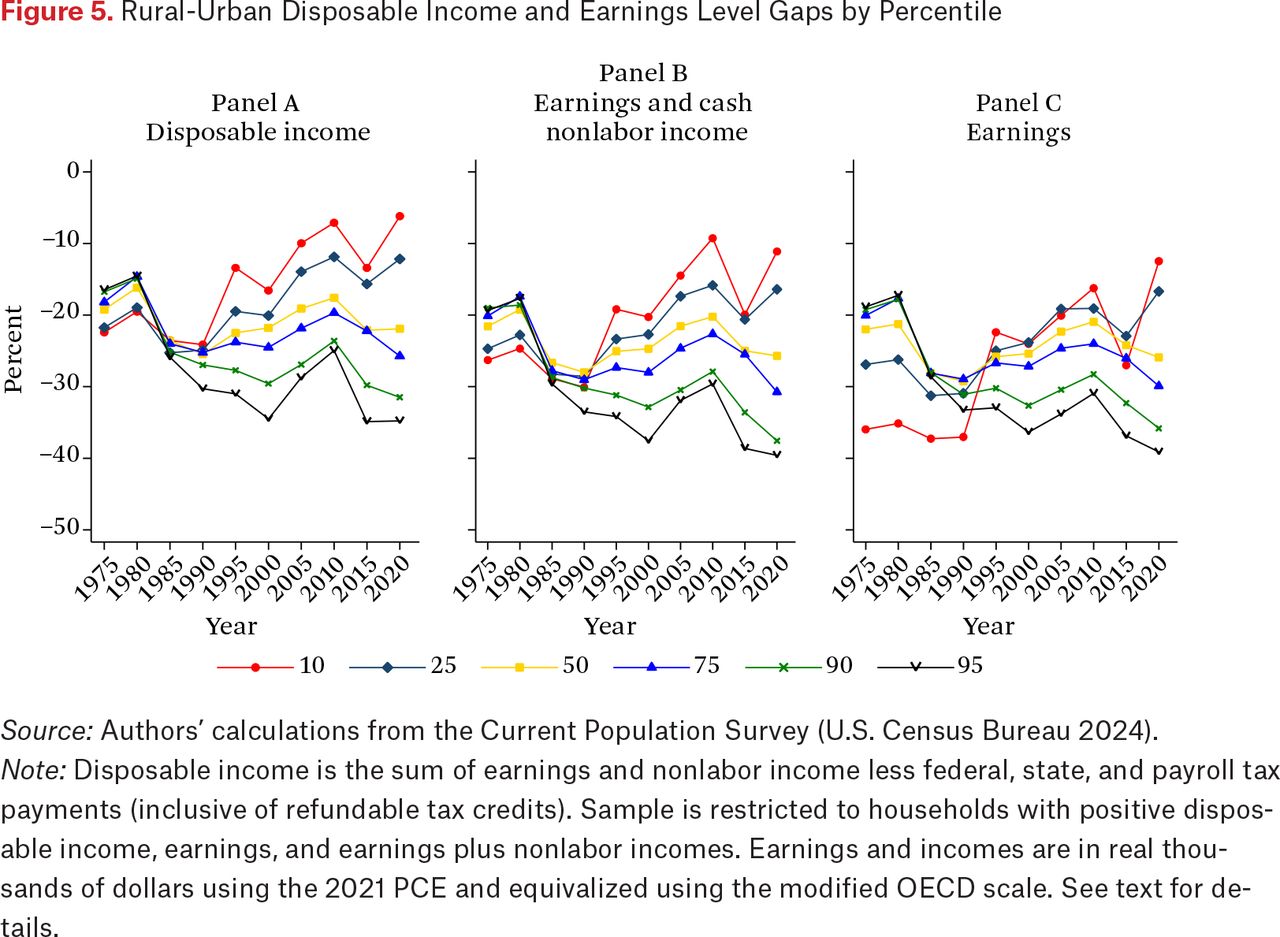
We next consider rural-urban gaps and how the trends compare relative to the Black-White gaps just discussed. Figure 5 presents the rural-urban level gaps, first for disposable income (panel A), followed by earnings plus cash nonlabor income (panel B), and then only earnings (panel C). The pattern is strikingly different than the Black-White level gaps. Rural-urban disposable income level gaps diverged across the distribution in the last five decades rather than converged. This divergence occurred as the bottom half of the rural distribution gained relative to the urban distribution, narrowing the level gap from 20 percent in the mid-1970s to 10 percent by 2010, while the top half of the rural distribution fell from a 15 percent level gap with urban residents to a 30 percent gap. The other notable feature of the rural-urban level gap is that, at the start of the period, the gap was higher in the bottom of the distribution, but by 1990 it reversed and the gap was larger in the upper tail of the distribution. In this sense, the rural-urban level gap is a tale of two halves like the Black-White level gap. As Lichter and Johnson (2025, this issue) observe, the diverging trends of rural areas, including the economic and population growth of formerly rural regions, potentially drives some of our microdata trends. Figure A.4 presents trends in the log level of disposable incomes where we see that incomes are rising for both rural and urban households, but similar to Black-White incomes, they are growing faster for rural than urban households in the left tail, and slower in the right tail.

Rural-Urban Disposable Income and Earnings Level Gaps by Percentile
Source: Authors’ calculations from the Current Population Survey (U.S. Census Bureau 2024).
Note: Disposable income is the sum of earnings and nonlabor income less federal, state, and payroll tax payments (inclusive of refundable tax credits). Sample is restricted to households with positive disposable income, earnings, and earnings plus nonlabor incomes. Earnings and incomes are in real thousands of dollars using the 2021 PCE and equivalized using the modified OECD scale. See text for details.
Panels B and C of figure 5 show that this post-1990 divergence is in evidence for both earnings plus nonlabor income and earnings alone. Panel B suggests that nonlabor income differentially benefited rural workers in the left tail of the income distribution, closing much of the difference between disposable income level gaps in panel A with the earnings level gaps in panel C. From 1975 to 1985, the difference in the rural-urban gap was at least 10 percentage points at the 10th percentile relative to the 90th percentile, which is double the gap in disposable income at the same percentiles. However, over subsequent decades, low-wage rural households gained substantially compared to urban households. David Autor (2019) attributes the declining status of low-wage urban workers to the declining job skills required of low-wage jobs in the urban marketplace.
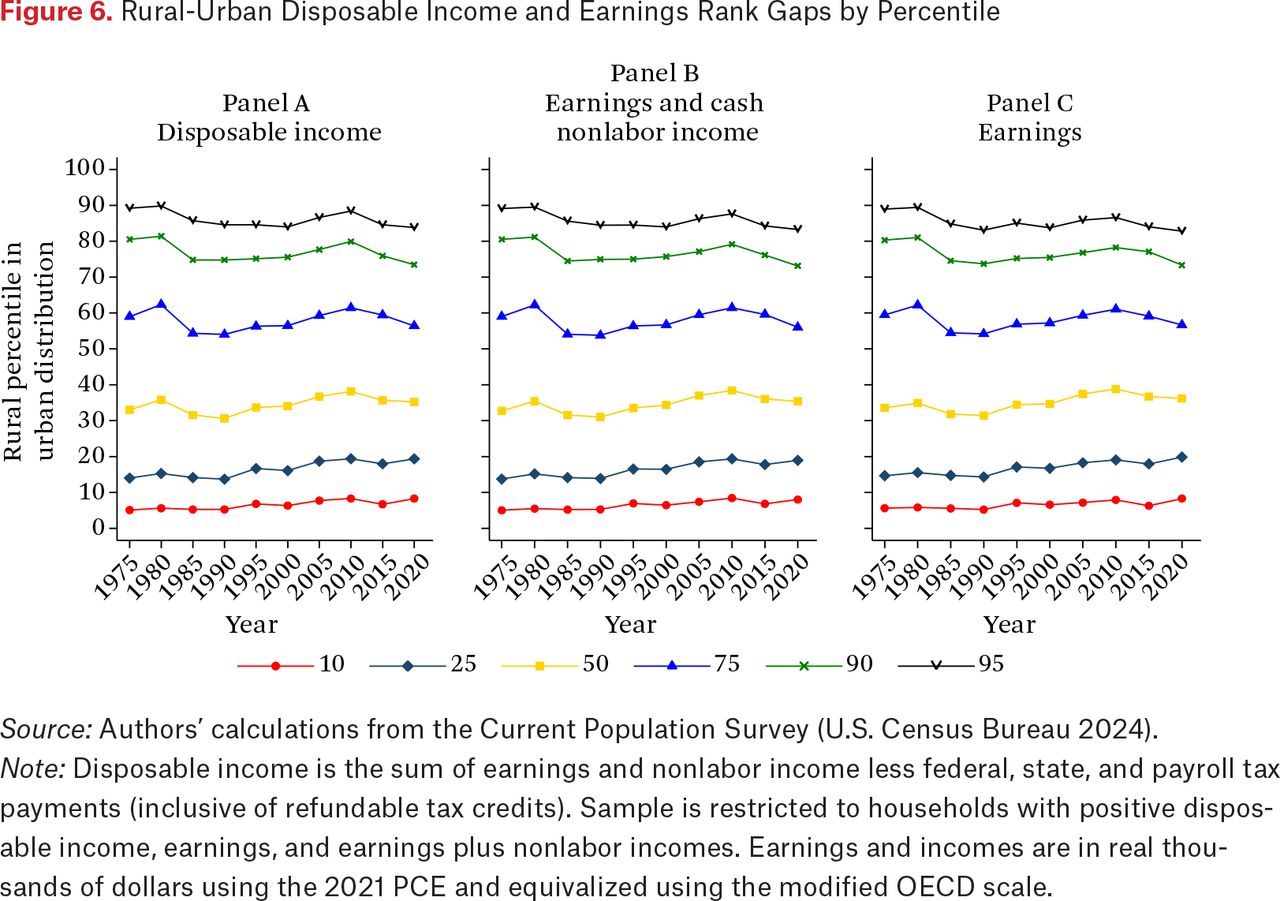
In figure 6, we present the rural-urban rank gaps. In this case the rank gaps between rural and urban residents at the 10th and 25th percentiles are much more favorable for rural households than the corresponding Black-White rank gaps were for Black households. At the 10th percentile of disposable income, rural residents improve 3 percentile points to the 8th percentile of the urban distribution by 2010 and stabilizing thereafter. At the 25th percentile, rural resident standing improves vis-à-vis urban residents from the 15th percentile to the 20th percentile. However, at the median and above, the rural-urban rank gaps are quite similar to those between Black and White workers. These patterns persist when restricting resources to earnings plus nonlabor income in panel C of figure 6 or earnings alone in panel C. The takeaway is that over the past forty-five years low-income rural residents have improved their standing in the urban rank distribution, but there has been no progress at the median and above. This means that differential redistribution in the U.S. tax/transfer system favors low-income rural household mobility, consistent with the finding of Lauren Nolan, Jane Waldfogel, and Christopher Wimer (2017) on poverty, but not for the middle and upper classes.

Rural-Urban Disposable Income and Earnings Rank Gaps by Percentile
Source: Authors’ calculations from the Current Population Survey (U.S. Census Bureau 2024).
Note: Disposable income is the sum of earnings and nonlabor income less federal, state, and payroll tax payments (inclusive of refundable tax credits). Sample is restricted to households with positive disposable income, earnings, and earnings plus nonlabor incomes. Earnings and incomes are in real thousands of dollars using the 2021 PCE and equivalized using the modified OECD scale.
To control for geographic differences in costs of living, we reproduce the Black-White and rural-urban disposable income level and rank gaps with controls for state fixed effects in figures A.5 to A.8. Although the main goal of our analysis is to make comparisons on income, this exercise provides insight into differences in lived experience because our income measures may overstate experienced inequality between low and high cost-of-living areas as well as the redistributive power of federal benefits at mitigating level and rank gaps, given that both income and transfers go further in areas with lower costs of living. Although controlling for cost of living at the county level is not feasible given the suppression of geographic identifiers for areas with populations less than one hundred thousand—which includes many rural areas—in the CPS ASEC, adding state fixed effects into our models will mitigate some of these concerns. Figures A.5, A.6, and A.8 show that the Black-White level and rank gaps and rural-urban rank gaps are essentially unchanged by the inclusion of state fixed effects. For rural-urban level gaps in figure A.7, distributional divergence remains evident, but the pattern is muted by state fixed effects. The tax and transfer systems alleviate more inequality at the 90th and 95th percentiles bringing the disposable income level gap up to 27 and 29 percentage points in 2020 relative to 31 and 35 percentage points in the absence of state fixed effects in figure 5.
Robustness
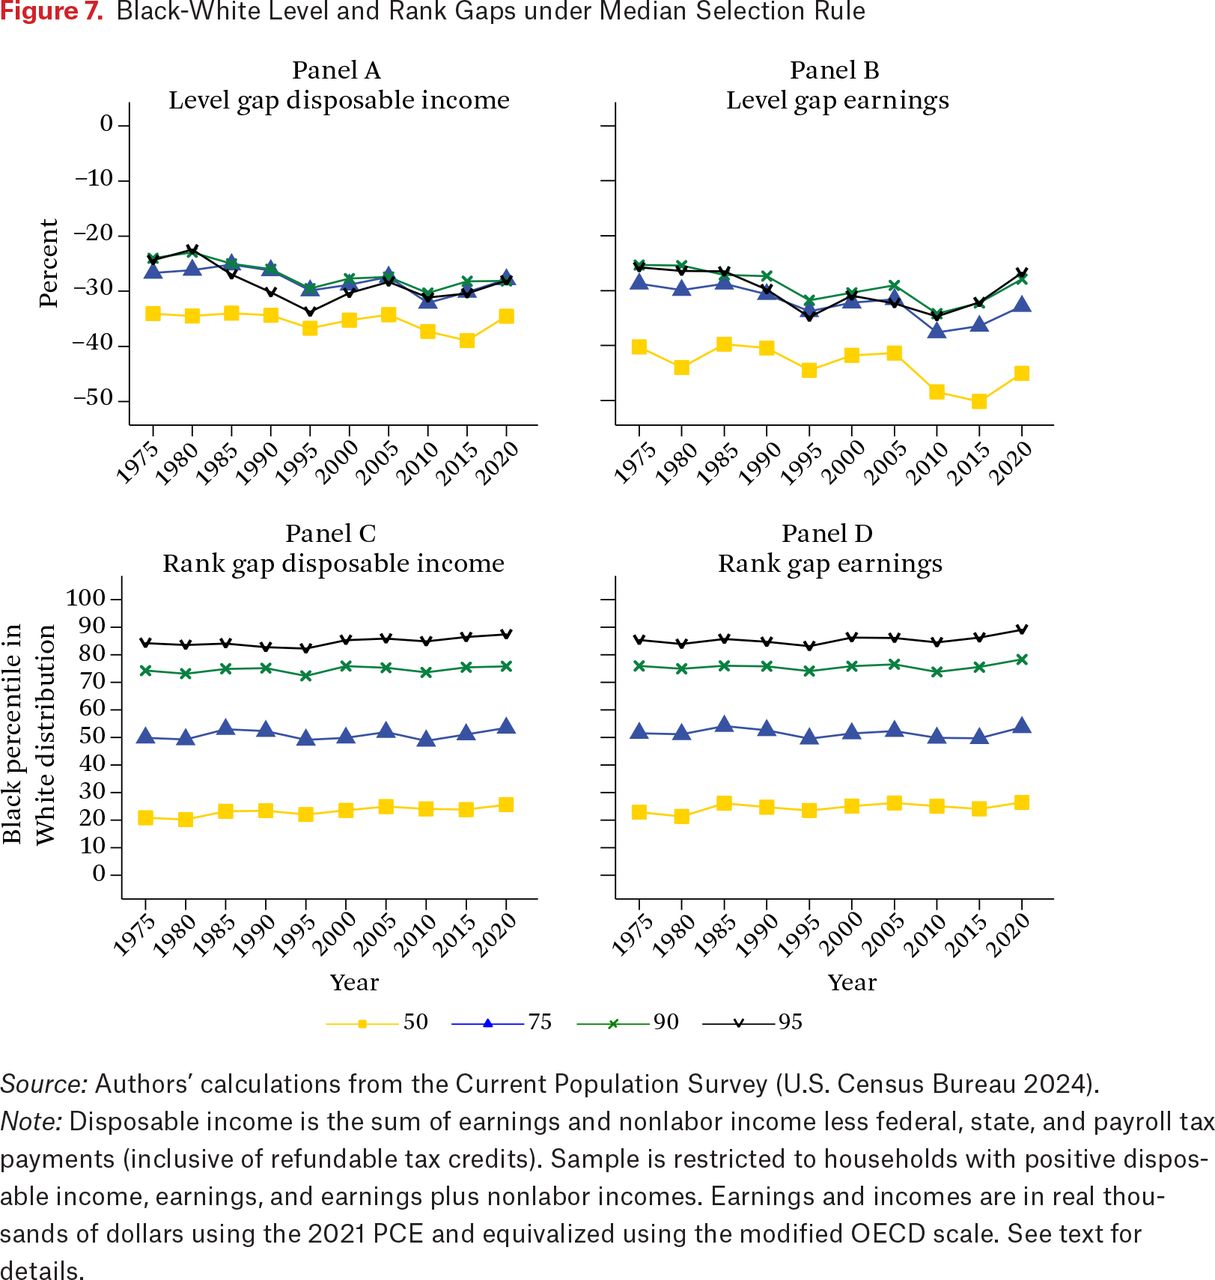
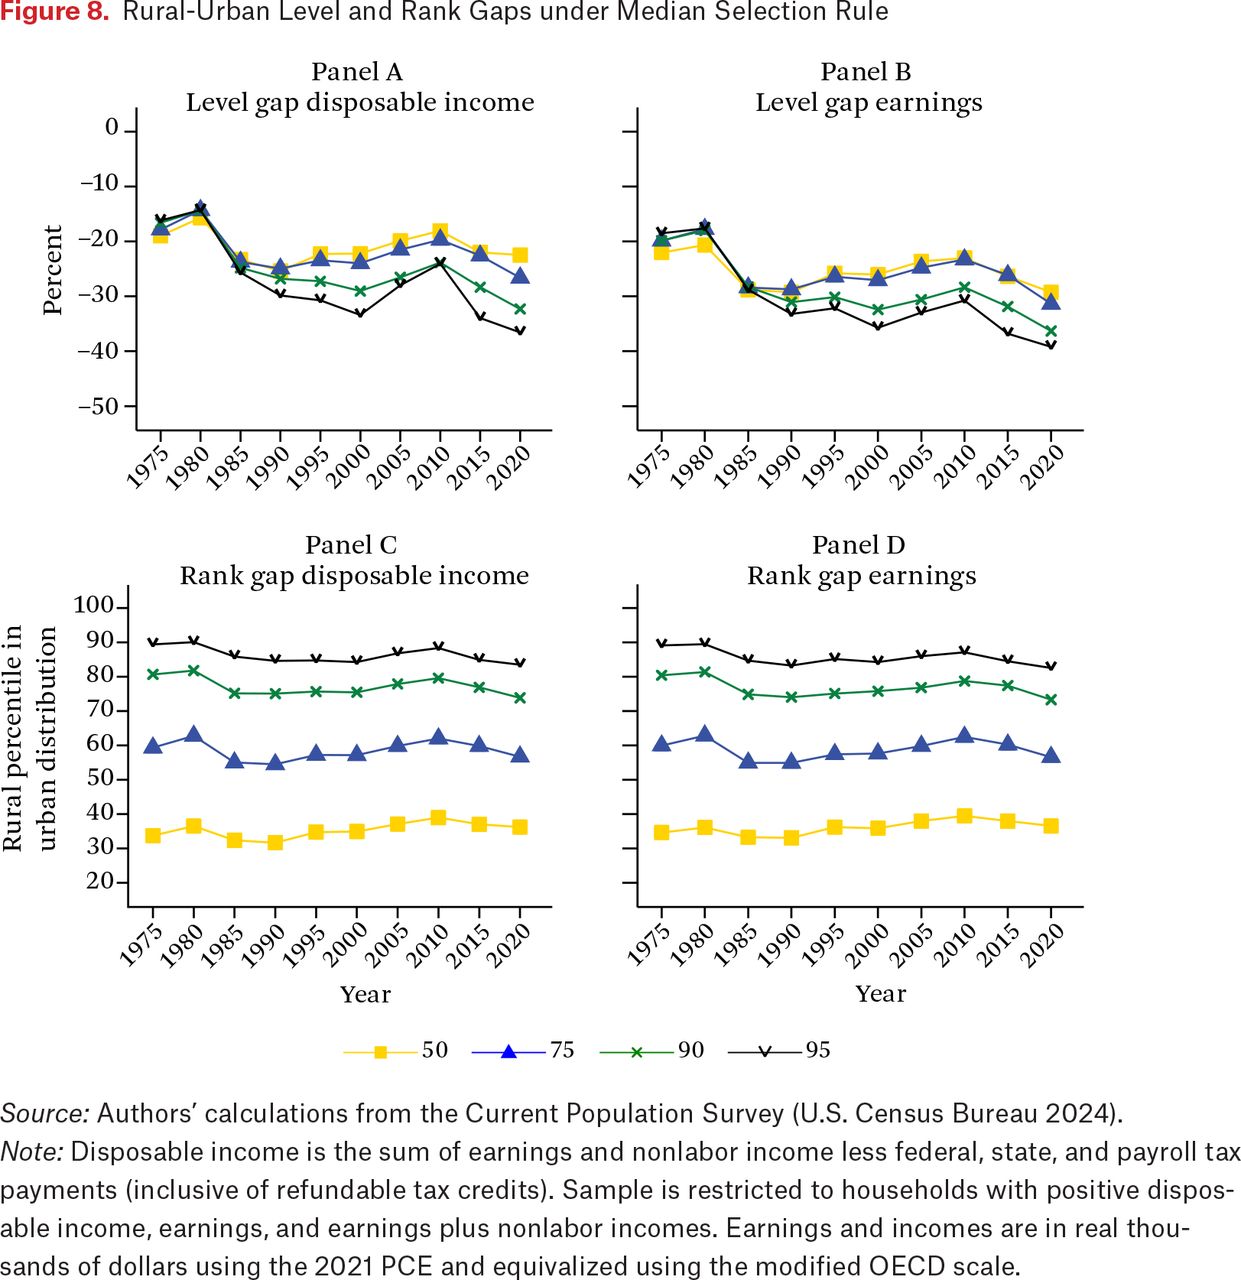
We conduct three sets of sensitivity checks on our baseline estimates. The first check is whether differential labor-force participation by race and rural status highlighted in figure 1 affects the estimated level and rank gaps. We implement this test by winsorizing the data and applying a median selection rule. Specifically, for any household with negative earnings or disposable incomes (which can occur from self-employment losses), we censor the data at 0 and then add $1 to all individuals before taking the natural log. This means that all individuals with earnings or income less than or equal to zero have log earnings (income) equal to 0. We then reestimate the quantile regression models of equations (1) and (2) with all those individuals retained in the sample, and report the results for the median and upper-half of the distribution for the Black-White gaps in figure 7 and rural-urban gaps in figure 8.

Black-White Level and Rank Gaps under Median Selection Rule
Source: Authors’ calculations from the Current Population Survey (U.S. Census Bureau 2024).
Note: Disposable income is the sum of earnings and nonlabor income less federal, state, and payroll tax payments (inclusive of refundable tax credits). Sample is restricted to households with positive disposable income, earnings, and earnings plus nonlabor incomes. Earnings and incomes are in real thousands of dollars using the 2021 PCE and equivalized using the modified OECD scale. See text for details.

Rural-Urban Level and Rank Gaps under Median Selection Rule
Source: Authors’ calculations from the Current Population Survey (U.S. Census Bureau 2024).
Note: Disposable income is the sum of earnings and nonlabor income less federal, state, and payroll tax payments (inclusive of refundable tax credits). Sample is restricted to households with positive disposable income, earnings, and earnings plus nonlabor incomes. Earnings and incomes are in real thousands of dollars using the 2021 PCE and equivalized using the modified OECD scale.
Figures 7 and 8 each have four panels, panels A and B showing level gaps for equivalized household disposable income and earnings, and panels C and D showing the corresponding rank gaps. Comparing panel C of figure 3 with panel B of figure 7 indicates that selective labor-force withdrawal does result in a worsening of the Black-White level gap of earnings, by about 5 percentage points in a typical year, but by as much as 10 percentage points in the years after the Great Recession at the median. This is consistent with the findings of Bayer and Charles (2018) for Black men. At the 75th percentile and higher, we continue to see a worsening of the Black-White levels gap, but accounting for those with no or negative earnings/incomes does not affect the trend, only the size of the gap (about 5 points larger). A similar result obtains for the level gap of disposable income in the upper-left panel—labor-force selection increases the size of the gap by about 5 points but not the trend. Perhaps surprising, accounting for selection has no discernible effect on the rank gaps of earnings or disposable income. Likewise, comparing figure 5 with figure 8 shows that possible nonrandom labor-force participation worsens gaps at the median, but has no effect on the upper tail of the rural-urban level and rank gaps.
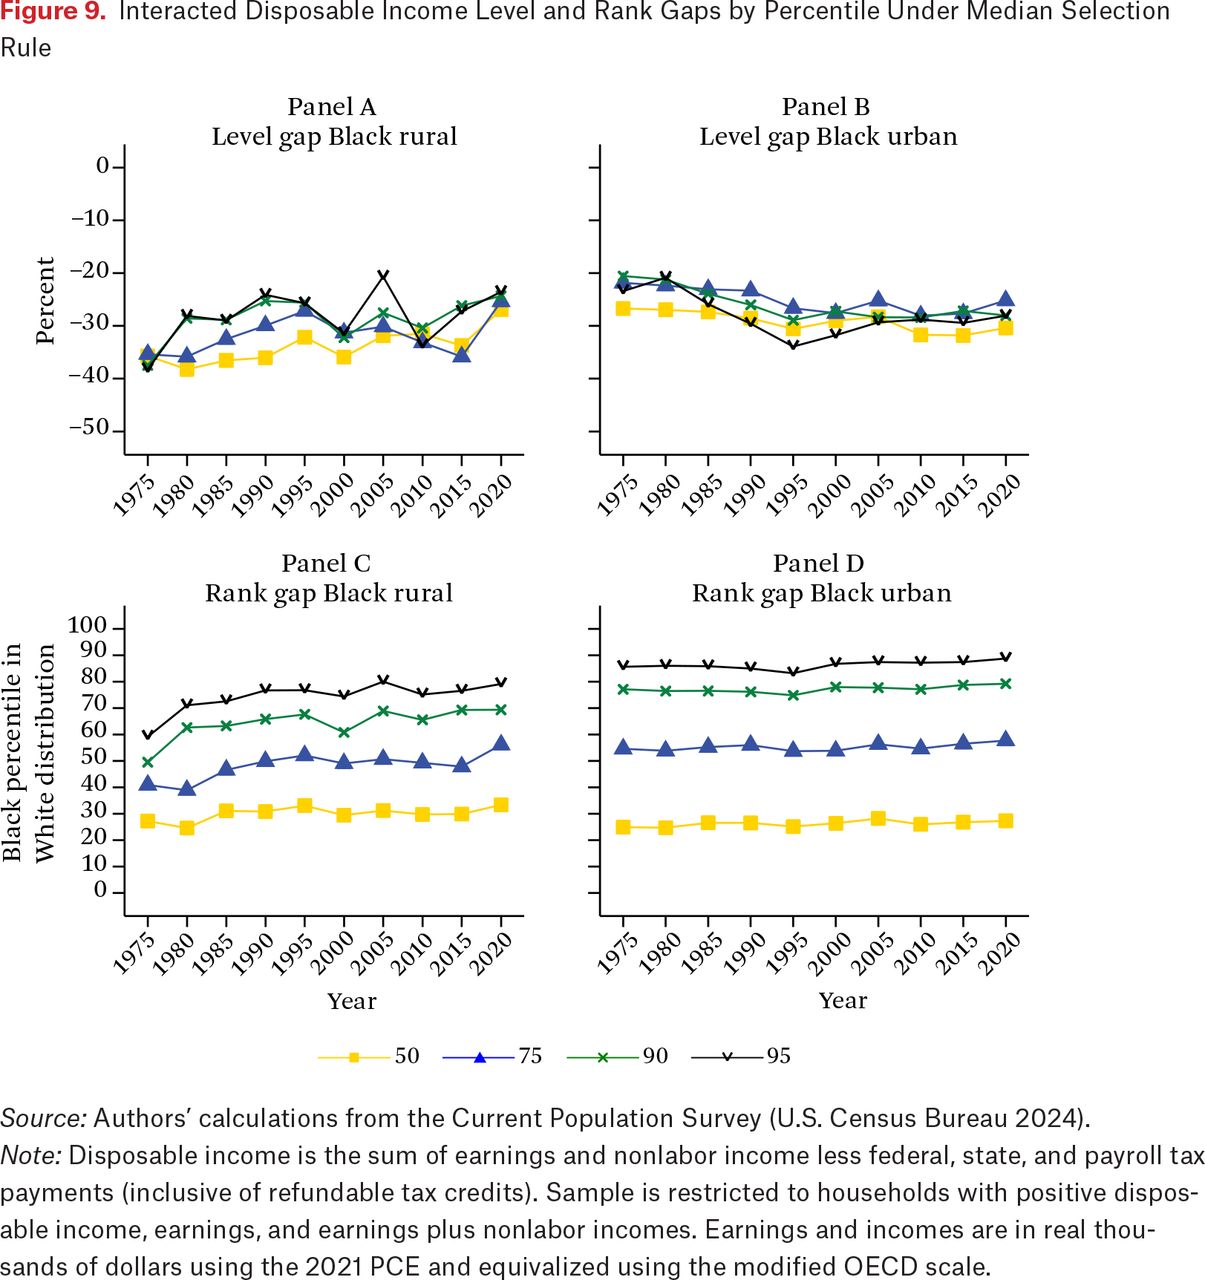
The second check builds on the first by examining the intersection of racial and geographic disparities. We compare Black rural (urban) households with White rural (urban) households, maintaining the median selection rule assumption in light of the large increase in nonworking Black, rural households depicted in figure A.1. Figure 9 presents in panels A and B the Black-White level gaps in disposable income for rural and urban households; panels C and D present the corresponding rank gaps. There we see that rural Black households gained on their White counterparts at the median and upper tail of the distribution in both level and relative position in the White distribution. The level gap narrowed by about 10 percentage points after 1975, and the rank position by nearly 20 points at the 75th percentile and above. Much of this gain occurred from 1975 through 1990, although the five years leading up to the pandemic saw again strong gains among Black rural households.10 At the same time that relative disposable incomes were improving for rural Blacks, it was deteriorating for urban Black households relative to White households, and the rank position of Black urban households was relatively stable over the entire period.

Interacted Disposable Income Level and Rank Gaps by Percentile Under Median Selection Rule
Source: Authors’ calculations from the Current Population Survey (U.S. Census Bureau 2024).
Note: Disposable income is the sum of earnings and nonlabor income less federal, state, and payroll tax payments (inclusive of refundable tax credits). Sample is restricted to households with positive disposable income, earnings, and earnings plus nonlabor incomes. Earnings and incomes are in real thousands of dollars using the 2021 PCE and equivalized using the modified OECD scale.
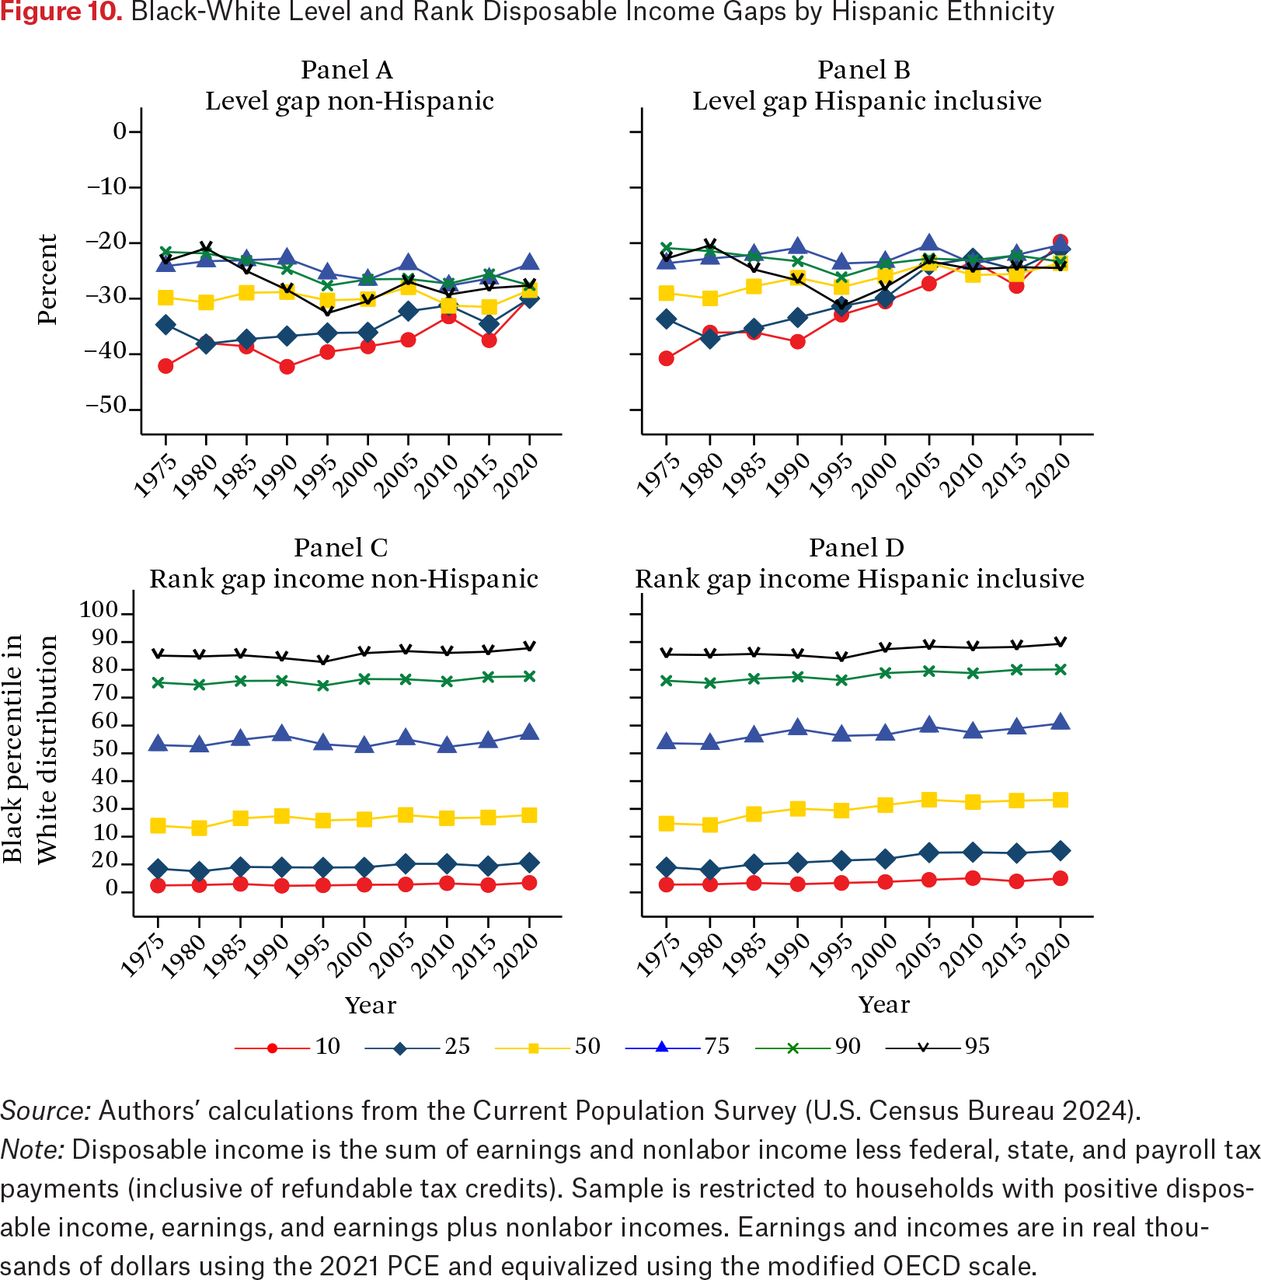
The baseline estimates assign those with Hispanic ethnicity to the Other race category, meaning we are comparing Black non-Hispanics with White non-Hispanics. Because race and ethnicity capture different social constructs, it is common in the literature to combine them and compare Blacks with Whites regardless of Hispanic ethnicity. Thus, the third robustness check we conduct is found in figure 10, where we present the original level and rank disposable income gaps from figures 3 and 4 in panels A and C, along with reestimated gaps that combine race and ethnicity in panels B and D. To maintain comparability with the baseline models, we present estimates for the whole distribution assuming no nonrandom selection into work. In this case, panels B and D indicate substantially more Black progress in both level and rank in the bottom half of the distribution. This suggests that more Hispanics affiliate with White race and their economic fortunes lie in between Black non-Hispanics and White non-Hispanics (Lee and Bean 2010), resulting in a narrowing gap between Black and White workers across Hispanic ethnicity.

Black-White Level and Rank Disposable Income Gaps by Hispanic Ethnicity
Source: Authors’ calculations from the Current Population Survey (U.S. Census Bureau 2024).
Note: Disposable income is the sum of earnings and nonlabor income less federal, state, and payroll tax payments (inclusive of refundable tax credits). Sample is restricted to households with positive disposable income, earnings, and earnings plus nonlabor incomes. Earnings and incomes are in real thousands of dollars using the 2021 PCE and equivalized using the modified OECD scale.
CONCLUSION
Our results paint a mixed portrait of economic progress of Black and rural households relative to their White and urban counterparts over the last fifty years. In any given year for both Black and rural households, the tax and transfer systems substantially attenuate level income gaps compared to their White and urban counterparts in the bottom half of the income distribution, and those gaps narrowed over time. Although Black rural households in the top half of the distribution also experienced improvements in their level gaps, Black urban households and rural households overall saw those same level gaps worsen in the top half of the distribution. This has resulted in converged disposable income level gaps of about 30 percent between Black and White households across the distribution in 2021 and a divergence in level gaps between rural and urban households resulting in a 25-percentage point difference between the bottom and top of the disposable income distribution. By contrast, changes in positional disposable income inequality for both groups have been much more muted since the 1970s, with little upward mobility of Black households in the White distribution, with the possible exception of the median, but more progress of low-income rural households in the urban distribution, though no change at the top. Upper tail improvements are only notable for Black rural households in the White rural household distribution.
How can we reconcile inequality estimates that depict convergence in Black-White level gaps, divergence in rural-urban gaps, and at the same time a relative lack of progress in rank mobility? These results are consistent with a fifty-year trajectory in which Black and White and rural and urban incomes show overall improvement in absolute terms, but at varying rates between groups. This can produce a result wherein both phenomena are true at once; Black and rural incomes have generally grown over this period, but not at a rate relative to White and urban incomes to generate meaningful rank mobility realignment in economic well-being. Our findings are consistent with similar work by Parolin, Desmond, and Wimer (2023) which demonstrates that, over a roughly fifty-year period beginning in the late 1960s, the U.S. safety net of antipoverty programs reduces poverty but then evolves, from the mid-1990s and onward, to reduce poverty levels while exacerbating inequality among the poor.
The redistributive tax and transfer policies summarized here interact with broader societal shifts. Since the 1970s, the United States has transitioned into a more highly educated, demographically diverse, and unequal society. Hispanics in the United States are a mix of citizen and noncitizen residents drawn from a diverse array of nations—in some instances with little in common beyond shared language. Our evidence shows that their incomes are generally—on average—somewhere between that of Black and White Americans. Moreover, features of the tax system may implicitly exacerbate racial inequality across relatively higher-income households (Brown 2022; Gale 2021). As recently demonstrated (Holtzblatt et al. 2023), the so-called marriage penalty is one such feature in the tax code that may differentially penalize higher-income Black households. Within the tax code, thresholds, deductions, credits, and rates for married filers are not double their single counterparts, and this penalty is more acute for married couples with similar incomes than for spouses with disparate incomes. Janet Holtzblatt and her colleagues show that married Black couples are more likely to have similar incomes than married White couples, and this may worsen disposable income gaps at the top.
The nation’s set of direct cash, near-cash, and refundable tax credits have lowered poverty but without substantial realignment of racial or rural-urban intragenerational inequality. Changing social interactions, regional housing tenure choice decisions, and family formation patterns may ultimately help reshape racial, ethnic, and rural-urban inequality trends. For now, our evidence strongly suggests that the tax and transfer policies highlighted here supplement low and moderate earnings for Black and rural residents. However, these policies—as currently designed—struggle to keep pace with rising earnings inequality, which continues to drive large gaps in relative economic well-being across race and place.
FOOTNOTES
↵1. We expand on these studies by assessing gaps both in terms of levels as well as position across the full distribution of disposable incomes.
↵2. We divide household income by a factor ϕ=0.67+0.33[_n(adults-1)]+0.2n_(child 0-13)+0.33n_(child 14+), where _n(adults-1) is the number of adults in the household less the householder, and n_(child 0-13) and n_(child 14+) are the number of dependent children in the household age thirteen and younger and fourteen and older, respectively.
↵3. Because we are using equivalized income we retain all individuals and use the person-level weight. The results are robust to only selecting the household head and using the corresponding inverse probability household weight.
↵4. All appendix tables and figures can be found at https://www.rsfjournal.org/content/11/2/115/tab-supplemental.
↵5. The assumption that nonworkers would earn a wage below the median if they entered the labor force generally does not apply to married women with at least a college degree during peak childbearing years, where periods of nonwork are generally fertility related.
↵6. Figure A.1 shows the share of rural Black, rural White, urban Black, and urban White households reporting no earnings in the year. Trends are similar to figure 1 and a notable increase in nonworking households occurs in 2000. Urban Black households and urban White households are nearly identical in level to their pooled counterparts. Although the share of nonworking rural White households are on average only 3 percentage points higher than the pooled share, the share of nonworking rural Black households is much higher, reaching 34 percent in 2020.
↵7. The shares of rural Black, rural White, urban Black, and urban White households receiving assistance are presented in figure A.2.
↵8. In results not displayed, in calendar year 2021 these racial and geography gaps were nearly eliminated with the huge expansions in the generosity and reach of UI, and the temporarily expanded CTC, so that nearly six in ten households touched the safety net across race and geography.
↵9. This example is adapted from Bayer and Charles (2018), who provide a more in-depth explanation of level and rank gaps with images depicting distributions changing shape in the manner described.
↵10. Figure A.9 presents trends in the log level of disposable incomes, where we see that incomes are rising for both Black rural and White rural households, though faster among Black households over much of the distribution.
- © 2025 Russell Sage Foundation. Hardy, Bradley L., Shria Holla, Elizabeth S. Krause, and James P. Ziliak. 2025. “Stalled Progress? Five Decades of Black-White and Rural-Urban Income Gaps.” RSF: The Russell Sage Foundation Journal of the Social Sciences 11(2): 115–36. https://doi.org/10.7758/RSF.2025.11.2.06. Hardy, Krause, and Ziliak are grateful for the financial support from National Science Foundation (Award No. 2214640). We appreciate the helpful comments on earlier versions from workshop participants at Duke University, Georgetown University, the Paris School of Economics, the Russell Sage Foundation, and the University of Kentucky. The opinions and conclusions expressed here are solely those of the authors and do not reflect the opinions of any sponsoring agency. Direct correspondence to: Bradley Hardy, at bradley.hardy{at}georgetown.edu, 125 E St. NW, Washington, DC 20001 United States.
Open Access Policy: RSF: The Russell Sage Foundation Journal of the Social Sciences is an open access journal. This article is published under a Creative Commons Attribution-NonCommercial-NoDerivs 3.0 Unported License.
REFERENCES
In this issue


Jump to section
Related Articles
Cited By...
- No citing articles found.