
Article Figures & Data
Figures
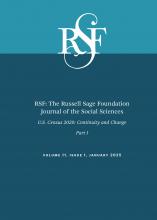
- Figure 1.
Ethnoracial Patterns: All Flows (Counts)
Source: Authors’ calculations based on U.S. Census Bureau 2010 and American Community Survey, 2010–2019.
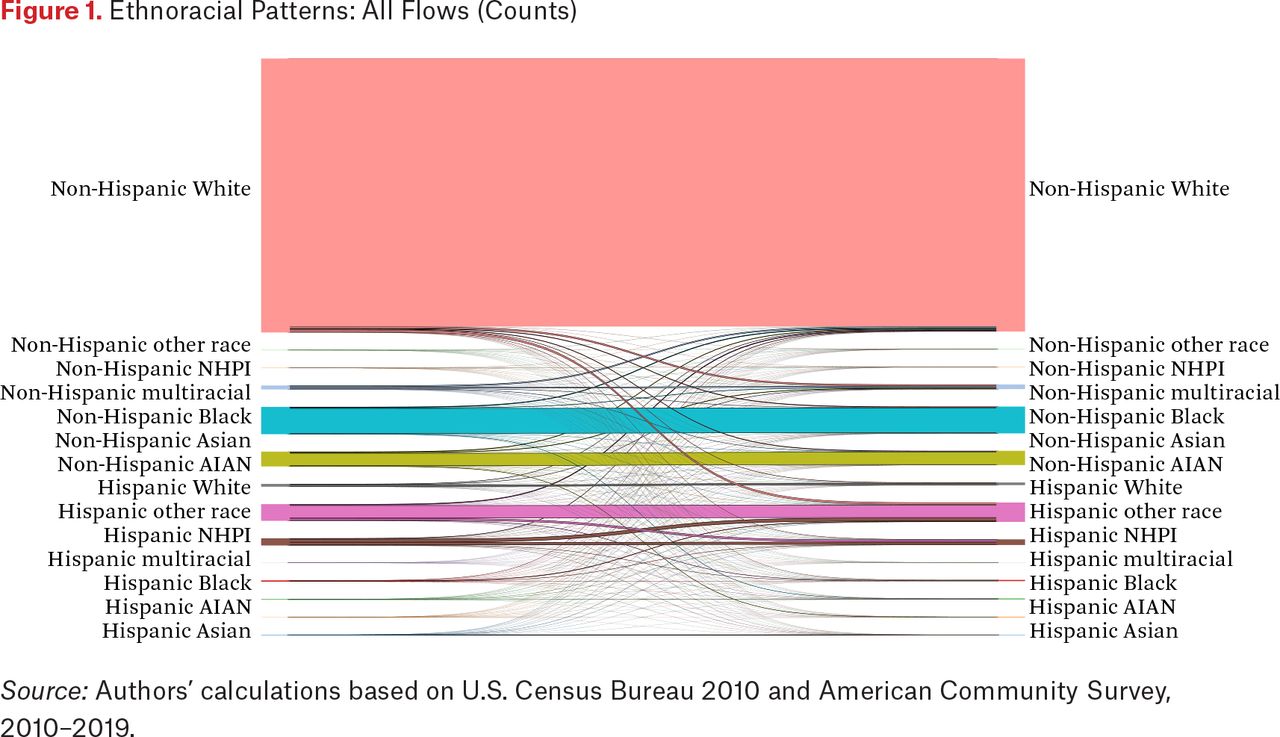
- Figure 2.
Ethnoracial Patterns: All Flows (Percent of 2010 Decennial)
Source: Authors’ calculations based on U.S. Census Bureau 2010 and American Community Survey, 2010–2019.
Note: The ethnoracial flows are from the 2010 Census on the left to the 2010–2019 ACS on the right. For respondents with multiple ACS entries, we restrict to the most recent response. There are 196 (14 × 14) ethnoracial pairs between which respondents could change. This figure pools native- and foreign-born respondents. The sample is restricted to cohorts born from 1920 to 1985.
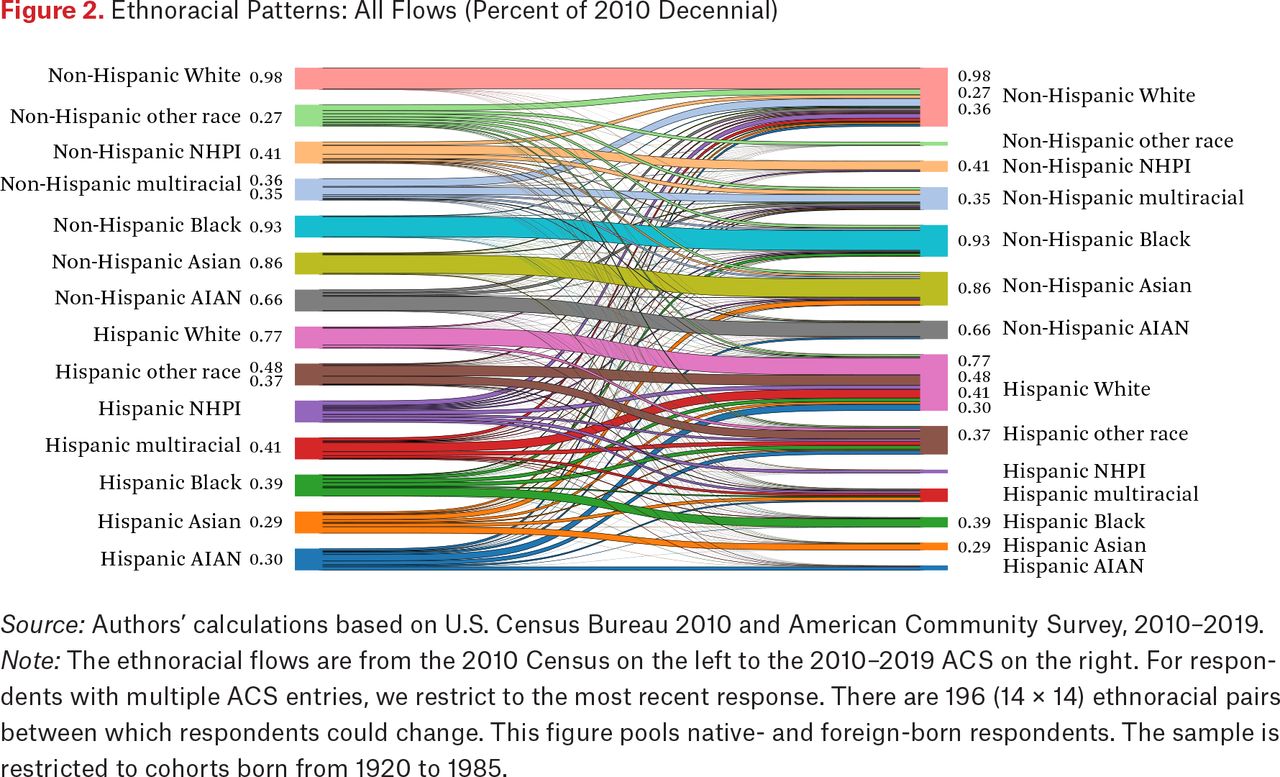
- Figure 3.
Prominent Racial Flows Within Ethnicity (Pooled)
Source: Authors’ calculations based on U.S. Census Bureau 2010 and American Community Survey, 2010–2019.
Note: Ethnoracial flows are from the 2010 Census on the left to the 2010– 2019 ACS on the right. For respondents with multiple ACS entries, we restrict to the most recent response. There are 196 ethnoracial pairs between which respondents could change. This figure restricts to those pairs in which ethnicity remained constant, and for which the percentage of respondents who switched racial responses was at least 18 percent, which is the 95th percentile of the variation in racial change. We call these flow rates above the 95th percentile Prominent Flows. This figure pools native- and foreign-born respondents. The sample is restricted to cohorts born between 1920 and 1985.
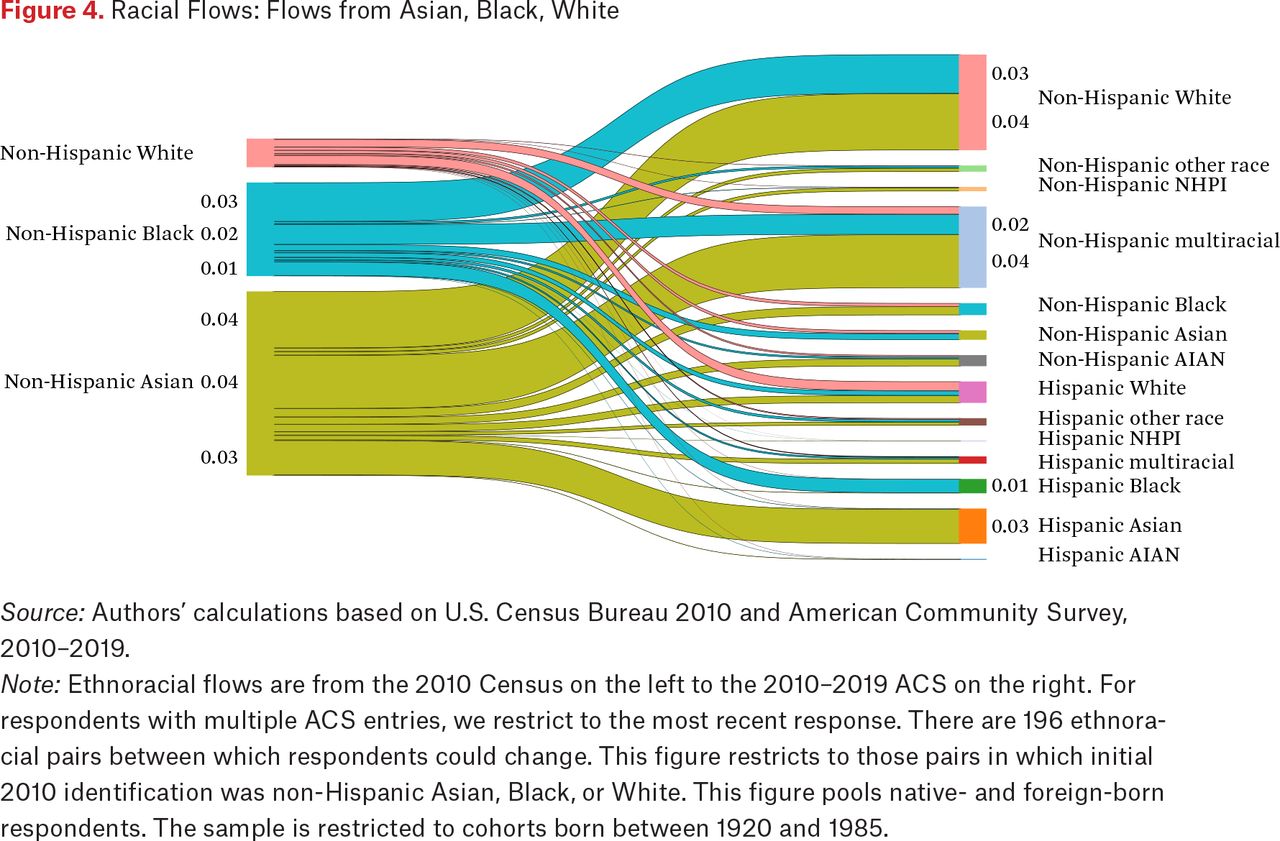
- Figure 4.
Racial Flows: Flows from Asian, Black, White
Source: Authors’ calculations based on U.S. Census Bureau 2010 and American Community Survey, 2010–2019.
Note: Ethnoracial flows are from the 2010 Census on the left to the 2010–2019 ACS on the right. For respondents with multiple ACS entries, we restrict to the most recent response. There are 196 ethnoracial pairs between which respondents could change. This figure restricts to those pairs in which initial 2010 identification was non-Hispanic Asian, Black, or White. This figure pools native- and foreign-born respondents. The sample is restricted to cohorts born between 1920 and 1985.
- Figure 5.
Ethnic Flows
Source: Authors’ calculations based on U.S. Census Bureau 2010 and American Community Survey, 2010–2019.
Note: Ethnoracial flows are from the 2010 Census on the left to the 2010–2019 ACS on the right. For respondents with multiple ACS entries, we restrict to the most recent response. There are 196 ethnoracial pairs between which respondents could change. This figure restricts to those pairs in which initial 2010 identification was non-Hispanic, but later identification was non-Hispanic. This figure pools native and foreign-born respondents. The sample is restricted to cohorts born between 1920 and 1985.
- Figure 6.
Prominent Racial Flows, Within Ethnicity (Native-Born)
Source: Authors’ calculations based on U.S. Census Bureau 2010 and American Community Survey, 2010–2019.
Note: Ethnoracial flows are from the 2010 Census on the left to the 2010–2019 ACS on the right. For respondents with multiple ACS entries, we restrict to the most recent response. There are 196 ethnoracial pairs between which respondents could change. This figure restricts to those pairs in which ethnicity remained constant, and for which the percentage of respondents who switched racial responses was at least 18 percent, which is the 95th percentile of the variation in racial change. We call these flow rates above the 95th percentile “Prominent Flows.” This figure pools native- and foreign-born respondents. The sample is restricted to cohorts born between 1920 and 1985. This figure differs from figure 3 in that it is further restricted to native-born U.S. respondents.
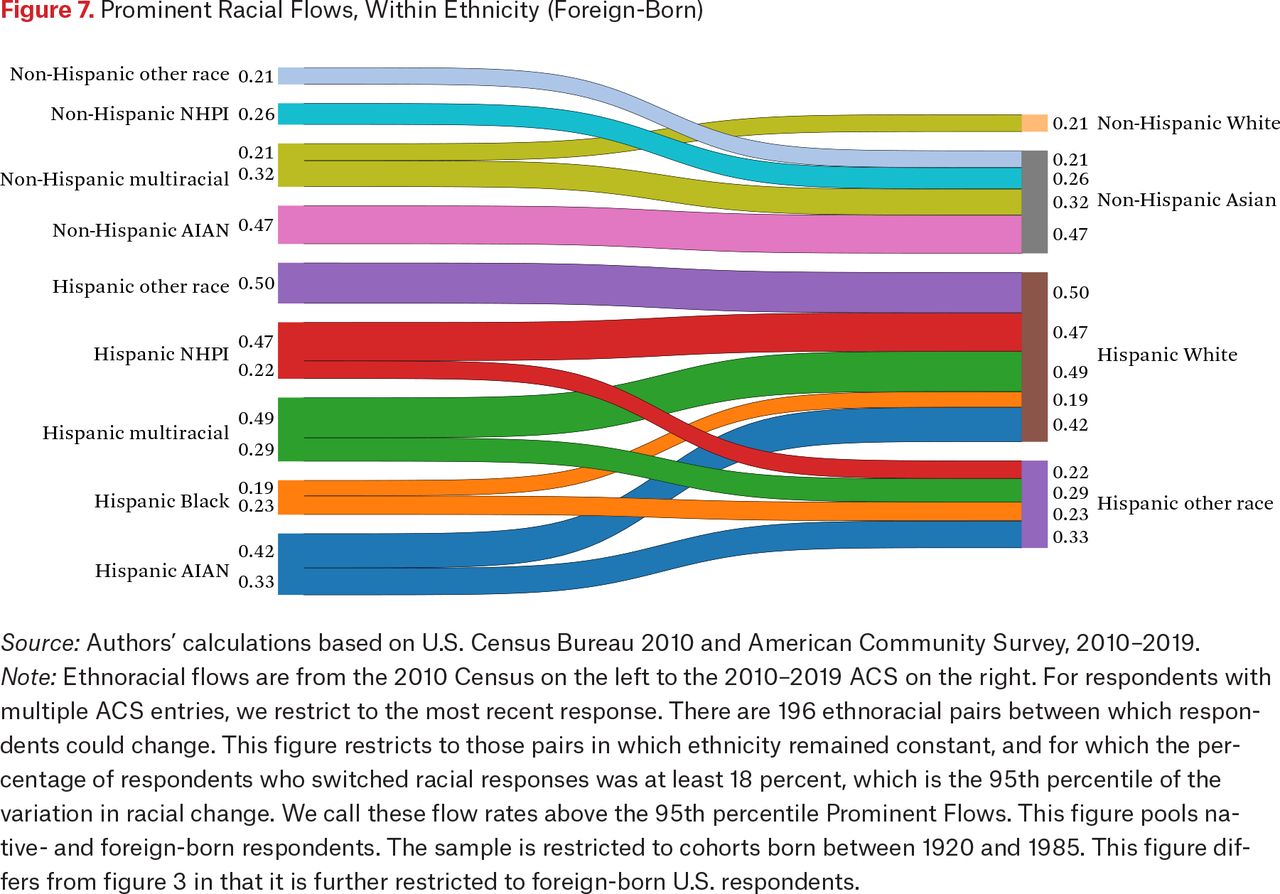
- Figure 7.
Prominent Racial Flows, Within Ethnicity (Foreign-Born)
Source: Authors’ calculations based on U.S. Census Bureau 2010 and American Community Survey, 2010–2019.
Note: Ethnoracial flows are from the 2010 Census on the left to the 2010–2019 ACS on the right. For respondents with multiple ACS entries, we restrict to the most recent response. There are 196 ethnoracial pairs between which respondents could change. This figure restricts to those pairs in which ethnicity remained constant, and for which the percentage of respondents who switched racial responses was at least 18 percent, which is the 95th percentile of the variation in racial change. We call these flow rates above the 95th percentile Prominent Flows. This figure pools native- and foreign-born respondents. The sample is restricted to cohorts born between 1920 and 1985. This figure differs from figure 3 in that it is further restricted to foreign-born U.S. respondents.
- Figure 8.
Trends in Ethnoracial Change by Birth Cohort
Source: Authors’ calculations based on U.S. Census Bureau 2010 and American Community Survey, 2010–2019.
Note: Rates of ethnoracial change are from the 2010 Census to the 2010–2019 ACS. Rates are broken down by birth decade. For respondents with multiple ACS entries, we restrict to the most recent response. There are 196 ethnoracial pairs between which respondents could change. This figure shows rate changes for changes from any designation to any different designation (left axis) as well as the rate change from Black to White or White to Black. (Black-White changes are inclusive of ethnicities. For example, a respondent who changed ethnicity but still identified as Black would not be counted as a Black-White change.) This figure pools native- and foreign-born respondents. The sample is restricted to cohorts born between 1920 and 1985.
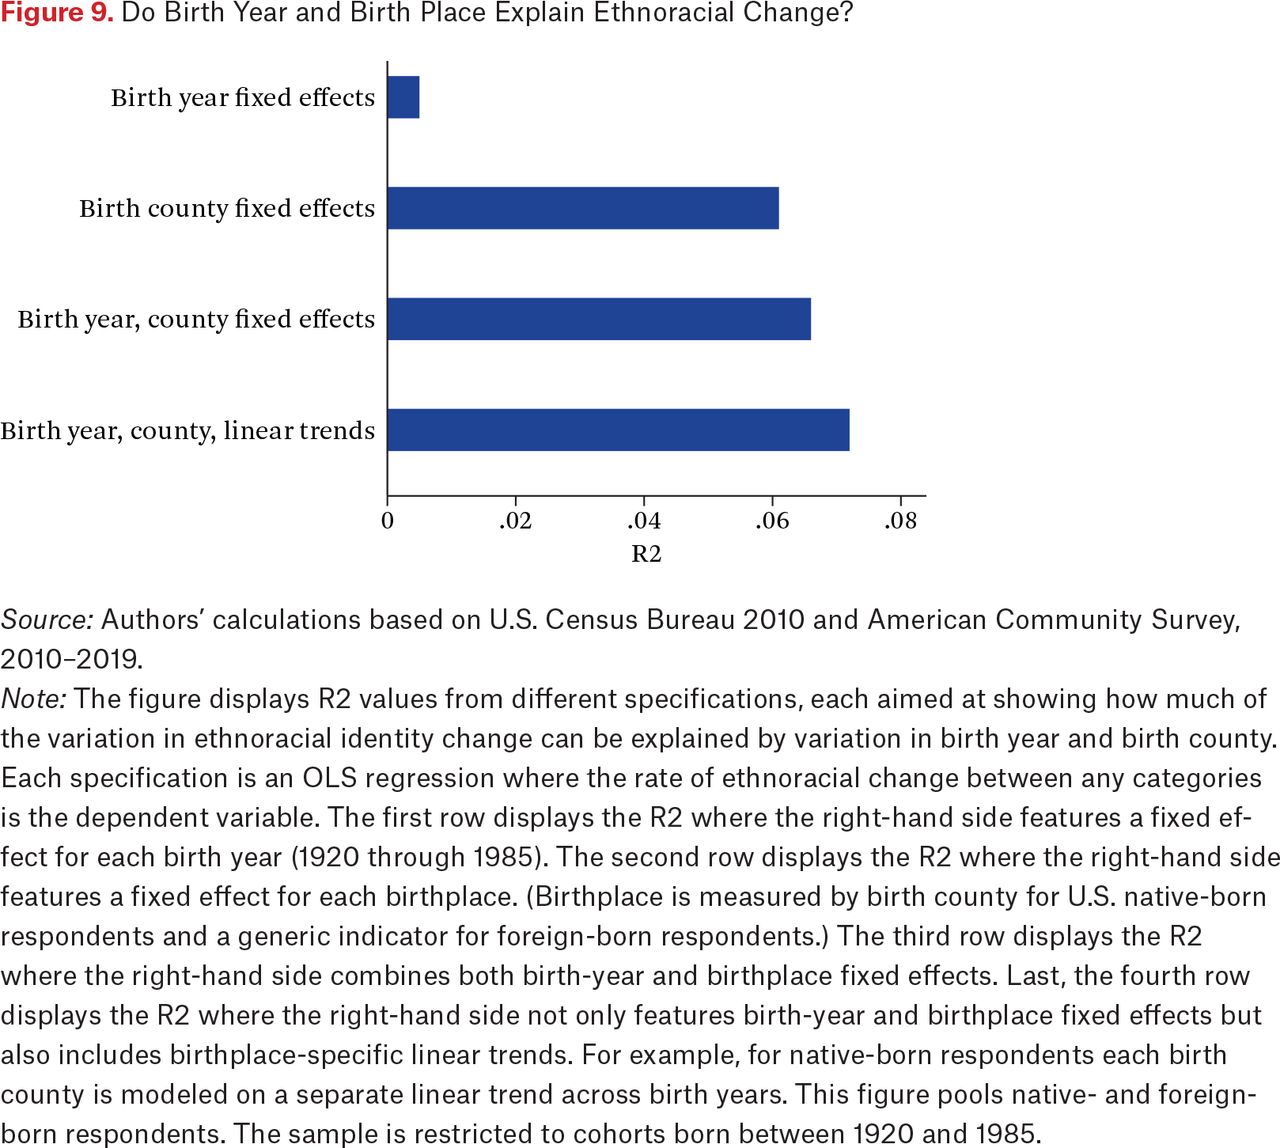
- Figure 9.
Do Birth Year and Birth Place Explain Ethnoracial Change?
Source: Authors’ calculations based on U.S. Census Bureau 2010 and American Community Survey, 2010–2019.
Note: The figure displays R2 values from different specifications, each aimed at showing how much of the variation in ethnoracial identity change can be explained by variation in birth year and birth county. Each specification is an OLS regression where the rate of ethnoracial change between any categories is the dependent variable. The first row displays the R2 where the right-hand side features a fixed effect for each birth year (1920 through 1985). The second row displays the R2 where the right-hand side features a fixed effect for each birthplace. (Birthplace is measured by birth county for U.S. native-born respondents and a generic indicator for foreign-born respondents.) The third row displays the R2 where the right-hand side combines both birth-year and birthplace fixed effects. Last, the fourth row displays the R2 where the right-hand side not only features birth-year and birthplace fixed effects but also includes birthplace-specific linear trends. For example, for native-born respondents each birth county is modeled on a separate linear trend across birth years. This figure pools native- and foreign-born respondents. The sample is restricted to cohorts born between 1920 and 1985.
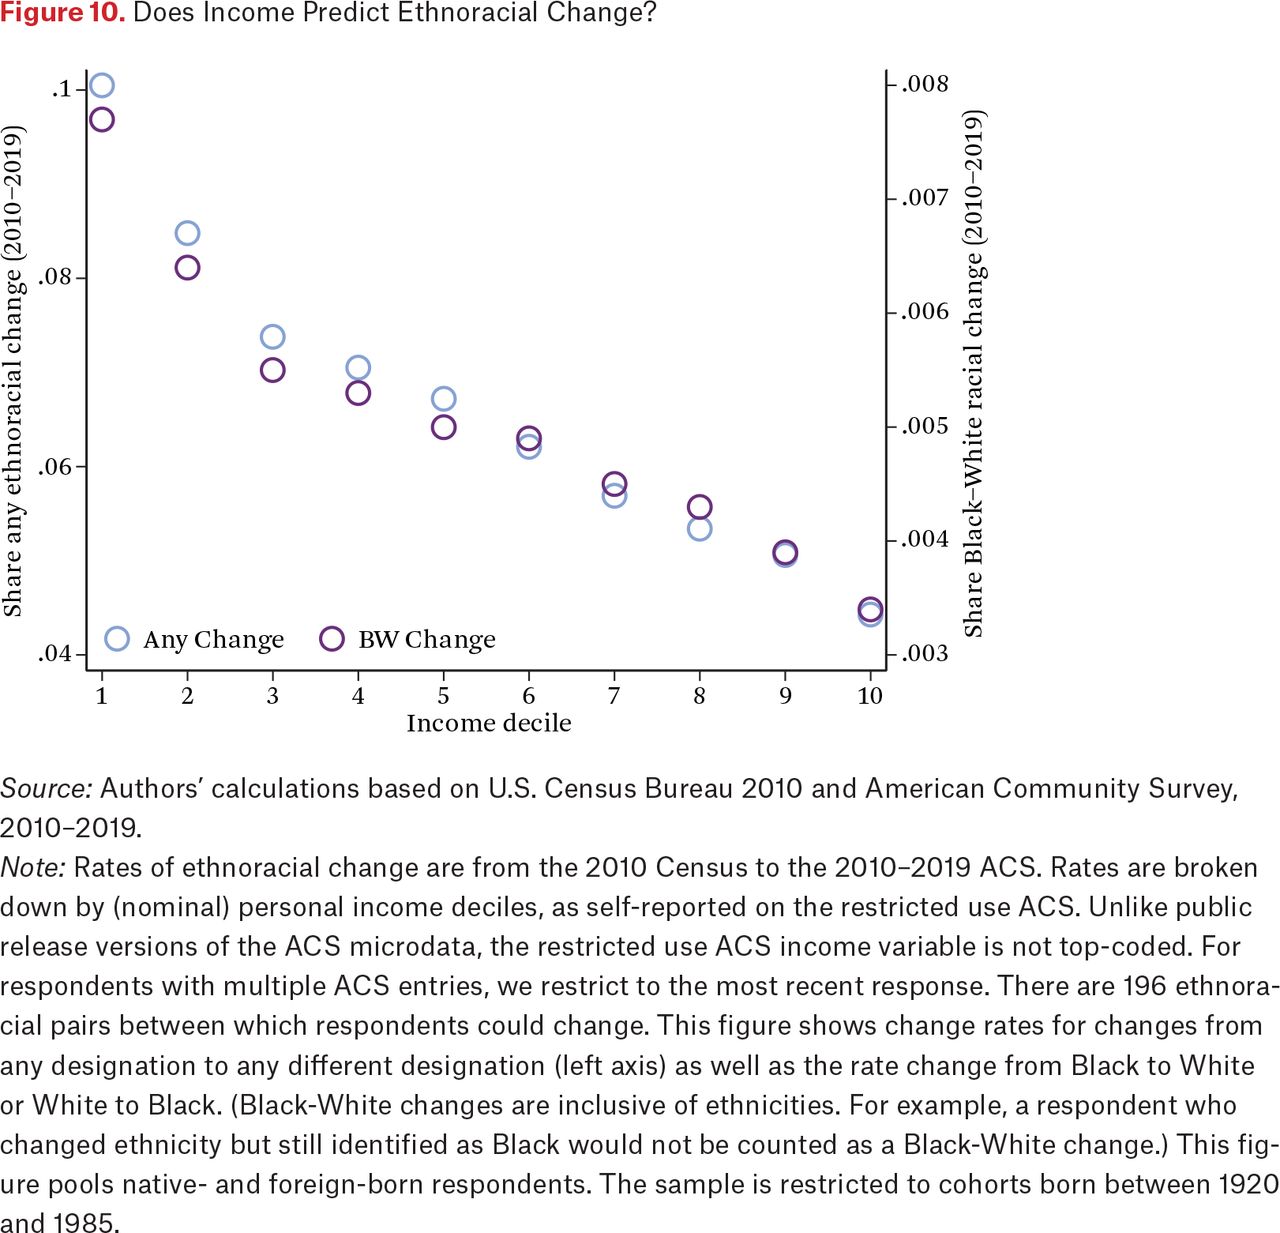
- Figure 10.
Does Income Predict Ethnoracial Change?
Source: Authors’ calculations based on U.S. Census Bureau 2010 and American Community Survey, 2010–2019.
Note: Rates of ethnoracial change are from the 2010 Census to the 2010–2019 ACS. Rates are broken down by (nominal) personal income deciles, as self-reported on the restricted use ACS. Unlike public release versions of the ACS microdata, the restricted use ACS income variable is not top-coded. For respondents with multiple ACS entries, we restrict to the most recent response. There are 196 ethnoracial pairs between which respondents could change. This figure shows change rates for changes from any designation to any different designation (left axis) as well as the rate change from Black to White or White to Black. (Black-White changes are inclusive of ethnicities. For example, a respondent who changed ethnicity but still identified as Black would not be counted as a Black-White change.) This figure pools native- and foreign-born respondents. The sample is restricted to cohorts born between 1920 and 1985.
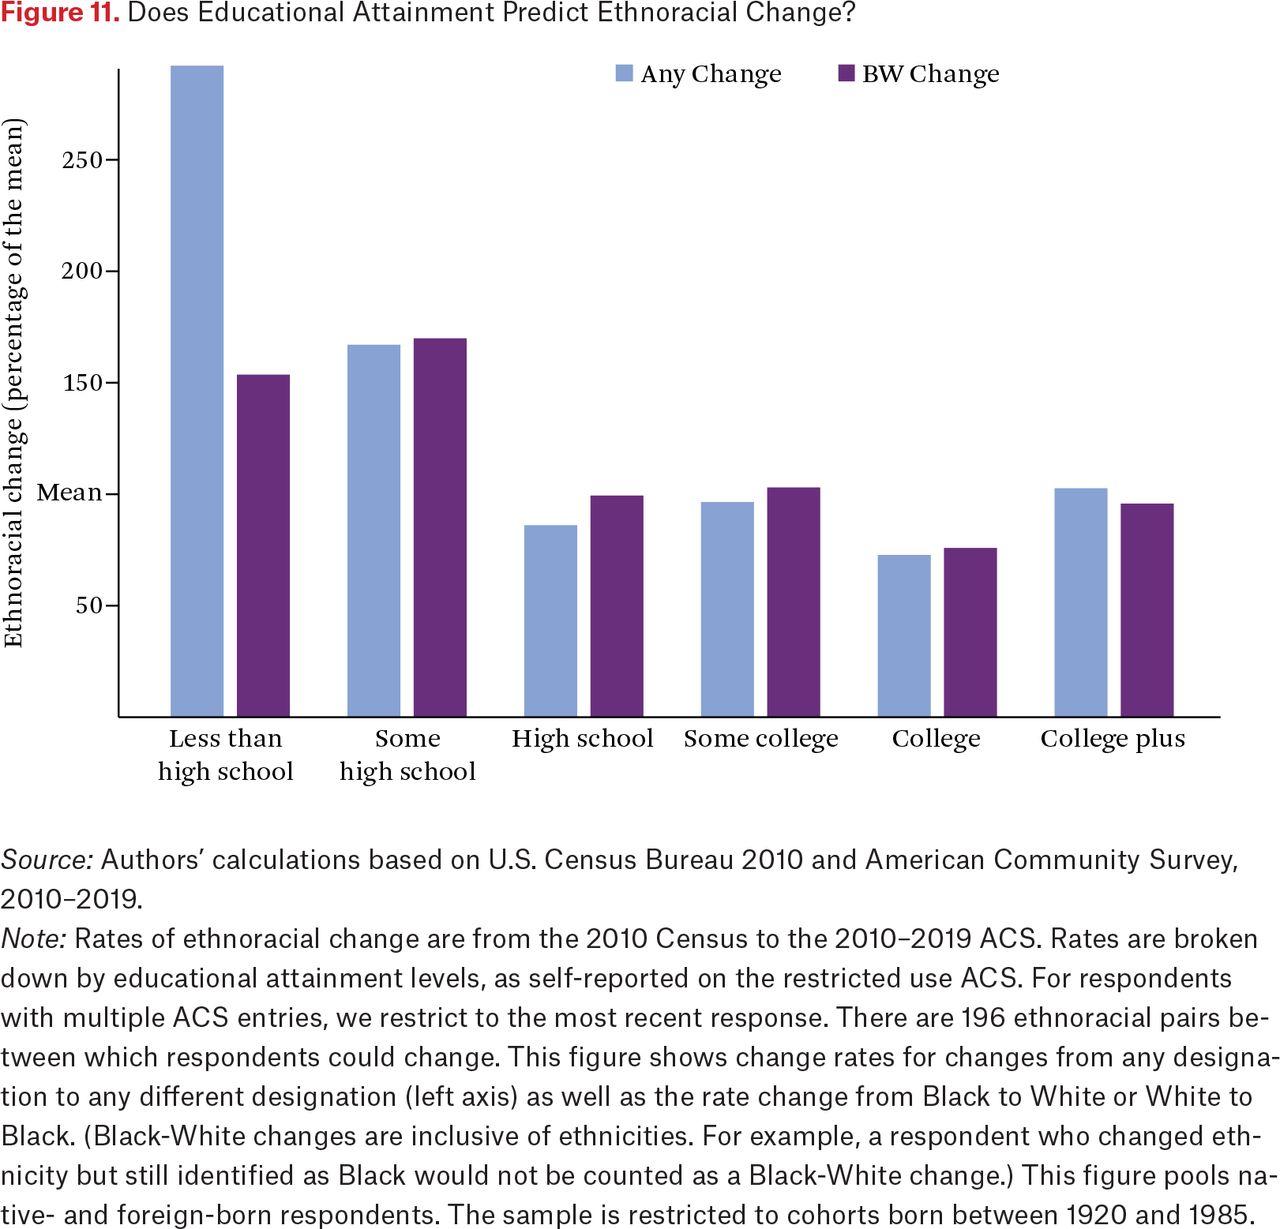
- Figure 11.
Does Educational Attainment Predict Ethnoracial Change?
Source: Authors’ calculations based on U.S. Census Bureau 2010 and American Community Survey, 2010–2019.
Note: Rates of ethnoracial change are from the 2010 Census to the 2010–2019 ACS. Rates are broken down by educational attainment levels, as self-reported on the restricted use ACS. For respondents with multiple ACS entries, we restrict to the most recent response. There are 196 ethnoracial pairs between which respondents could change. This figure shows change rates for changes from any designation to any different designation (left axis) as well as the rate change from Black to White or White to Black. (Black-White changes are inclusive of ethnicities. For example, a respondent who changed ethnicity but still identified as Black would not be counted as a Black-White change.) This figure pools native- and foreign-born respondents. The sample is restricted to cohorts born between 1920 and 1985.
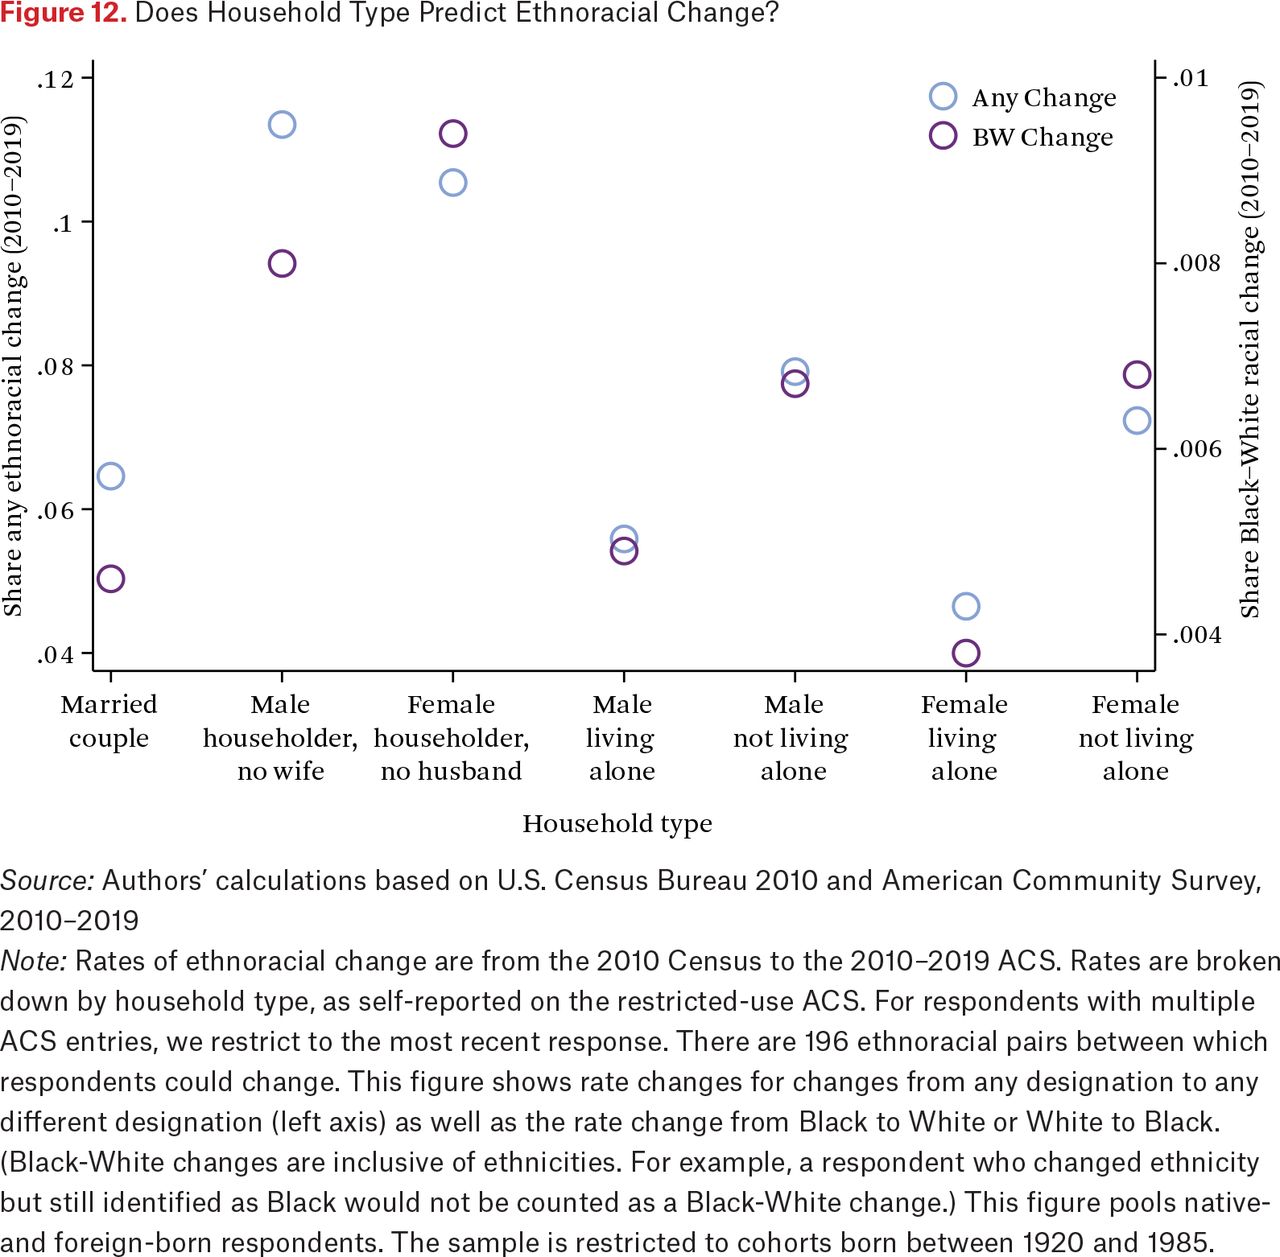
- Figure 12.
Does Household Type Predict Ethnoracial Change?
Source: Authors’ calculations based on U.S. Census Bureau 2010 and American Community Survey, 2010–2019
Note: Rates of ethnoracial change are from the 2010 Census to the 2010–2019 ACS. Rates are broken down by household type, as self-reported on the restricted-use ACS. For respondents with multiple ACS entries, we restrict to the most recent response. There are 196 ethnoracial pairs between which respondents could change. This figure shows rate changes for changes from any designation to any different designation (left axis) as well as the rate change from Black to White or White to Black. (Black-White changes are inclusive of ethnicities. For example, a respondent who changed ethnicity but still identified as Black would not be counted as a Black-White change.) This figure pools native- and foreign-born respondents. The sample is restricted to cohorts born between 1920 and 1985.


Additional Files
Appendix
Appendix
Files in this Data Supplement:
- Adobe PDF - Anders_Online_Appendix.pdf - Appendix
In this issue


Jump to section
Related Articles
Cited By...
- No citing articles found.