Abstract
We link the 2010 Census microdata to the 2010–2020 American Community Surveys and Social Security Administration records to test patterns of ethnoracial identification change across this decade. After documenting substantial ethnoracial stability in some categories, we find substantial flows between many racial categories, more movement into Hispanic identification than movement out of the Hispanic category, foreign-born Hispanic multiracial respondents are 14 percentage points (40 percent) more likely to identify later as Hispanic White than their native-born counterparts, and foreign-born non-Hispanic multiracial respondents are 19 percentage points (90 percent) less likely to identify later as non-Hispanic White than native-born. Higher income and education are both associated with less racial identification change. Change also varies by household type.
- administrative data
- linked data
- ethnoracial fluidity
- racial change
- immigrant identity
To understand contemporary demographic change, it is crucial to understand how the ethnoracial identifications of adults have changed in the 2010s, especially among groups where we might expect a high rate of fluidity in identification, such as immigrants to the United States. The 2010s were a time of significant demographic change, with a large growth in the multiracial population from 2010 to 2020 and increasing ethnoracial diversity through immigration from Latin America and Asia (Jones et al. 2021). Demographic models often assume the ethnoracial identifications of individuals in each of these categories are stable across the life course and across different types of data collections (surveys, censuses, administrative data, and so on). In reality, changes in racial identification vary significantly across racial groups, across places, and over time (Liebler et al. 2017). These changes are not always evident when we look at cross-sectional data, because racial change does not occur in only one direction. People move both into and out of categories, which can create the illusion of stability in the overall size of the category when actually change is considerable in who selects the category (Liebler et al. 2017). These changes may vary by geography (Pickett, Saperstein, and Penner 2019) and birth cohort in important ways as well, making the impact of ethnoracial fluidity uneven across the United States. If ethnoracial self-identification varies by where and when a person is born, longitudinal data that tracks an individual from birth into adulthood is crucial to documenting this source of variation. These changes in racial and ethnic identification could have important implications for ethnoracial inequality if, for example, the changes are patterned by consequential differences such as immigrant generation.
ETHNORACIAL CHANGE WITHIN A LIFETIME: LITERATURE REVIEW
How ethnoracial fluidity has changed over time and its consequences for immigrants and the native born have been argued many times. Even in the nineteenth century, movement into and out of ethnoracial categories was noteworthy, often associated with changes in socioeconomic status (Saperstein and Gullickson 2013). Despite rhetoric that racial categories (especially White and Black) have been uniquely rigid in the United States, evidence indicates that even in this context “money whitens” (Saperstein and Gullickson 2013; Vargas 2015). How the rigidity of the Black category compares with the Hispanic and Asian categories, and how that rigidity has shifted over time, remains a subject of considerable interest and argument today (Alba 2020; Lee and Bean 2012). Knowing the magnitude of ethnoracial change for immigrant and native-born populations, and how that compares across ethnoracial groups, is key to understanding how immigrants are incorporated into the United States today. Examining contemporary racial fluidity for immigrants provides an important window into the current context of reception and integration, through measurable effects on ethnoracial self-categorization choices (Duncan and Trejo 2018).
Recent work with linked census data shows pronounced response changes between 2000 and 2010. Carolyn Liebler and her colleagues (2017) find that multiracial, Hispanic, American Indian and Alaskan Native, and Pacific Islander respondents all demonstrated high rates of change across census years. Children and those who lived in the West (where intermarriage and multiracial identification are also more common) were more likely to change identification (Liebler et al. 2017). The authors were limited, however, to the variables available in the census and to two points in time (2000 and 2010), so they were not able to investigate the more contemporary geographic, socioeconomic, and immigration-specific patterns we test here. We expand their study into the 2010s, and test the relationship between racial fluidity and nativity, place and year of birth, and socioeconomic characteristics such as educational attainment.
Studies using other data sources have also found considerable fluidity in identification over the life course and have tested local and generational variation in these patterns. A comparison of four different data sources reveals that racial change with linked survey data ranged from 5 to 12 percent of respondents (Agadjanian 2022). Work with the National Longitudinal Survey of Youth, for example, shows that fluidity is more common in the Southwest (New Mexico, Arizona, California) and in the upper Midwest (Ohio, Michigan) and in counties with greater poverty, unemployment, and diversity (Pickett, Saperstein, and Penner 2019). Fluidity is also common among adolescents who identify with multiple racial groups (Doyle and Kao 2007). The National Longitudinal Study of Adolescent to Adult Health shows that the patterns of ethnoracial change are shaped by skin tone, and that ethnoracial stability is more common for adolescents with highly educated mothers (Doyle and Kao 2007). Latinx young adults change ethnoracial identification in patterns that also reflect the tight connection between skin tone and others’ perceptions of racial categories (Irizarry, Monk, and Cobb 2023). Work with linked Social Security data shows that fluidity occurs even in data collections late in life (Breen 2023), with more fluidity into the non-Hispanic White category for those who had higher socioeconomic status in young adulthood.
Many of the groundbreaking studies that have been able to examine ethnoracial identification change during an individual’s lifespan have either been limited to relatively small samples, because of the comparative rarity of the event (Saperstein and Penner 2012), or to relatively short time spans, because of the limited availability of linked data (Liebler et al. 2017). To test questions about ethnoracial identification change across birth cohorts and into the 2010s, this project brings together additional data: very large samples of millions of respondents, and geographic data for sample members from a range of administrative data sources.
MEASUREMENT OF ETHNICITY AND RACE
Every decennial census in U.S. history has measured ethnoracial categories differently than the decade before (Fischer and Hout 2006), and many categories have been added or removed from the federal ethnoracial options as ideas about salient racial and ethnic categories have changed (Davenport 2020). Since the Office of Management and Budget issued revised standards for the federal collection of ethnic and racial data in 1997, analysis of the implications of these standards has been extensive. Indeed, the 2000 Census was the first to allow self-selection of more than one racial category, though not the first to include a multiracial group, because earlier censuses had included enumerator-assigned multiracial categories (Farley 2002). It was immediately apparent that these changes to the data collection standards had important implications for population projections and our understanding of demographic change. For example, since 2000, many studies have asked how intermarriage, immigration, and uncertainties about the identification choices of future generations might change our estimates of population size (Edmonston, Lee, and Passel 2002; Lee and Bean 2012; Perlmann 2002; Waters 2000).
Immigration has a profound relationship with how people think about and express ethnoracial identities. Many immigrants find that the U.S. federal ethnoracial categories do not match their self-understanding (Rodriguez 2000). Thus the amount of time spent in the United States, degree of cultural incorporation, and number of generations in the United States are often important predictors of ethnoracial identification, as more exposure to U.S. norms changes respondents’ ideas about race and racial categories (Newby and Dowling 2007; Feliciano and Rumbaut 2018; Rodriguez 2000; Davenport 2020). If immigrants with higher socioeconomic standing and more social integration are more likely to adopt the standard federal racial categories, especially Whiteness (Duncan and Trejo 2011), then these intergenerational and intragenerational identification shifts will obscure the actual socioeconomic mobility of the group by creating selectivity in the decision to exit the group. Past European immigrant groups followed a pattern like this, with White ethnic groups becoming virtually indistinguishable from each other over time on many socioeconomic indicators (Lieberson and Waters 1990), but debates about whether current immigrant groups from Latin America and Asia have access to the same opportunities are ongoing (Alba 2020).
The largest immigrant groups to the United States also have high rates of intermarriage relative to White and African American adults, though lower than American Indian adults (Lee and Bean 2012). This historical pattern creates another important context for understanding contemporary fluidity; more than one-quarter of newly married Asian Americans and Hispanics were married to someone with a different ethnoracial identification (Bialik 2017). This means that, for many immigrant groups, the projections for the group size depend heavily on whether and how children from interracial relationships are ethnoracially identified (Edmonston, Lee, and Passel 2002).
RESEARCH QUESTIONS
Our longitudinally linked data allow us to investigate ethnoracial identification over time and to test two questions: How many individuals change ethnoracial identification? Specifically, how many of the individuals captured in American Community Surveys (ACS) in the 2010s identified with a different ethnoracial category in the 2010 Census? Does the rate of change of ethnoracial identification vary by birth-year cohort, nativity of birth, place of birth if born in the United States, socioeconomic characteristics, or household type?
The need for work that can use longitudinally linked data to rigorously test key questions such as whether immigrants from different parts of the world are more likely to identify as White, as multiracial, or as single-race people of color is critical (Alba 2020; Duncan and Trejo 2011). That question is central to future population projections and work on demographic change in the United States. It is essential that we have high-quality evidence on this question because if the category of White is expanding to include more children of immigrants and multiracial respondents over time, that would change predictions such as the coming majority-minority status of the United States, and estimates of ethnoracial inequality, for example.
Data and Methods
We use the Federal Statistical Research Data Center system to link the 2010 Census to the 2010–2020 American Community Surveys and the Numident (the Social Security Administration’s numeric identification system) using individual protected identification keys, or PIKs (for more on the system, see U.S. Census Bureau 2023). PIKs are linked to individual observations by the U.S. Census Bureau using the Person Identification Validation System (PVS), which uses probabilistic matching to assign a unique Census Bureau identifier for each person (Wagner and Layne 2014).1 Individuals who do not have a Social Security number and those whose personal information was too ambiguous or incomplete do not receive a PIK (Liebler et al. 2017). Once a PIK is assigned in each separate data set, it can be used to link individuals in one census or survey to their response in another census or survey.
We develop a sample from respondents born between 1920 and 1985 who have valid Social Security numbers (who therefore appear in the Numident), who completed one (or more) American Community Surveys, who completed the 2010 Census, and who have a non-missing place of birth. Our sample includes (at least) two observations of adult residential location as well as adult racial and ethnic identification (Taylor, Stuart, and Bailey 2016).2 We restrict the sample to birth cohorts born between 1920 and 1985, so that respondents are at least twenty-five years old at the 2010 Census. This leaves us with a sample of about 22.9 million respondents with a 2010 Census response linked to a 2010–2019 ACS response. We report the sample of respondents with a 2020 ACS response linked to their 2010 Census response separately because of significant changes in the ethnoracial identification questions on the 2020 ACS (for the ethnoracial questions from each data source, see figure A.6).3
For this article, we begin with a careful and detailed descriptive analysis of racial and ethnic identification changes for respondents who completed multiple data collections in the 2010s. We focus special attention on immigrants and the native born. We use these linkages to examine ethnoracial changes during the last decade and to assess the fluidity of racial and ethnic identification across birth decades and geography.
Variable Construction
For our key variable, ethnoracial identification, we create a variable in each dataset (Census and ACS) that combines Hispanic and racial responses into a single set of mutually exclusive categories (non-Hispanic White, Black, American Indian, Asian American, Native Hawaiian/Pacific Islander, multiracial, and Some Other Race; Hispanic White, Black, American Indian, Asian American, Native Hawaiian/Pacific Islander, multiracial and Some Other Race). We use only the unedited responses that respondents entered in the form, dropping all respondents with missing information on these key questions. For respondents who completed more than one ACS survey between 2010 and 2020, we use their most recent ACS response. It is important that for these initial analyses, all multiracial respondents are grouped together into a single ethnoracial category (non-Hispanic multiracial or Hispanic multiracial). One important implication is that people who change from one multiracial identification to another (for example, from Black-White to Asian–American Indian) would not be captured by our measure of ethnoracial change. These changes will be explored in a future article.
We also create a variable separating respondents into mutually exclusive categories based on place of birth (native born and foreign born) using the ACS. We gather year and county of birth data from the Numident, providing birth cohort and birthplace data, and we gather place of residence from the respondent’s most recent ACS response.
Finally, the 2010–2019 ACS ethnoracial data are not entirely comparable with the 2020 ACS ethnoracial data. The 2020 ACS included many new write-in boxes (like the 2020 Census), and because the coding of those write-in categories created the opportunity to code the new category of Middle Eastern and North Africa (MENA), more opportunities for ethnoracial fluidity were introduced in the 2020 ACS because of the difference in the survey item structure. Including respondents in the 2020 ACS with respondents in the 2010–2019 ACSs for comparison to respondents in the 2010 Census was problematic. Therefore, we separated the 2020 ACS respondents from the 2010–2019 ACS respondents and linked them to their 2010 Census responses and Numident data in an independent sample to examine changes in their ethnoracial identification that could include MENA. Thus, the analyses below include tests of fluidity for 2010–2019 ACS respondents linked to the 2010 Decennial Census, and then a separate analysis of 2020 ACS linked to 2010 Decennial Census responses in order to examine the impact of adding a MENA category to the response options.
Results
The following analyses include tests of fluidity for 2010–2019 ACS respondents linked to the 2010 Census, and then a separate analysis of 2020 ACS linked to 2010 Census responses in order to examine the impact of adding a MENA category to the response options.
How Many Individuals Change Ethnoracial Identification?
The nature of surveying and data collection could influence ethnoracial response changes. Questionnaire design itself might cause changes in ethnoracial responses (Campbell and Rogalin 2006; Snipp 2003; Waters 2000) and differences may arise depending on who fills out the forms (Campbell 2007; Porter, Liebler, and Noon 2016). We find evidence that filling out a census form and filling out an ACS form prompt different responses. Comparing the responses of people who filled out a 2010 ACS form with those from their 2010 Census form shows ethnoracial change too; the change is not limited to only those who filled out later forms (2011–2019). Because we see ethnoracial change even in a less than one-year time span, this suggests that a meaningful proportion of the fluidity we find across data collections is about the meaning of those survey instruments to the respondents. It is important, then, that we think about our results in terms of racial and ethnic identification fluidity, which can occur across contexts even at one point in time, rather than simply as a permanent change in ethnoracial identification, which implies a temporal process with finality.
Given previous work (Liebler et al. 2016, 2017), we expect to observe the highest rates of fluidity among respondents who identify as American Indian, Alaska Native, Native Hawaiian, Other Pacific Islander, in a multiple-race response group, or Hispanic. We also expect switching race within ethnicity to be more common for foreign-born than native-born persons as people are integrated into the U.S. racial system and learn new racialized schema (Campbell 2020; Roth 2012). Matching expectations, we find native-born respondents have a lower probability of changing their ethnoracial response than foreign-born respondents, which varies by the area of residence. Also consistent with expectations, we find the rate of ethnoracial change, as well as group-specific rates of change, is meaningfully different for later birth cohorts.
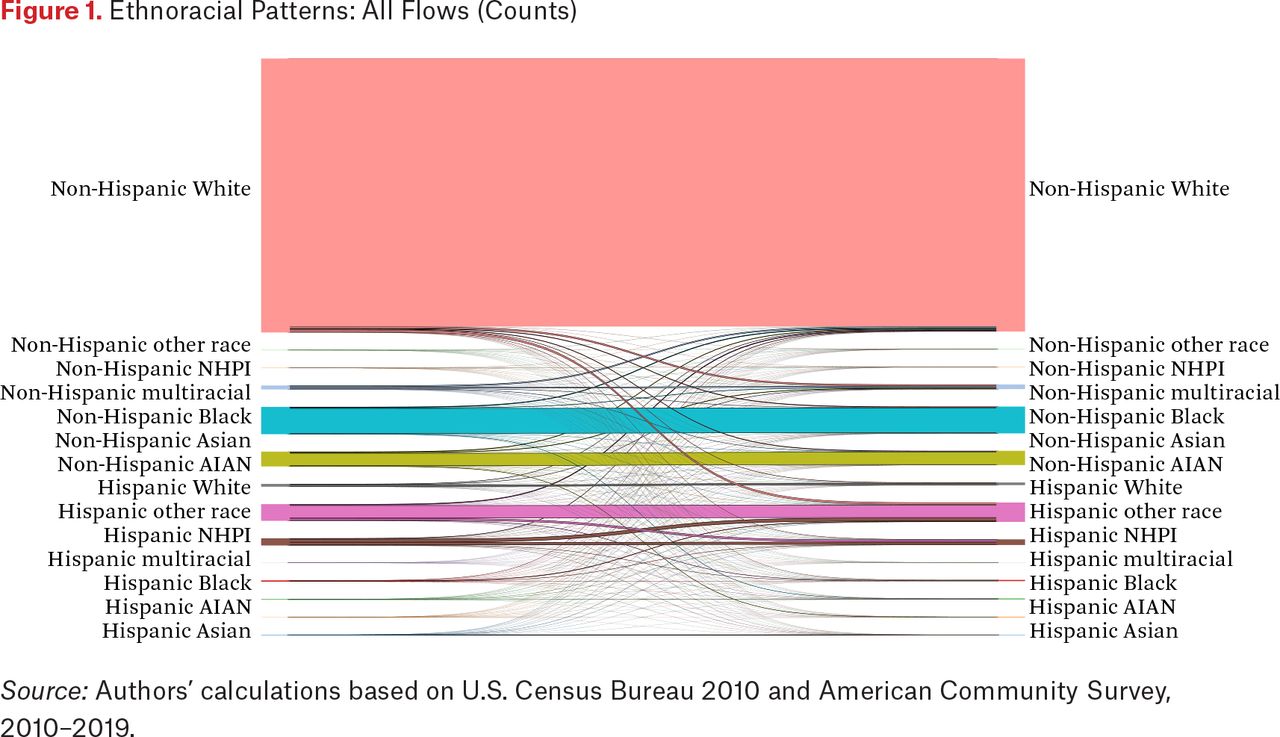
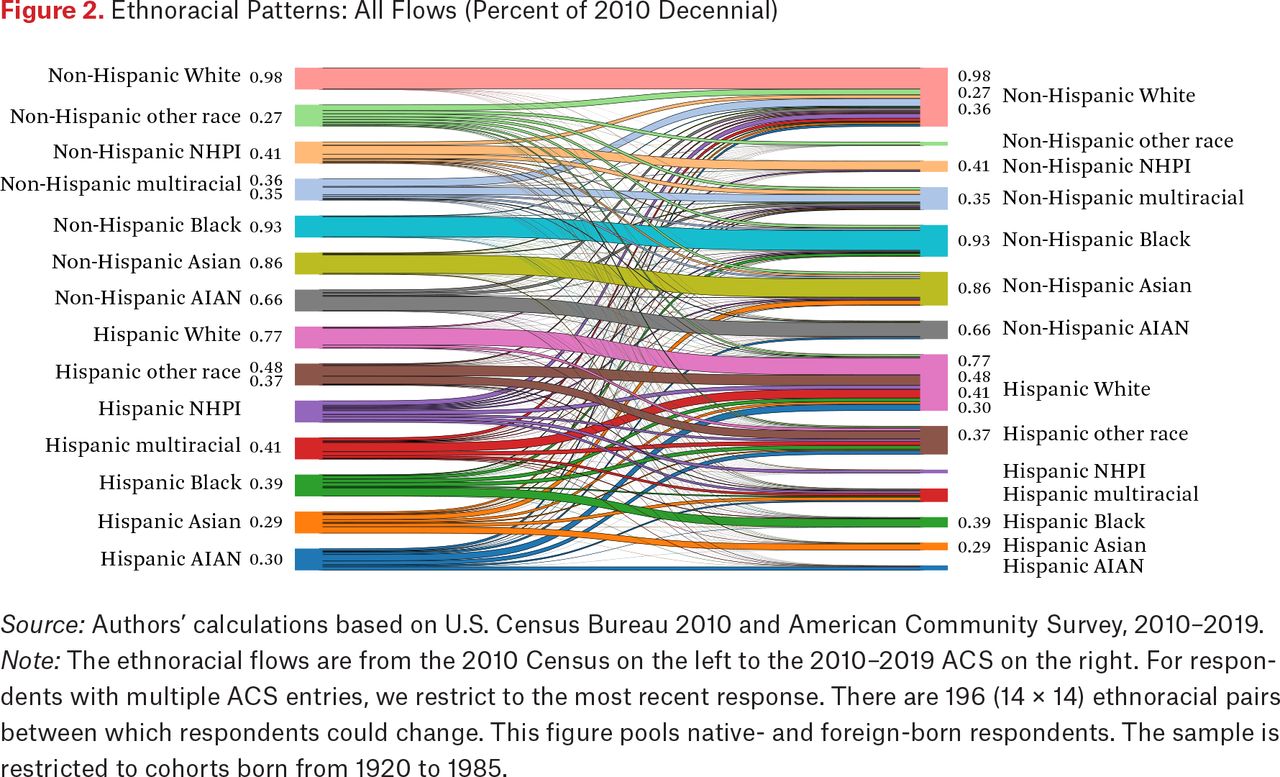
We display our main results in sankey or flow diagrams. After coding each ethnic and racial combination for the 2010 Census and the (most recent) 2010–2019 ACS, we have a 14 × 14 matrix of ethnoracial pairs between which identity changes for each respondent can occur. We find an overall fluidity (response change) rate of 6.9 percent, relative to 6.1 percent reported by Liebler and her colleagues (2017) between 2000 and 2010.4 Figures 1 and 2 show that overall, stability in ethnoracial identity is substantial: more than 98 percent of the 17.5 million respondents who identified as non-Hispanic White in the 2010 Census also identified as non-Hispanic White in the (latest) 2010–2019 ACS. Similarly, 93 percent of the 1.6 million respondents who identified as non-Hispanic Black in the 2010 Census also identified as non-Hispanic Black in the (latest) 2010–2019 ACS.


Ethnoracial Patterns: All Flows (Percent of 2010 Decennial)
Source: Authors’ calculations based on U.S. Census Bureau 2010 and American Community Survey, 2010–2019.
Note: The ethnoracial flows are from the 2010 Census on the left to the 2010–2019 ACS on the right. For respondents with multiple ACS entries, we restrict to the most recent response. There are 196 (14 × 14) ethnoracial pairs between which respondents could change. This figure pools native- and foreign-born respondents. The sample is restricted to cohorts born from 1920 to 1985.
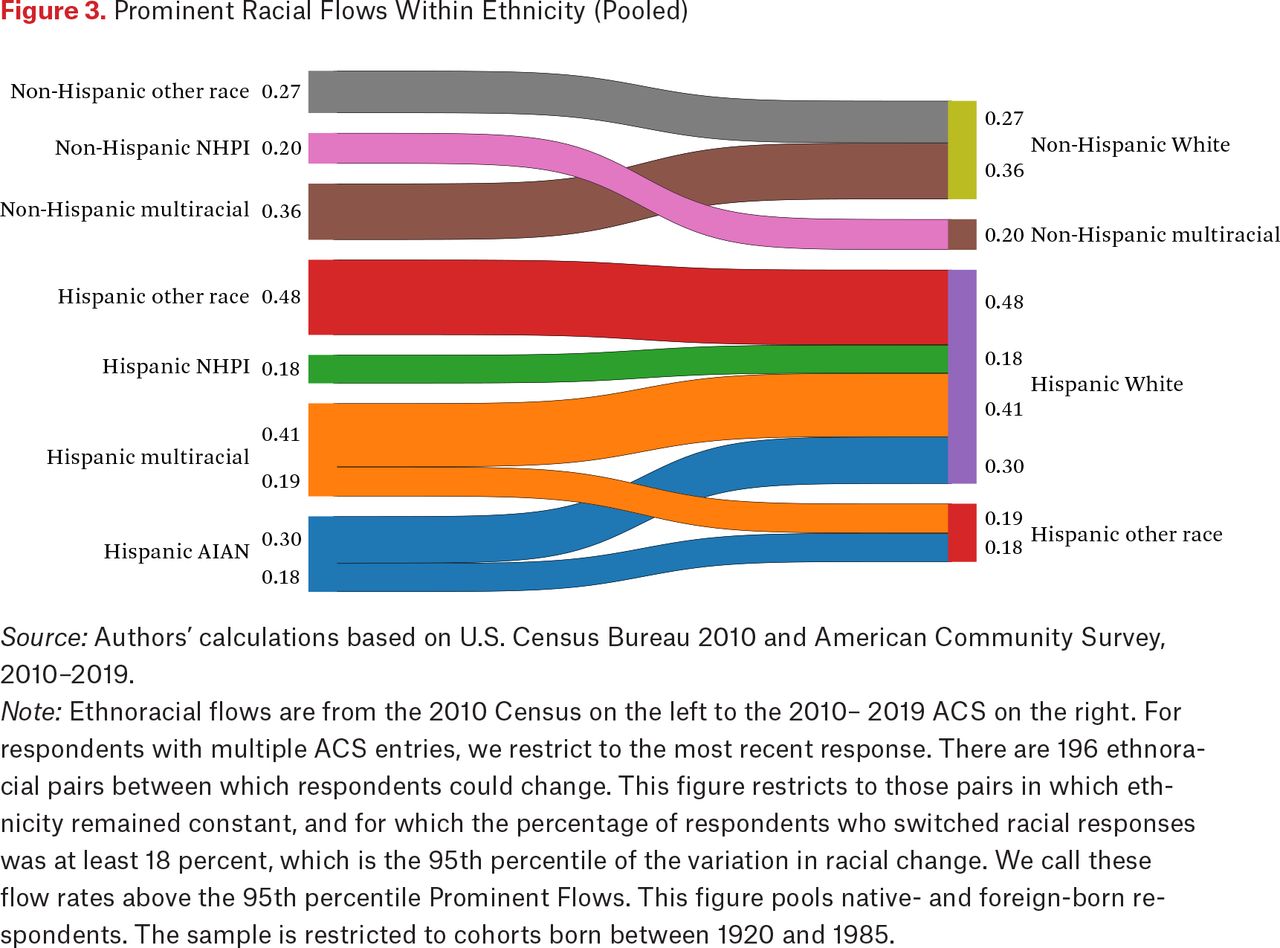
For visual ease, in the following figures we focus on the changes between identification for specific transition pairs. Figure 3 shows flows for the most dominant transition pairs, pooling respondents across native- and foreign-born status.

Prominent Racial Flows Within Ethnicity (Pooled)
Source: Authors’ calculations based on U.S. Census Bureau 2010 and American Community Survey, 2010–2019.
Note: Ethnoracial flows are from the 2010 Census on the left to the 2010– 2019 ACS on the right. For respondents with multiple ACS entries, we restrict to the most recent response. There are 196 ethnoracial pairs between which respondents could change. This figure restricts to those pairs in which ethnicity remained constant, and for which the percentage of respondents who switched racial responses was at least 18 percent, which is the 95th percentile of the variation in racial change. We call these flow rates above the 95th percentile Prominent Flows. This figure pools native- and foreign-born respondents. The sample is restricted to cohorts born between 1920 and 1985.
The figure shows prominent flows between racial groups when the respondent’s response to the Hispanic ethnicity question remains consistent. For example, 41 percent of Hispanic multiracial respondents in the 2010 Census identified as Hispanic White in a later ACS, whereas 19 percent identified as Hispanic Other Race. We find prominent flows out of multiracial and Other Race, but also from American Indian and Alaska Native and Native Hawaiian and Other Pacific Islander. We discuss these prominent flows by nativity status.
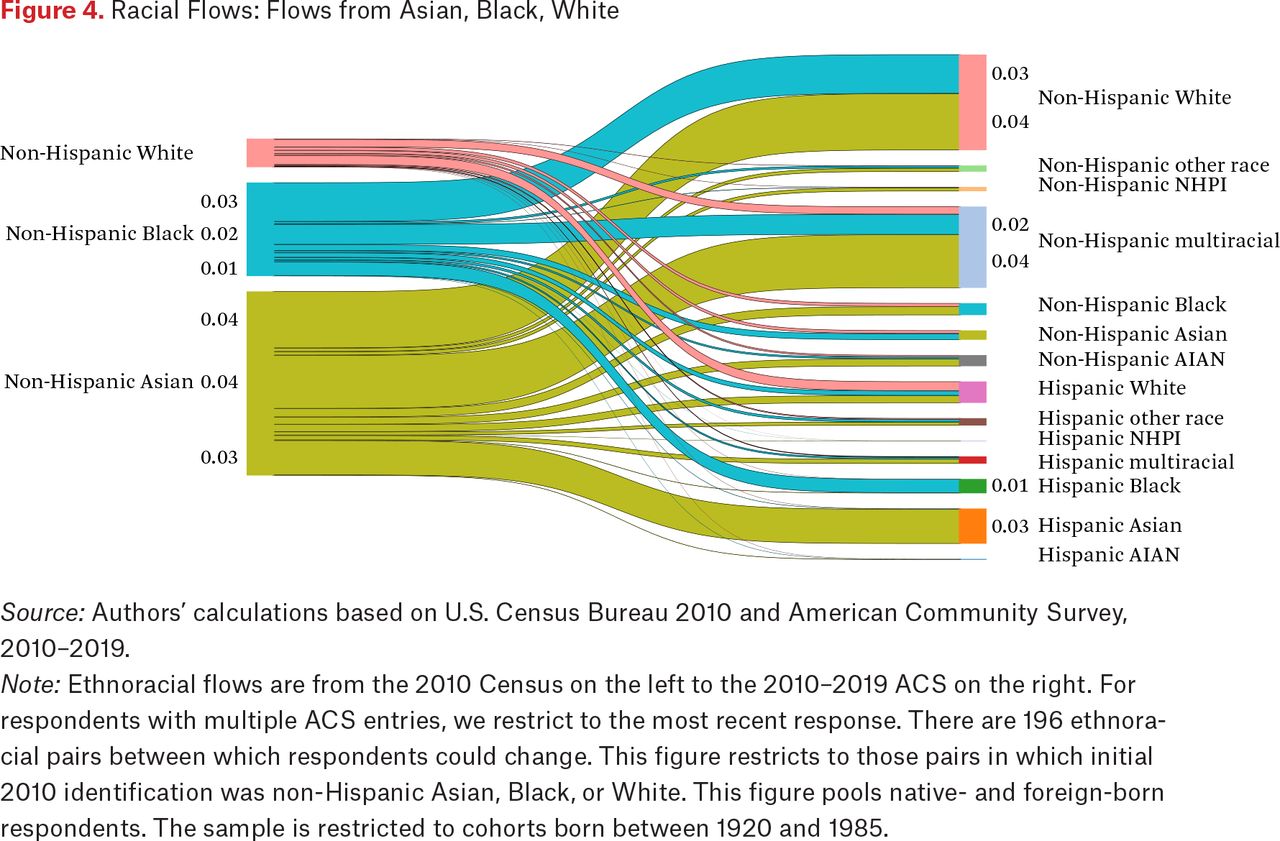
Figures 4 and 5 highlight two stylized facts about ethnoracial flows: flows between groups are substantial even when we exclude the heterogeneous multiracial and Other Race categories in the base year (figure 4), and movement into Hispanic in the ACS is greater than movement out in the ACS (figure 5). Figure 4 shows that although fewer than 1 percent of non-Hispanic White respondents identified as a different category in a later ACS, 4 percent of non-Hispanic Asian respondents identified as non-Hispanic White, 4 percent as non-Hispanic multiracial, and 3 percent as Hispanic Asian, for a total of approximately 14 percent moving out of the non-Hispanic Asian category. Comparatively, Liebler and colleagues (2017), who consider changes from the 2000 to the 2010 Census, found less than half that rate of change, documenting that 4.7 percent of people identifying as non-Hispanic Asian in the 2000 Census left the category in the 2010 Census. Last, we find 3 percent of non-Hispanic Black respondents identified as non-Hispanic White, and a total of approximately 7 percent moved out of the non-Hispanic Black category. This result is also about twice the rate found in Liebler and colleagues (2017), which documents that 3 percent of non-Hispanic Black respondents left the category between the 2000 and the 2010 Census.

Racial Flows: Flows from Asian, Black, White
Source: Authors’ calculations based on U.S. Census Bureau 2010 and American Community Survey, 2010–2019.
Note: Ethnoracial flows are from the 2010 Census on the left to the 2010–2019 ACS on the right. For respondents with multiple ACS entries, we restrict to the most recent response. There are 196 ethnoracial pairs between which respondents could change. This figure restricts to those pairs in which initial 2010 identification was non-Hispanic Asian, Black, or White. This figure pools native- and foreign-born respondents. The sample is restricted to cohorts born between 1920 and 1985.

Ethnic Flows
Source: Authors’ calculations based on U.S. Census Bureau 2010 and American Community Survey, 2010–2019.
Note: Ethnoracial flows are from the 2010 Census on the left to the 2010–2019 ACS on the right. For respondents with multiple ACS entries, we restrict to the most recent response. There are 196 ethnoracial pairs between which respondents could change. This figure restricts to those pairs in which initial 2010 identification was non-Hispanic, but later identification was non-Hispanic. This figure pools native and foreign-born respondents. The sample is restricted to cohorts born between 1920 and 1985.
Our main results displaying prominent ethnoracial flows exhibit noteworthy differences across nativity status. Figures 6 and 7 repeat figure 3, but are restricted to either native-born or foreign-born respondents. Figure 6 shows prominent flows for native-born respondents: 35 percent of native-born Hispanic multiracial respondents in the 2010 Census identified as Hispanic White in a later ACS (versus 41 percent in the pooled sample); 40 percent of native-born non-Hispanic multiracial respondents in the 2010 Census identified as non-Hispanic White in a later ACS (versus 36 percent in the pooled sample).

Prominent Racial Flows, Within Ethnicity (Native-Born)
Source: Authors’ calculations based on U.S. Census Bureau 2010 and American Community Survey, 2010–2019.
Note: Ethnoracial flows are from the 2010 Census on the left to the 2010–2019 ACS on the right. For respondents with multiple ACS entries, we restrict to the most recent response. There are 196 ethnoracial pairs between which respondents could change. This figure restricts to those pairs in which ethnicity remained constant, and for which the percentage of respondents who switched racial responses was at least 18 percent, which is the 95th percentile of the variation in racial change. We call these flow rates above the 95th percentile “Prominent Flows.” This figure pools native- and foreign-born respondents. The sample is restricted to cohorts born between 1920 and 1985. This figure differs from figure 3 in that it is further restricted to native-born U.S. respondents.

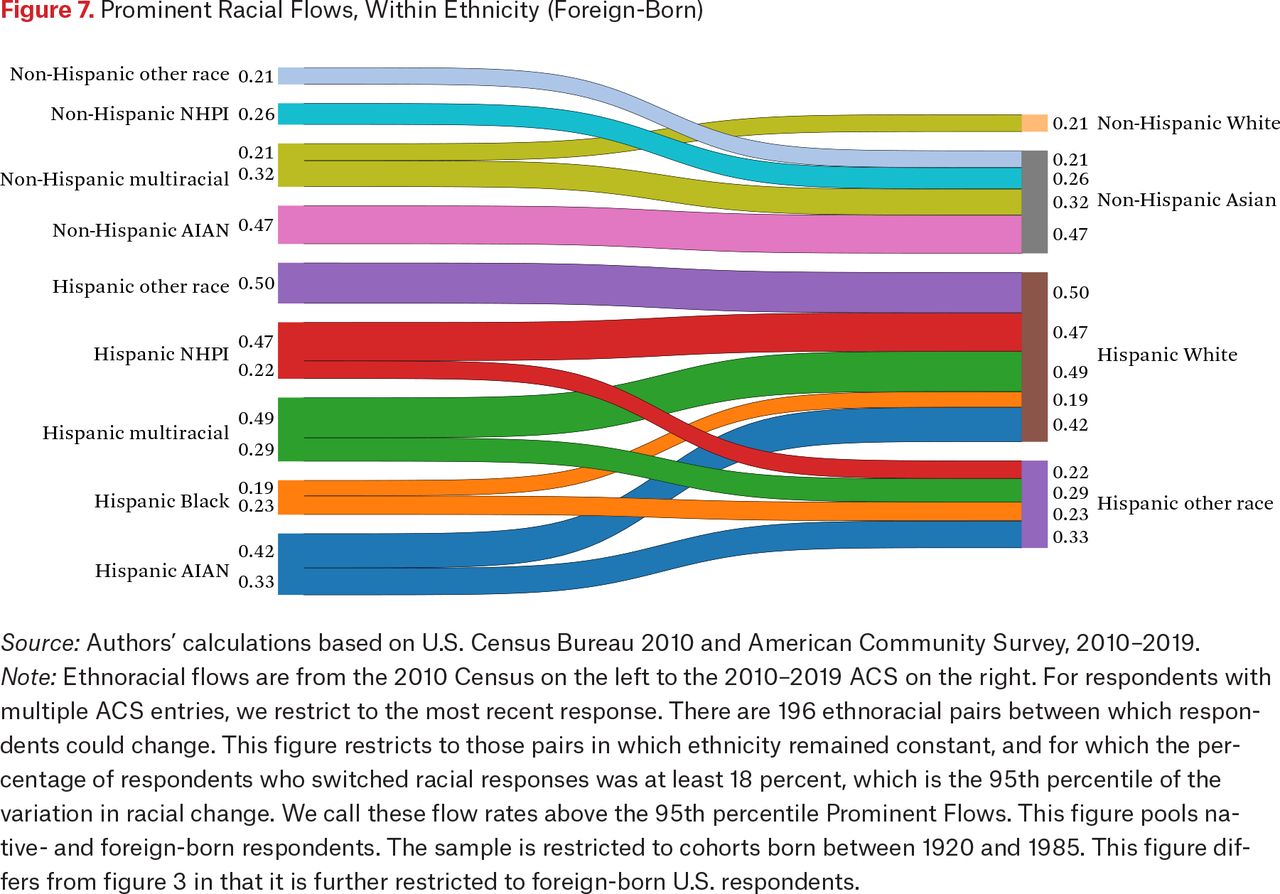
Prominent Racial Flows, Within Ethnicity (Foreign-Born)
Source: Authors’ calculations based on U.S. Census Bureau 2010 and American Community Survey, 2010–2019.
Note: Ethnoracial flows are from the 2010 Census on the left to the 2010–2019 ACS on the right. For respondents with multiple ACS entries, we restrict to the most recent response. There are 196 ethnoracial pairs between which respondents could change. This figure restricts to those pairs in which ethnicity remained constant, and for which the percentage of respondents who switched racial responses was at least 18 percent, which is the 95th percentile of the variation in racial change. We call these flow rates above the 95th percentile Prominent Flows. This figure pools native- and foreign-born respondents. The sample is restricted to cohorts born between 1920 and 1985. This figure differs from figure 3 in that it is further restricted to foreign-born U.S. respondents.
Figure 7 also shows results for prominent flows but is restricted to foreign-born respondents: 49 percent of foreign-born Hispanic multiracial respondents in the 2010 Census identified as Hispanic White in a later ACS (versus 35 percent in the native-born sample and 41 percent in the pooled sample); 21 percent of foreign-born non-Hispanic multiracial respondents in the 2010 Census identified as non-Hispanic White in a later ACS (versus 40 percent in the native-born sample and 36 percent in the pooled sample).
Figures A.1 through A.5 in the online appendix include more detail on the fluidity for individuals who identified with multiple racial categories or as Other Race. Table A.1 includes the full tabular list of identification changes. As expected, these groups experience high rates of fluidity, and are identified in the ACS with a wide range of categories. The most common response is to have stable ethnic identification (Hispanic or not), but changes in racial identification for these categories are very common. Future work will explore these changes by examining specific multiracial groups and their fluidity.
Overall, the results for native-born individuals differ from those for foreign-born individuals in several important respects.5 First, Hispanic multiracial respondents are 14 percentage points (40 percent) more likely to identify later as Hispanic White if they are foreign born than if they are native born. Second, non-Hispanic multiracial respondents are 19 percentage points (90 percent) less likely to identify later as non-Hispanic White if they are foreign born than if they are native born. Because the results differ based on native- and foreign-born status, we investigate whether place and decade of birth more broadly have an impact on ethnoracial fluidity. We discuss these results in the next section.
Complications Specific to the 2020 ACS
Survey format changes made to the 2020 ACS introduce certain complications which we avoided in our main analysis by restricting to the 2010–2019 ACS. Here we report results that address two distinct complications: the introduction of the Middle Eastern or North African category and changes to how Hispanic ethnicity was used to determine multiracial status.
MENA
We matched the 2020 ACS to the 2010 Census, and have produced results showing fluidity across this decade, including movement into this newly created category, MENA. In earlier years, individuals who wrote in an ancestry tied to a Middle Eastern or North African country were recoded as White (Kayyali 2013). In 2020, however, individuals who wrote in an ancestry tied to a Middle Eastern or North African country were recoded as MENA. Therefore, we have tested how many of the respondents identifying with MENA in 2020 self-identified as White on the 2010 Census. Consistent with the instructions given to survey respondents, we find that 89 percent of persons who flowed into MENA in 2020 had identified as White in 2010. We also find that 98 percent of the non-Hispanic White respondents who switched to MENA switched to non-Hispanic MENA.
Hispanic and Multiracial Coding
As Ilana Ventura and René Flores (2025, this issue) detail, in 2020 the Census Bureau changed how it used Hispanic status in the production of multiracial tabulations. Although the bureau had not considered Hispanic a race category before 2020, in 2020 it considered responses referencing Latino countries in the Some Other Race box to be racial identifications. For example, a respondent who entered both Korean and Costa Rican was counted as Asian rather than multiracial in 2010, but as Asian and Some Other Race in 2020 (Ventura and Flores 2025). Thus, simply because of this survey and imputation change, some of the multiracial population in 2020 would have been coded differently prior to 2020. Using our longitudinal data, we explore how individual respondents who were categorized as multiracial in 2020 were categorized in 2010. We find a nontrivial increase in flows from Hispanic nonmultiracial in 2010 to Hispanic multiracial in 2020. For example, our sample of linked individuals who are observed in both 2010 and 2020 show a fortyfold increase in the count of Hispanic multiracials in 2020. Furthermore, approximately 80 percent of these 2020 Hispanic multiracial identifications are coming from individuals who identified as Hispanic White in 2010. Thus our findings support Ventura and Flores (2025), who argue that 2020 changes to the survey format and imputation method likely increased Hispanic multiracial counts in 2020. Hence the fluidity we are currently (2020 and beyond) observing for Hispanics specifically (especially those who choose the Some Other Race racial category) is the result of the questionnaire design rather than actual contextual fluidity. For this reason, our main results do not include 2020 largely due to this change in question format and postprocessing procedure, which make the comparison across years less direct. Further, given concerns about data quality in the 2020 ACS, we note that the general results and conclusions of this article are robust to including the 2021 ACS.
Ethnoracial Change by Birth Year, Birth Place and Migration
A central unanswered place-based policy question is whether individuals change ethnoracial identification in response to the places they inhabit or whether they seek out places that reflect their chosen ethnoracial identities. Although we do not have a full answer to the central question concerning the direction of causal influence, we can begin to respond by examining how much of the variation in ethnoracial identification can be explained by place of birth, year of birth, and place of residence, both separately and jointly. Figure 8 shows that the rate of change in ethnoracial identification increases sharply across birth cohorts: individuals born in the 1980s are more than twice as likely to change ethnoracial identification in the 2010s than those born in the 1920s. However, despite these trends, birth year alone explains less than 1 percent of the total variation in ethnoracial change.

Trends in Ethnoracial Change by Birth Cohort
Source: Authors’ calculations based on U.S. Census Bureau 2010 and American Community Survey, 2010–2019.
Note: Rates of ethnoracial change are from the 2010 Census to the 2010–2019 ACS. Rates are broken down by birth decade. For respondents with multiple ACS entries, we restrict to the most recent response. There are 196 ethnoracial pairs between which respondents could change. This figure shows rate changes for changes from any designation to any different designation (left axis) as well as the rate change from Black to White or White to Black. (Black-White changes are inclusive of ethnicities. For example, a respondent who changed ethnicity but still identified as Black would not be counted as a Black-White change.) This figure pools native- and foreign-born respondents. The sample is restricted to cohorts born between 1920 and 1985.
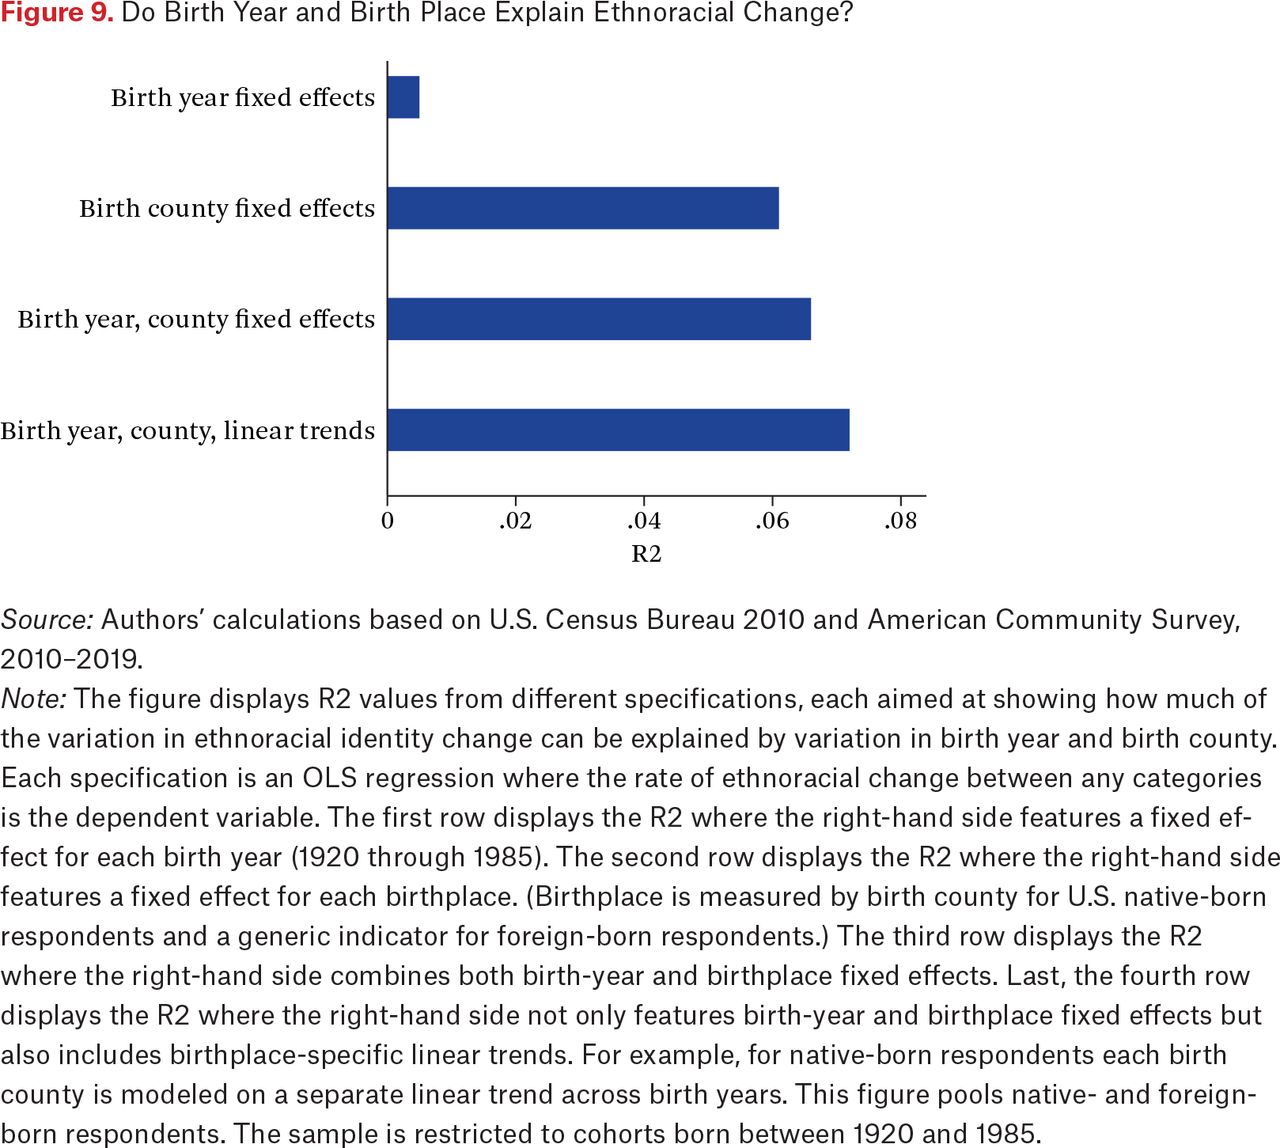
To understand how much of the variation in ethnoracial identification change can be explained by when and where a person is born, we regress ethnoracial change measures against birth year and birth county fixed effects (that is, indicator variables for the county in which an individual was born). We consider several specifications that toggle the inclusion of birth year and birth county fixed effects. Ultimately, we conclude that place of birth plays a much larger role than year of birth in determining ethnoracial change, explaining about six times more of the variation in ethnoracial change as birth-year fixed effects (figure 9). Furthermore, conditional on using birth year and birth county fixed effects, the addition of county by year linear trends adds little explanatory power. The relative explanatory power of geography of birth is consistent with the hypothesis that environmental conditions in childhood play a formative role in determining ethnoracial fluidity. The literature is considerable on how early childhood environments affect labor market, health, and other economic outcomes (Almond and Currie 2011; Chetty et al. 2014), and perhaps ethnoracial fluidity should be understood as another outcome alongside these better-studied economic outcomes. It is worth emphasizing that, just as true of standard economic outcomes, although early childhood environments may affect an outcome in a statistically significant way, childhood environmental factors do not completely predict adulthood outcomes; in other words, even when causal impact coefficients are estimated precisely the overall model leaves the majority of the outcome variation unexplained (Chetty et al. 2011). Both for standard economics outcomes and for ethnoracial fluidity, where and when you are born is not destiny.

Do Birth Year and Birth Place Explain Ethnoracial Change?
Source: Authors’ calculations based on U.S. Census Bureau 2010 and American Community Survey, 2010–2019.
Note: The figure displays R2 values from different specifications, each aimed at showing how much of the variation in ethnoracial identity change can be explained by variation in birth year and birth county. Each specification is an OLS regression where the rate of ethnoracial change between any categories is the dependent variable. The first row displays the R2 where the right-hand side features a fixed effect for each birth year (1920 through 1985). The second row displays the R2 where the right-hand side features a fixed effect for each birthplace. (Birthplace is measured by birth county for U.S. native-born respondents and a generic indicator for foreign-born respondents.) The third row displays the R2 where the right-hand side combines both birth-year and birthplace fixed effects. Last, the fourth row displays the R2 where the right-hand side not only features birth-year and birthplace fixed effects but also includes birthplace-specific linear trends. For example, for native-born respondents each birth county is modeled on a separate linear trend across birth years. This figure pools native- and foreign-born respondents. The sample is restricted to cohorts born between 1920 and 1985.
Ethnoracial Change by Income, Education, and Household Size
Given the results by birth year and place of birth, a wide variety of causal factors contributing to observed changes in ethnoracial identity are still possible. To begin to assess the correlation between these different factors and racial identification change, we provide descriptive breakdowns of the rate of ethnoracial change by income deciles, by educational attainment, and by household type.
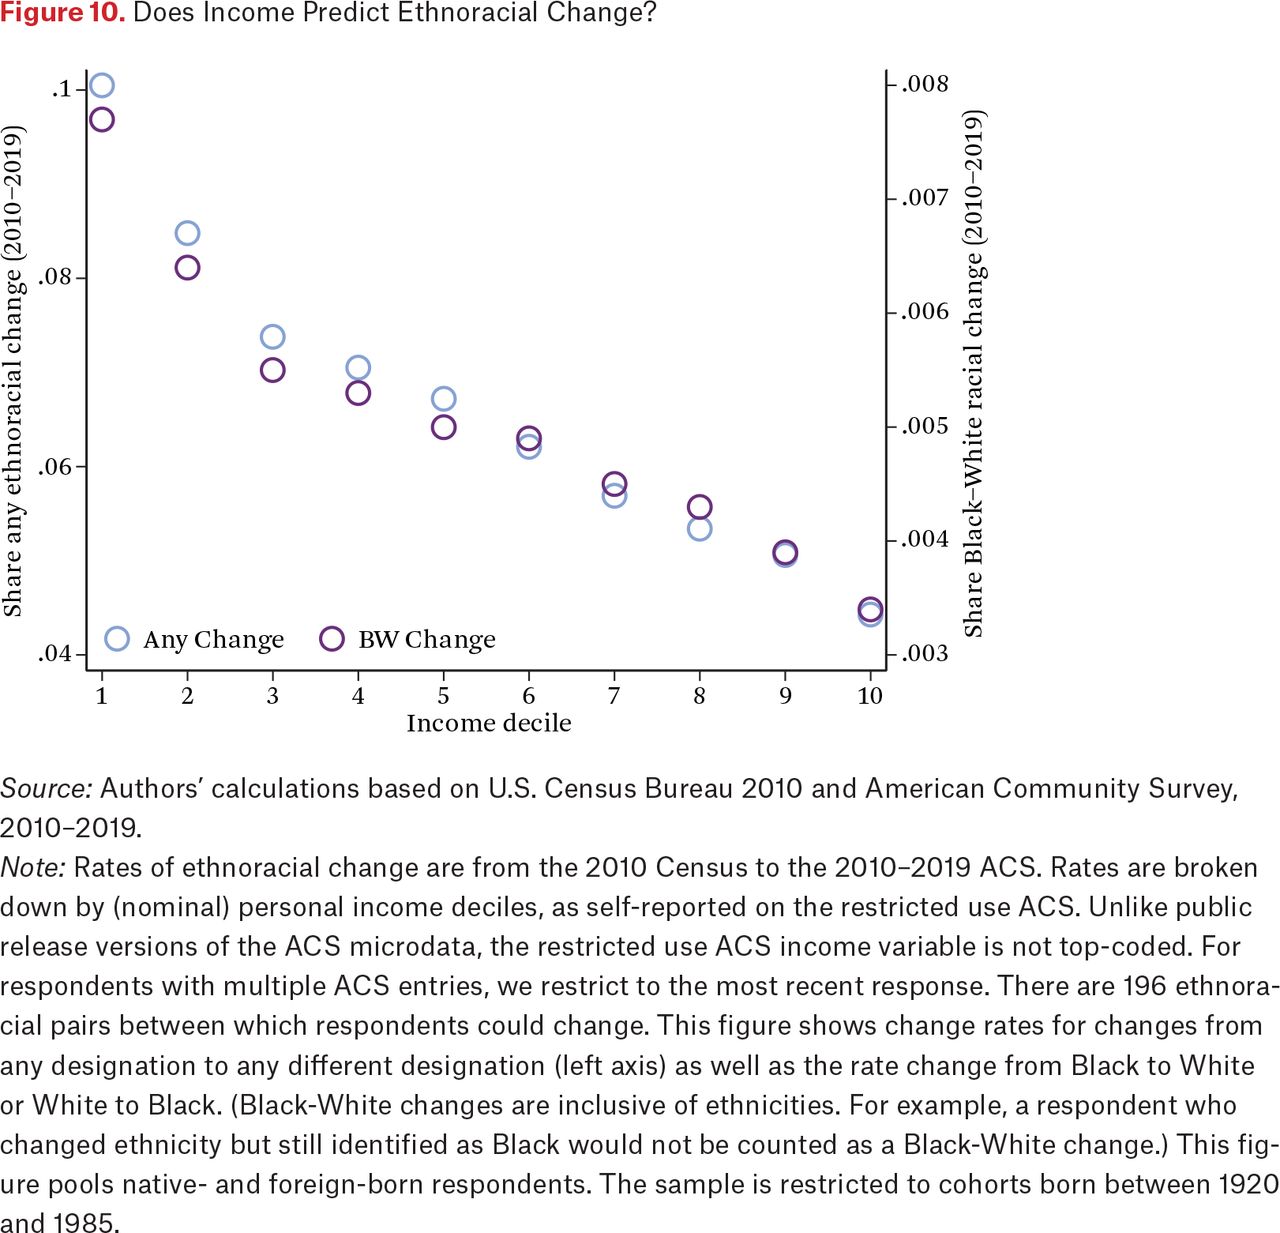
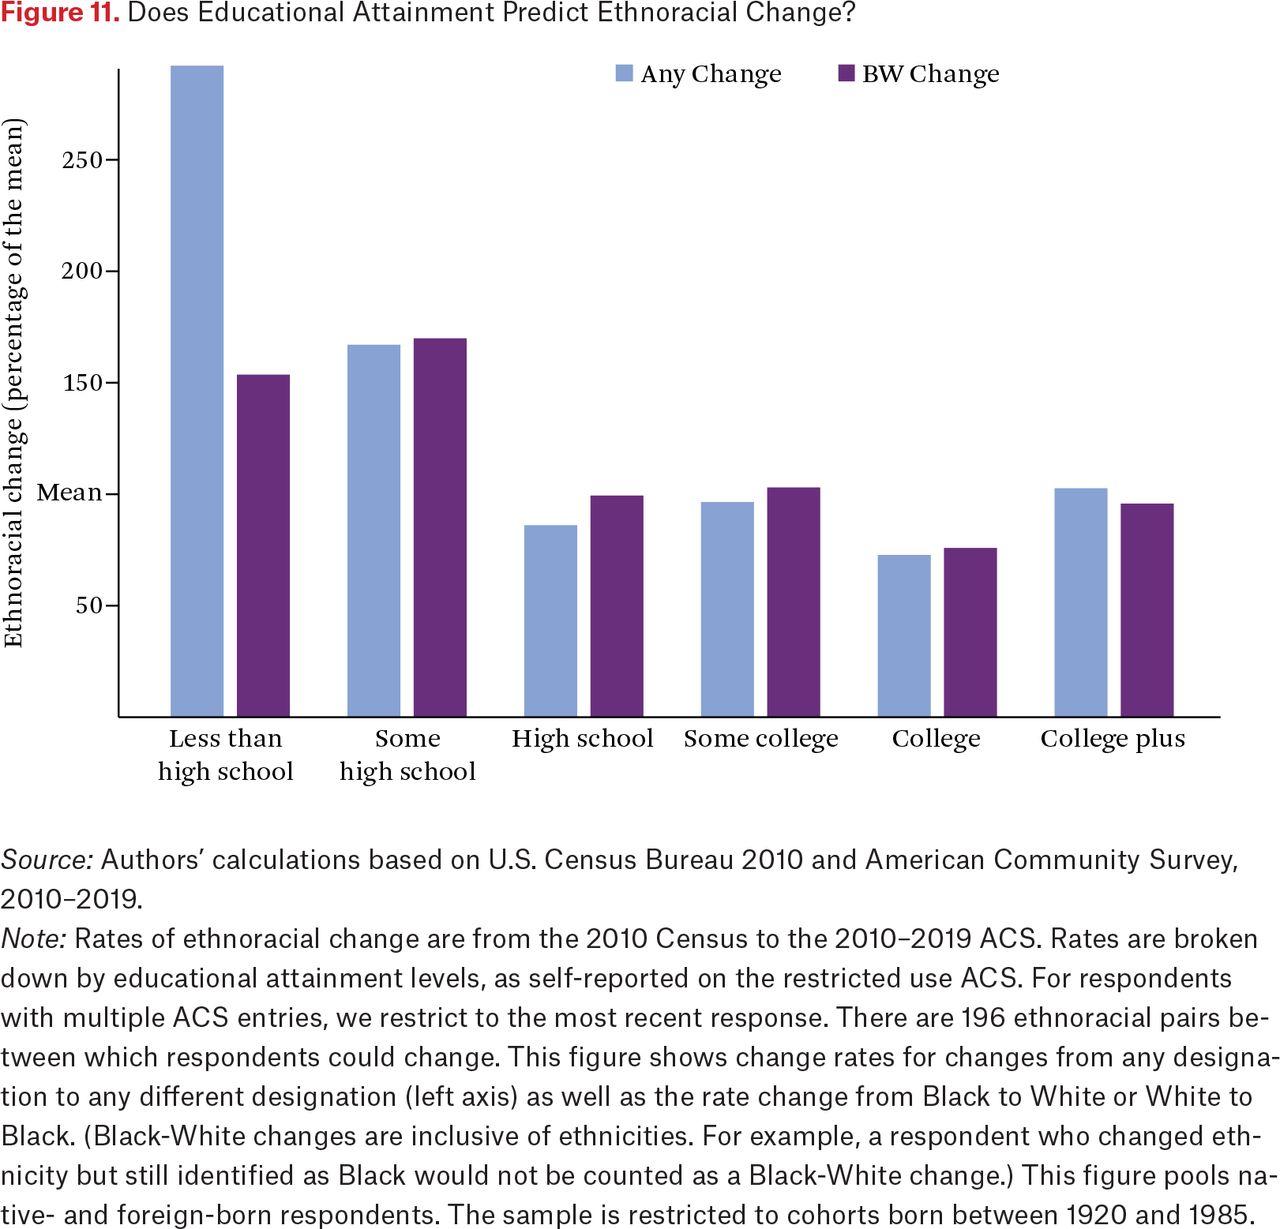
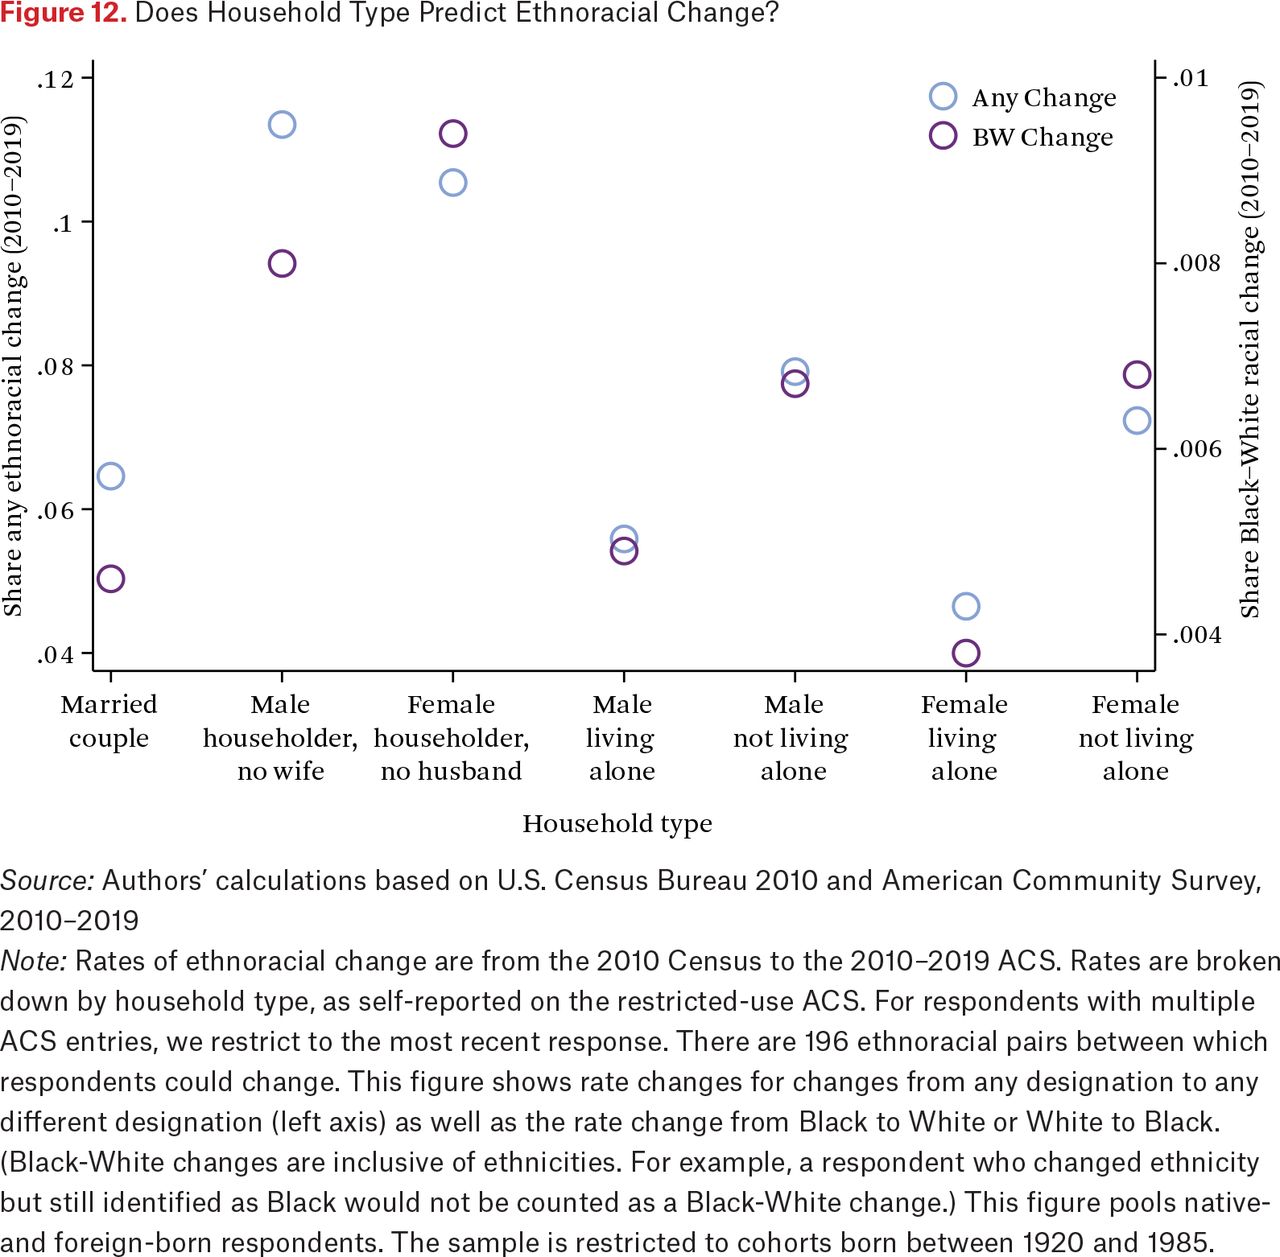
The results in figures 10 through 12 suggest that socioeconomic status plays an important role in ethnoracial change. Income in particular monotonically predicts ethnoracial change, with lower income individuals having higher rates of change. Specifically, figure 10 shows that as income deciles increase, ethnoracial identity becomes increasingly stable: on average, every $10,000 increase in income is associated with a 3 percent decrease both in any ethnoracial change and in Black-White ethnoracial change.6 Education and household type bear a more ambiguous relationship to ethnoracial change. Figure 11 shows that, generally speaking, more educational attainment predicts less ethnoracial change, but this relationship is not strictly monotonic because postsecondary attainment is associated with more ethnoracial change than a bachelor’s degree and there are small increases in change rates between high school and some college. Figure 12 shows variation in ethnoracial change by household type. Overall, married couples (leftmost category) and persons living alone have similar rates of ethnoracial change, and households with unmarried household heads have the highest rate. The rates of those who are not married and not living alone fall between married or single individuals and unmarried household heads. That the distinction between single person and multiperson households does not consistently predict ethnoracial change suggests that observed changes in ethnoracial identity are not primarily driven by the number or composition of persons in the household of the survey respondent. That income and educational attainment do consistently predict ethnoracial change provides suggestive evidence that ethnoracial identity may be driven by socioeconomic factors specific to the respondent.

Does Income Predict Ethnoracial Change?
Source: Authors’ calculations based on U.S. Census Bureau 2010 and American Community Survey, 2010–2019.
Note: Rates of ethnoracial change are from the 2010 Census to the 2010–2019 ACS. Rates are broken down by (nominal) personal income deciles, as self-reported on the restricted use ACS. Unlike public release versions of the ACS microdata, the restricted use ACS income variable is not top-coded. For respondents with multiple ACS entries, we restrict to the most recent response. There are 196 ethnoracial pairs between which respondents could change. This figure shows change rates for changes from any designation to any different designation (left axis) as well as the rate change from Black to White or White to Black. (Black-White changes are inclusive of ethnicities. For example, a respondent who changed ethnicity but still identified as Black would not be counted as a Black-White change.) This figure pools native- and foreign-born respondents. The sample is restricted to cohorts born between 1920 and 1985.

Does Educational Attainment Predict Ethnoracial Change?
Source: Authors’ calculations based on U.S. Census Bureau 2010 and American Community Survey, 2010–2019.
Note: Rates of ethnoracial change are from the 2010 Census to the 2010–2019 ACS. Rates are broken down by educational attainment levels, as self-reported on the restricted use ACS. For respondents with multiple ACS entries, we restrict to the most recent response. There are 196 ethnoracial pairs between which respondents could change. This figure shows change rates for changes from any designation to any different designation (left axis) as well as the rate change from Black to White or White to Black. (Black-White changes are inclusive of ethnicities. For example, a respondent who changed ethnicity but still identified as Black would not be counted as a Black-White change.) This figure pools native- and foreign-born respondents. The sample is restricted to cohorts born between 1920 and 1985.

Does Household Type Predict Ethnoracial Change?
Source: Authors’ calculations based on U.S. Census Bureau 2010 and American Community Survey, 2010–2019
Note: Rates of ethnoracial change are from the 2010 Census to the 2010–2019 ACS. Rates are broken down by household type, as self-reported on the restricted-use ACS. For respondents with multiple ACS entries, we restrict to the most recent response. There are 196 ethnoracial pairs between which respondents could change. This figure shows rate changes for changes from any designation to any different designation (left axis) as well as the rate change from Black to White or White to Black. (Black-White changes are inclusive of ethnicities. For example, a respondent who changed ethnicity but still identified as Black would not be counted as a Black-White change.) This figure pools native- and foreign-born respondents. The sample is restricted to cohorts born between 1920 and 1985.
LIMITATIONS AND OPPORTUNITIES FOR FUTURE RESEARCH
Following Liebler and colleagues (2017), we use multiple tests to minimize the potential for bias resulting from questionnaire differences or the presence of a Census Bureau enumerator. As noted, we also limit our sample to unedited responses to ensure that changes in data editing procedures do not create the illusion of consistency when a person has actually changed ethnoracial identification (or vice versa).
Because anyone in the household can complete a census or ACS form, it is difficult to ascertain self-identification. For this reason, future research could limit the sample to individuals who are the only adult in the household, and again to the head of household or person #1 (the one most likely to be the respondent). We test the potential that respondent variation could be driving the findings by limiting the sample to single person households for figure 9. The results of this robustness check are largely the same as the results for all households and are presented in online appendix table A.7. Nonetheless, figure 12 shows slightly lower rates of change for single person households, so this remains an important area for future work. Future work could test whether it is reasonable to treat Hispanic as a racialized category similar to the other groups. There may be regional variation in this given that Latin Americans in the southern region of the United States are especially likely to be racialized as a minority group (Brown, Jones, and Becker 2018), so testing for regional differences is an area for future research.
Finally, it is especially important that although linking to the Numident creates many advantages such as providing robust county of birth data across birth cohorts, Numident data exclude undocumented residents of the United States who have never had official work authorization in the United States in their lifetime. When we limit our linked sample to those respondents who are successfully linked to the Numident, we limit our linked sample to a subset of immigrants who have at some point in their time in the United States had work authorization. Although imperfect, this project’s newly linkable large-scale federal administrative data remain likely the largest and most representative longitudinal sample currently feasible.
DISCUSSION AND CONCLUSIONS
What ethnoracial fluidity do we see in the 2010s in the United States? This decade was a time of significant demographic change, and the fluidity that we see between the 2010 Census and the 2010–2019 ACS demonstrates that the populations that were growing fastest (for example, people who identify with multiple racial categories, Asian Americans, Hispanics) were also the groups with some of the highest rates of fluidity across data sources. That we see significant fluidity even when we compare measurements in the same year (the 2010 Census and the 2010 ACS) shows that some of this fluidity is likely due to differences in context and survey design, not just changes over time. The social context of the census, for example, is one that often comes with a lot of political attention and campaigns for individuals to identify with a particular community (Lujan 2014; Hillygus et al. 2010). Surveys like the ACS, on the other hand, do not carry the same political baggage, nor are communities likely to be organizing in order to convince their members to identify in a particular way for mobilization purposes. Nonetheless, the finding that fluidity varies by place of birth, year of birth, income, and educational attainment suggests that fluidity is partly determined by where and when a person grew up and their socioeconomic status, not just survey context and design.
The high rate of fluidity we find for Hispanics and people who choose the Some Other Race category mirrors what others have found (Liebler et al. 2017; Vargas and Stainback 2016), and provides more suggestive evidence that the current OMB measurement strategy (a Hispanic ethnicity question followed by a race question) poorly fits the way that many Hispanic respondents see themselves. Census Bureau research (Mathews et al. 2017) shows that when these questions are combined into a single ethnoracial question, nonresponse decreases, as does the number of people who choose the Some Other Race category (a category that, by definition, means the respondent did not feel the existing categories accurately represent their self-identification). More people choose a Hispanic identification on a combined question than on the existing separate questions, and Hispanic respondents are less likely to choose Some Other Race (dropping from about 40 percent of all Hispanic respondents to less than 1 percent) but still equally likely to, for example, choose both the Hispanic and the Black categories. The high rate of fluidity we find for this group of respondents is likely artificially increased by this format that forces Hispanic respondents to choose a racial identity from the list whether or not that choice is personally meaningful. Interviews after the completion of the survey also confirmed that combining the race and ethnicity questions into one question resulted in greater matches between respondents’ self-categorization on the survey and how they described themselves in a subsequent interview (Mathews et al. 2017). This greater consistency across time points and modes of data collection (survey and interview) suggests that some of the fluidity we are currently (2020 and beyond) observing for Hispanics specifically, especially those who choose the Some Other Race racial category, is the result of the questionnaire design rather than actual contextual fluidity.
These data provide many avenues for fruitful expansion of the research that we report here. Future analyses will include ethnoracial fluidity for children of immigrants and people who select multiple ethnoracial categories on forms. Furthermore, our results using place and year of birth suggest that migration patterns both within and into the United States may be able to explain some of the variation in ethnoracial fluidity. Finally, our results using county and year of birth set the stage for testing whether childhood experiences affect adulthood ethnoracial identity. Studying migration and early childhood experiences is, in turn, a first step toward identifying to what extent people choose places based on existing ethnoracial identity, and to what extent places shape ethnoracial identity.
FOOTNOTES
1. Catherine Massey and Amy O’Hara (2014) report that samples from 2010 have a successful PIK rate above 90 percent. Brittany Bond and her colleagues (2014) report the ACS PIK rate of 2009 is 89 percent and 2010 is 93 percent, with slightly higher match rates for non-Hispanic Whites than other groups.
2. The Numident is used to establish individuals’ county of birth following Evan Taylor, Bryan Stuart, and Martha Bailey (2016).
3. See online appendix at https://www.rsfjournal.org/content/11/1/65/tab-supplemental.
4. Given that we replicated Liebler and colleagues’ (2017) findings internally to verify relative coding consistency, this small difference has two possible main sources. First, the census periodically updates how they match individuals to data (that is, the PIK), and we use an updated version of the PIK. Second, Liebler and colleagues (2017) measures fluidity using the 2000 and 2010 Censuses, whereas we link the 2010 Census to the 2011–2019 American Community Survey responses. It may be that individuals respond differently to mandatory censuses relative to voluntary surveys.
5. In the online appendix, tables A.2 and A.3 include the set of identification changes among foreign-born and native-born individuals, respectively.
6. Calculations used a weighted least squares regression of each ethnoracial change variable against the average nominal income level for each decile. Regressions are weighted by the observations within each income decile. The coefficient is then scaled by the mean of each ethnoracial change variable across the entire sample and reported as a percentage of the mean.
- © 2025 Russell Sage Foundation. Anders, John, Mary E. Campbell, Craig Wesley Carpenter, and Luna Chandna. 2025. “Ethnoracial Transformations? Linking Administrative Data to Explain Changes in Identification.” RSF: The Russell Sage Foundation Journal of the Social Sciences 11(1): 65–84. https://doi.org/10.7758/RSF.2025.11.1.04. This article includes research conducted in the Texas Federal Statistical Research Data Center (TXRDC). The Census Bureau has reviewed this data product to ensure appropriate access, use, and disclosure avoidance protection of the confidential source data used to produce this product (Data Management System [DMS] number P-7530695, Disclosure Review Board [DRB] approval numbers CBDRB-FY23-POP001-0094, CBDRB-FY23-POP001-0164, and CBDRB-FY24-POP001-0040). This material is based on work supported by the National Science Foundation under Grant No. 2148889. Any opinions, findings, and conclusions or recommendations expressed in this material are those of the authors and do not necessarily reflect the views of the National Science Foundation or the U.S. Census Bureau. The authors are listed alphabetically. Direct correspondence to: Mary E. Campbell, at m-campbell{at}tamu.edu, Liberal Arts Social Sciences Building, 2935 Research Pkwy Suite 311, College Station, TX 77845, United States.
Open Access Policy: RSF: The Russell Sage Foundation Journal of the Social Sciences is an open access journal. This article is published under a Creative Commons Attribution-NonCommercial-NoDerivs 3.0 Unported License.