
Abstract
According to the U.S. Census, the multiracial population grew 276 percent between 2010 and 2020 and now represents 10.2 percent of the national population. Some believe that norms of hypodescent, which limited multiracial self-identification for most of U.S. history, are weakening. We explore two competing explanations: natural demographic growth and modifications in census methods and data processing. Through a cohort-level analysis of multiracial identification over time in the American Community Survey, we find that the multiracial population is growing naturally. However, most of the multiracial growth stems from changes in data processing enacted in 2020. Such changes doubled multiracial self-identification among the general population, which was fueled by a sevenfold increase among the Hispanic population. We confirm the absence of sharp cultural shifts in multiracial identification by examining data from the Current Population Survey, which did not implement data processing changes during this period, as a counterfactual data source.
For most of U.S. history, the hypodescent rule limited self-identification to only one race (Goldberg 2004), but this rule appears to be on the wane. Since 2000, the U.S. Census has allowed respondents to report more than one race. Multiracials, people who identify in multiple races, are the fastest-growing racial population in the country (Davenport, Iyengar, and Westwood 2022). According to the census, multiracials represented 2.4 percent and 2.9 percent of the population in 2000 and 2010, respectively (Jones et al. 2021; Jones and Symens Smith 2001). However, by 2020 multiracials amounted to 10.2 percent—a 276 percent growth rate.
This dramatic population growth has puzzled observers. Some think it is driven by more multiracial babies being born. Others believe it represents larger “shifts in culture and society” in terms of how Americans identify themselves and how they think about the identities available to them (Tavernise, Mzezewa, and Heyward 2021). Although some degree of cultural change away from norms of hypodescent would be necessary to even recognize children born from different-race parents as multiracial, we doubt such a large cultural shift would happen in only ten years. More likely, changes in data collection procedures by the census may have contributed to this trend. Nevertheless, when asked which factor was causing this demographic shift, census officials said they could not “say for sure one way or another” (Tavernise, Mzezewa, and Heyward 2021). Our inability to identify the source of this phenomenon hinders our understanding of the demographic composition of the United States. It also limits our ability to evaluate if and how racial norms and boundaries may be shifting.
Because such rapid sociocultural shifts are unlikely, we explore two competing explanations for this sudden growth: natural population growth, and modifications in census data procedures. We use data from the U.S. Census Bureau’s American Community Survey (ACS) and the Current Population Survey (CPS) to assess these competing explanations. We use a cohort analysis to examine the natural growth hypothesis because multiracial identification should be relatively stable within cohorts over time and increase between cohorts. Indeed, we find evidence supporting the natural growth of multiracials, particularly among Asians and Blacks. However, we find a spike in multiracial identification among Hispanics who select Some Other Race (SOR) between 2010 and 2020. Due to changes in census coding procedures of Hispanics in 2020, we then use detailed ancestry data and racial identification data for Hispanics in 2020 to align 2020 data with 2010 data for comparative analysis. We find that changes in U.S. Census data processing in 2020 doubled multiracial identification among the general population, fueled by a sevenfold increase among the Hispanic population. We confirm the absence of sharp cultural shifts in racial identification by analyzing data from the Current Population Survey, which did not implement data processing changes during this period, as a counterfactual data source.
Multiracial identification will continue to gradually increase due to natural growth, but we do not expect a major shift away from mono-racial identification norms for most Americans, in the near future.
MULTIRACIAL IDENTIFICATION IN THE UNITED STATES CONTEXT
In 1967, the Supreme Court unanimously struck down laws banning interracial marriage, which led to an increase in mixed-race births (Qian and Lichter 2011). Nevertheless, for most of U.S. history, the hypodescent rule limited self-identification to only one race, both in society and in the census (Goldberg 2002). Hypodescent, also known as the one-drop rule, is a social and legal practice that assigns a person with mixed ancestry to the racial category perceived as subordinate or inferior. In other words, if a person has any amount of African ancestry, they are typically classified as Black, regardless of their appearance or other ancestry.
However, tension exists between how people see themselves and how the state categorizes them, especially given changing social and political contexts. The Census Bureau began to grapple with this tension in the 1960s (Jacobson 2002), a time dominated by conversations of civil rights and the need to use census data to challenge redistricting after the Voting Rights Act. Kenneth Prewitt, Census Bureau director from 1998 to 2001, argues that how we represent—or choose not to represent—groups of people in the census is an “inherently political” decision informed by the politics of the time (2000, 245). Census categories of race and ethnicity can mean more than just aggregate numbers of groups of people. These categories can create racial groups and draw boundaries within and between populations (Nobles 2000; Skerry 2000).
With the growing multiracial population in the United States and no way to measure their size, advocacy groups wanted the census to include a specific “multiracial” category leading up to the 2000 Census (Farley 2002). Although early research adding a multiracial option was shown to reduce the number of people identifying as Native American or Alaskan Native and Asian or Pacific Islanders, African American groups were the most vocally opposed to the additional category (Skerry 2002). Leaders from African American organizations argued that a multiracial option would not only eventually dilute the number of Americans who identified as Black, but also “potentially blur the categories upon which hard-won antidiscrimination and affirmative action programs are based” (Skerry 2002, 328). As a compromise, the census decided on a mark-all-that-apply option, allowing the categorization of people as multiracial based on their selections.
Although this question format seemingly allows multiracial respondents to report their often complex origins, in practice the government has often applied a monoracial logic based on hypodescent when processing the data. Because the federal government still needed to be able to have counts of minority groups by geography for maintenance of the Voting Rights Act, and other apportionment decisions, the federal government mandated that “Responses that combine one minority race and white are allocated to the minority race” (OMB 2000), which complicated determinations about the sizes of protected groups for legislative purposes. Indeed, research has found that in smaller counties, decisions on how to categorize multiracial people can have significant impacts on group-level population counts, especially of American Indians and Asians (Harrison 2002). We therefore must pay close attention not only to administrative-level changes in how we categorize but also how we interpret these categories.
CHOOSING THE MULTIRACIAL IDENTITY
Constructivist scholars see ethnic identity as fluid and dynamic, not fixed or unchanging (Corntassel 2003; Waters 1994). Rather than being determined by biology, they argue that ethnoracial identities may be influenced by changing social norms and contexts (Nagel 1994). Consistent with constructivism, researchers have found that the hypodescent rule has apparently weakened in recent years, influencing the identification choices of mixed-ancestry individuals. In 1960, most children born to married couples consisting of one parent who is Asian and one parent who is White or of one parent who is Black and one parent who is White were classified in the same box as their minority parent. Today, individuals of mixed ancestries are increasingly identifying in multiple categories (Roth 2005; Liebler et al. 2017). Moreover, the identity choices of mixed-race people are informed by social, cultural, political, and economic factors.
Multiracial identification depends on the specific ethnoracial groups involved. It is more common among Native American–White individuals, perhaps reflecting the destigmatization of the American Indian label (Nagel 1995; Harris and Sim 2002). In contrast, identification is more rigid for Asian Whites and Black Whites—the latter being more likely than other combinations of a minority race category and White group to be singularly classified with their minority race by their parents (Qian 2004; Brunsma 2005).
Social class shapes multiracial identification (Townsend et al. 2012). Better-off parents of Hispanic White and Asian White children are more likely to move them away from a monoracial identification (Brunsma 2005). Similarly, greater family resources are associated with whitening biracials’ self-identification, even after adjusting for other family and community traits (Davenport 2016).
Cultural factors also shape the identities of mixed-race people. National origin and proximity to the immigrant experience affect the racial identification of mixed-heritage children (Lichter and Qian 2018; Sáenz et al. 1995). Children of immigrants are more likely to have mixed parentage and identify as multiracial (Lee and Bean 2004). In addition, the identity choices of biracial individuals are informed by their region, neighborhood, and school, and the racial composition of their social networks (Herman 2004; Brunsma 2005; Roth 2005).
Phenotype also influences self-identification choices. Black White biracial individuals who are fairer in appearance are more likely to identify as multiracial than as their minority race (Rockquemore and Brunsma 2008), whereas those who appear more prototypically minority encounter higher levels of racial discrimination and are more likely to identify with their minority race than as White (Herman 2004). In addition, mixed-race women are more likely than men to identify as multiracial than as monoracial, perhaps because women are less likely to be perceived as singular racial minorities (Davenport 2016; Ho et al. 2011; Rockquemore 2002).
The literature suggests that multiracial identification is strongly influenced by social, cultural, economic, and political factors. However, individual race and Hispanic identification over time is quite stable (Liebler et al. 2017) and sociocultural norms only change gradually (Kiley and Vaisey 2020). Given the sharp increase in multiracial identification from 2010 to 2020, we do not expect that sociocultural norms can shift as rapidly to explain this trend. We examine two competing hypotheses for this jump: natural growth, and changes to census procedures.
Mechanism 1. Natural Growth
Demographers distinguish between natural and social sources of ethnoracial population growth (Hout and Goldstein 1994). Natural growth is caused by differential mortality and fertility plus migration. In contrast, social growth originates from changes in individuals’ categorical membership. One obvious explanation for these shifts in the multiracial population could be natural demographic trends. Racial intermarriage has increased steadily since legal prohibitions were struck down by the Supreme Court in 1967 (Qian and Lichter 2011). In addition, post-1965 immigration flows, mostly from Asia and Latin America, have added to the country’s ethnoracial diversity (Alba, Beck, and Basaran Sahin 2018). The U.S. Census decision to permit respondents to select multiple races in the 2000 Census is linked to a recognition of racial intermarriage and the resulting rise of multiracial children being born (Perlmann and Waters 2002). Of course, sociocultural factors are also likely at play in recognizing children born from different-race parents as multiracial, but we doubt such a large cultural shift would happen in a decade.
Thus, we should expect growing numbers of racially “mixed” babies over time, which could be fueling this rise in multiracial identification. However, because we know that census procedures have also changed over time, we must also consider not only the demographic shifts, but also the administrative procedural ones.
Mechanism 2. Census Data Procedures
Survey methodologists have found that seemingly small changes in question wording can affect individuals’ responses (Rasinki 1989; Schuman and Presser 1996). Even subtle changes in the procedures used by national censuses to identify ethnoracial populations may lead to significant changes in the size and characteristics of these populations (Pryor et al. 1992). René Flores, María Vignau Loría, and Regina Martínez-Casa (2023) find that a slight change in the wording of the ethnic identification question by the Mexican Census in 2010 more than doubled the self-identified Indigenous population in Mexico. The U.S. Census has a long history of modifications in the race and ethnicity questions, which has notably affected how we count people of Latin American origins over time.
For most of U.S. history, the census had no dedicated Hispanic or Latino category save for a 1930 only Mexican racial category. In the 1960s, Hispanic activists urged the census to identify Hispanics as a minority population under the Voting Rights Act. However, government officials and some activists did not want to create a Hispanic race category and “insisted that Mexicans and Puerto Ricans were simply White Americans who were destined to assimilate” (Mora 2014, 11). Additionally, the census feared that a Hispanic race option might result in high nonresponse because Mexicans, Puerto Ricans, and Cubans did not necessarily consider themselves a unified Hispanic racial group at the time, which could affect census data quality. In the end, the census compromised and created a separate ethnicity question, as opposed to a Hispanic race category, to identify Hispanics.
Even though the Hispanic question in the 1970 Census was only on the long-form questionnaire, the question wording prompted a presumed overcount of Hispanics because respondents in the South or central regions of the country likely marked themselves as “Central or South American” (Cohn 2010).1
The 1980 Census placed the Hispanic question on the short form questionnaire. It used different wording for the Hispanic question,2 jointly with a media campaign promoting the existence of a panethnic Hispanic group in the United States (Mora 2014). The creation of the Hispanic ethnicity question for the 1980 Census allowed for the count of Hispanic people as two groups if needed, which had both practical and conceptual implications. On the practical side, the ethnicity question would allow users of census data to split Hispanic respondents between Black and White or to separate Hispanic from Black and White for the sake of interest groups involved in the categorization compromises.
In practice, many Latinos check Some Other Race in the census race question and write in their national origins. When the 2000 Census allowed people in the United States to select more than one racial category, it became common for Latinos to select White or Black in addition to the Some Other Race category. In fact, almost half of multiracials in 2000 were a combination of Hispanics who marked Some Other Race alongside one of the other specific race category options (Farley 2002). Additionally 90.4 percent of the Some Other Race respondents in 2000 were Hispanic, and 97.4 percent of those who selected only Some Other Race were Hispanic (Farley 2002).
The 2010 Census (beginning with the 2008 ACS), included an updated direction prompt for the ethnicity and race questions indicating that “For this census, Hispanic origins are not races,” presumably so that Hispanics would keep their Latin American–origin responses in the Hispanic ethnicity question instead of place it in the race question (Cohn 2010). Respondents were prompted only to write in racial origins for American Indian or Alaska Native, Other Asian, Other Pacific Islander, and Some Other Race categories. If someone selected multiple racial groups and wrote in a Latin American or Hispanic origin in the Some Other Race category, they were coded only as the non-Hispanic racial group or groups. Respondents’ written Hispanic origin was disregarded in coding.3 For example, if a person selected Korean and wrote in Costa Rican in the Some Other Race box, they were solely classified racially as Asian, and the Costa Rican write-in was ignored by coders (Marks and Rios-Vargas 2021; Jones et al. 2021). The census counted fewer Some Other Race Hispanics in 2010 (30.6 percent) than in 2000 (32.7 percent), likely a result of these methodological changes.
This changed in 2020 when census officials considered Latino nationalities presented in the Some Other Race box as valid answer options. The same respondent who had indicated that they were Korean and wrote in Costa Rican in the Some Other Race box would be classified as both Asian and Some Other Race, and thus multiracial, as well as Hispanic or Latino by ethnicity. However, the race codes would not indicate Costa Rican because Hispanic options could not be coded as races under the guiding Office of Management and Budget standards of the time. We hypothesize that this change in wording and coding procedure artificially inflated the number of people identified as multiracial in the 2020 Census relative to 2010 estimates.
DATA AND METHODS
We use data from the Census’s American Community Survey (ACS) for the years 2000, 2010, 2020, and 2021 obtained through IPUMS (Ruggles et al. 2023). The COVID-19 pandemic elevated nonresponse rates in the 2020 Census, and concerns about the 2020 weights (Daily et al. 2021). Thus we include 2021 data as a robustness check.
To ensure that other larger sociocultural shifts that may prompt widespread increases in multiracial identification were not related to the sudden increase in multiracial identification we find in the ACS data, we also examine patterns of multiracial identification in a second data source as a counterfactual. In other words, if sociocultural shifts caused the rapid rise in multiracial identification, other data sources should reflect similar increases. We test this by analyzing data from the Current Population Survey (CPS) March Annual Social and Economic Supplement (Flood et al. 2022).4 The CPS, which is a large nationally representative survey, uses somewhat distinct self-identification question formats, residence rules, and editing procedures than the ACS (Menendez 2007). These differences may result in different baseline estimates of the multiracial populations in each survey. However, unlike the ACS, the CPS did not change its race and Hispanic origin questions, and only minimally changed how it processed them during the 2010 to 2020 period.5 This makes the CPS an ideal counterfactual to examine racial identification patterns in the absence of changes to census procedures.
To assess the effect of the coding changes on the estimates of multiracial identification in 2020, we need to align the ACS 2020 and 2021 data to 2010, by removing—to the best of our ability—the effect of the procedural coding change in the data. In other words, we need to recode the 2020 and 2021 data to “look like” 2010 data. Because this change only affected self-reported Hispanics in 2020 and 2021, we make this adjustment only for Hispanics.6 For all non-Hispanic respondents in 2020 and 2021, the adjusted multiracial indicator is equal to the raw census-variable-based multiracial indicator. Hispanic respondents were marked as multiracial in the adjusted 2020–2021 multiracial indicator when
Hispanic respondents are categorized as three or more major races.7
Hispanic respondents are categorized as two major races with two non-Other bivariate race indicators.
Hispanic respondents have two non-Hispanic ancestries.
Hispanic respondents have any mixture ancestry.
Hispanic respondents have one Uncodable and one non-Hispanic ancestry.
Hispanic respondents have one Other and one non-Hispanic ancestry.8
All other Hispanic respondents in 2020 and 2021 categorized as two major races when one race was Other in the detailed racial categories were recoded as not multiracial in the adjusted multiracial indicator.9
For this work, we also create synthetic cohorts based on birth decade. We limit analysis to those born in 1940 or later. All analyses include children because they are a crucial indicator of racial change. However, the racial identification of children is likely done by their parents, who are filling out household forms on their behalf.
First, we examine raw and adjusted multiracial identification by year and cohort by major racial or ethnic group over time in descriptive statistics. We focus specifically on the effects of the 2020 and 2021 coding changes on Hispanic identification.
Second, we then use logistic regression to model multiracial identification in the ACS and CPS on Hispanics, Black, White, and Asian respondents for 2010 and 2021. We estimate raw and adjusted multiracial identification in the ACS, and then replicate the model using CPS data for Hispanics (models 1–3), to concurrently test both the census artifact and natural growth hypotheses. We then estimate multiracial identification for non-Hispanic Black (models 4 and 7), White (models 5 and 8), and Asian (models 6 and 9) respondents in the ACS and CPS, to show the importance of natural growth across the non-Hispanic population for the major U.S. race groups, as well as the correspondence of the two datasets. Our main independent variables are year and cohort. However, because we recognize the association of individual-level sociodemographic factors with multiracial identification, we also control for gender, immigrant generation (first, 1.5, second plus), household income, educational attainment, county-level partisanship, and region.10 Controlling for each of these individual-level factors, that the literature has shown to influence multiracial identification, allows us to better adjudicate the effects of year and cohort on multiracial identification.
Results
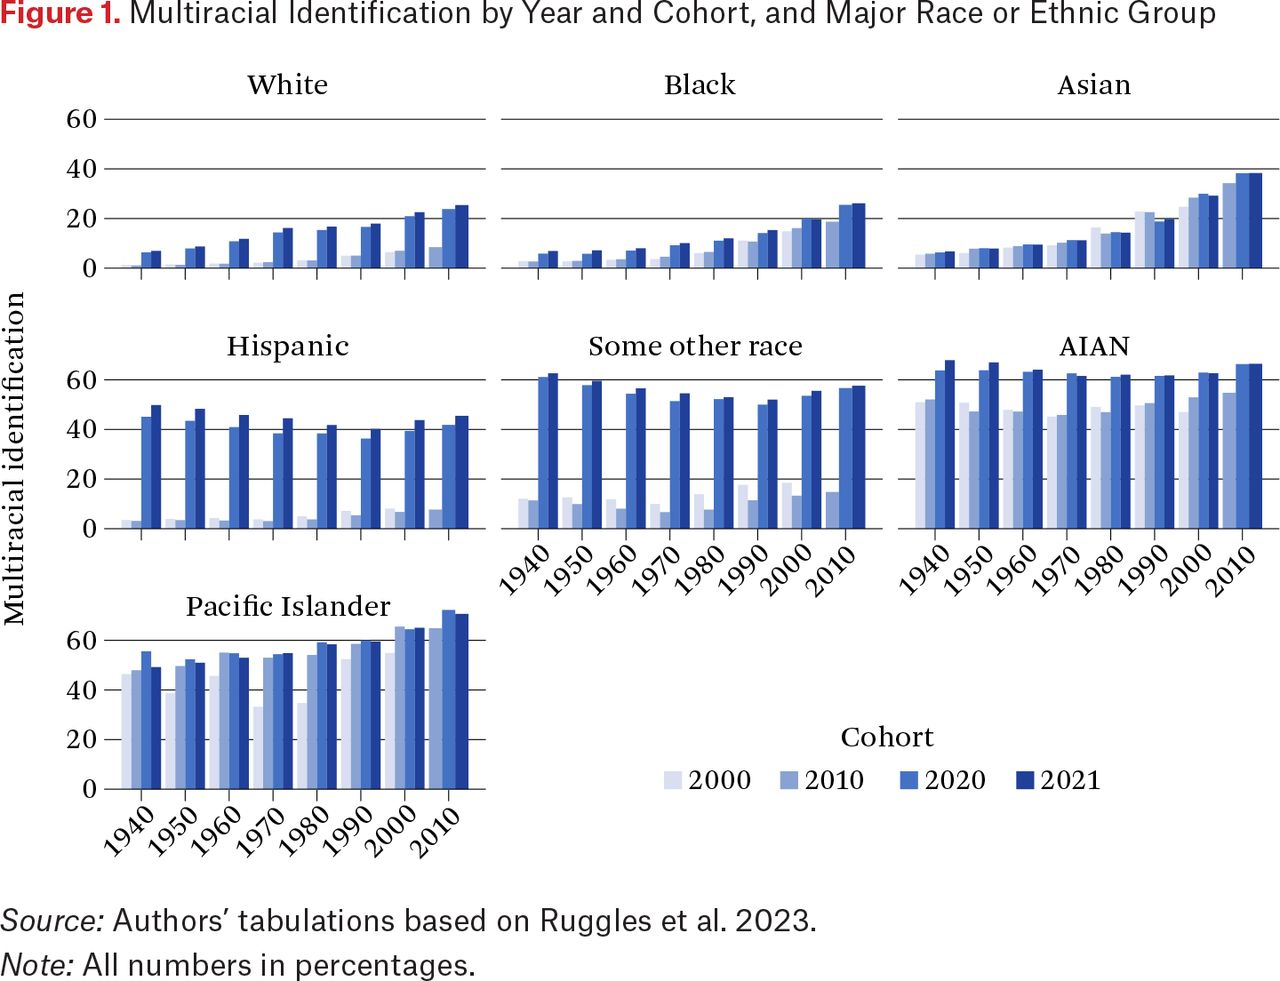
We begin our analysis exploring the natural growth hypothesis. We examine American Community Survey estimates of multiracial identification by racial and ethnic group, by year and birth cohort. Figure 1 shows birth cohort on the x-axis, with multiracial identification of each race-ethnic group in columns shaded by year of the data. In other words, figure 1 shows the percentage of individuals that identify with each ethnoracial category that identify with at least two major race categories. If growth in multiracial identification is due to natural growth, we should see general consistency in multiracial identification within cohort over time, because the ethnoracial identification of each birth cohort should not change considerably over time, as well as a steady growth between cohorts. Figure 1 shows some evidence for the natural growth hypothesis, mainly for Asian and Black Americans, with steady increases in multiracial identification by birth cohort.

Multiracial Identification by Year and Cohort, and Major Race or Ethnic Group
Source: Authors’ tabulations based on Ruggles et al. 2023.
Note: All numbers in percentages.
However, we also see disproportionate jumps in multiracial identification between 2010 and 2020 for White, Some Other Race, and Hispanic Americans that are too large and sudden to be explained by simple natural growth. Hispanics report an almost 40 percentage within-cohort point increase in multiracial identification between 2010 and 2020 across all cohorts. If there had been such a break in cultural norms to dilute hypodescent, we should see a similar steep break among Asians and Blacks, which we do not.
Next, we examine the overlap between Hispanic and Some Other Race identification, for two reasons. First, the jump in multiracial identification between 2010 and 2020 is primarily among Hispanics and Others. Second, the census changed its coding procedures in 2020 to recode Latin American origins in the race question as Some Other Race. In 2010, on the other hand, Latin American origin write-ins were ignored in coding. Figure 2 shows the percentage of Hispanics who mark Some Other Race in the 2000, 2010, 2020, and 2021 ACS, by birth cohort. Although multiracial identification is mostly stable across cohort, with a slight within-cohort drop in nearly every cohort between 2000 and 2010,11 we see an increase of approximately 50 percentage points across all cohorts between 2010 and 2020. This is very likely the result of changes in census text and coding procedures, where Latin American origins are coded as valid race values of Some Other Race in 2020, but not in prior years. The percentage of Hispanics who mark Some Other Race is about 5 percentage points greater in 2021 than in 2020 across cohorts.

Percentage of Hispanics Who Mark “Some Other Race”
Source: Authors’ tabulation based on Ruggles et al. 2023.
Note: All numbers in percentages.
We have another way of testing the hypothesis that codification changes drove multiracial growth, focusing on the Some Other Race Hispanics. To do so, we examine the shift in number and proportion of Hispanics identifying as two major races and as three or more major races, by year (table 1). Given changes in census procedures in 2020, we would expect to see a spike in Hispanics marking two races where one of them is Some Other Race in 2020, with similar rates of those marking three or more races in 2020 as marking two races in 2010. This is because if we remove those with Some Other Race from the 2020 three or more races group, they would still be categorized by at least two other major racial groups. Indeed, as shown in table 1, we see a large jump in the proportion of Hispanics who identify as Some Other Race with exactly two major race groups between 2010 and 2020 (from 2.3 percent in 2010 to 36 percent in 2020). Although 0.2 percent of Hispanics identify as Some Other Race with three or more groups in 2010, 2 percent of Hispanics identify as Some Other Race with three or more groups in 2020. In other words, in 2020, we know that those who identify with three or more major race categories are multiracial according to the 2010 and 2000 definitions, because if we remove those with Some Other Race from this group, they would still be categorized by at least two other major racial groups. However, what of the remainder of this group?
Multiracial Hispanics Who Mark “Some Other Race” and Total Percent Multiracial Hispanics, by Number of Major Race Groups
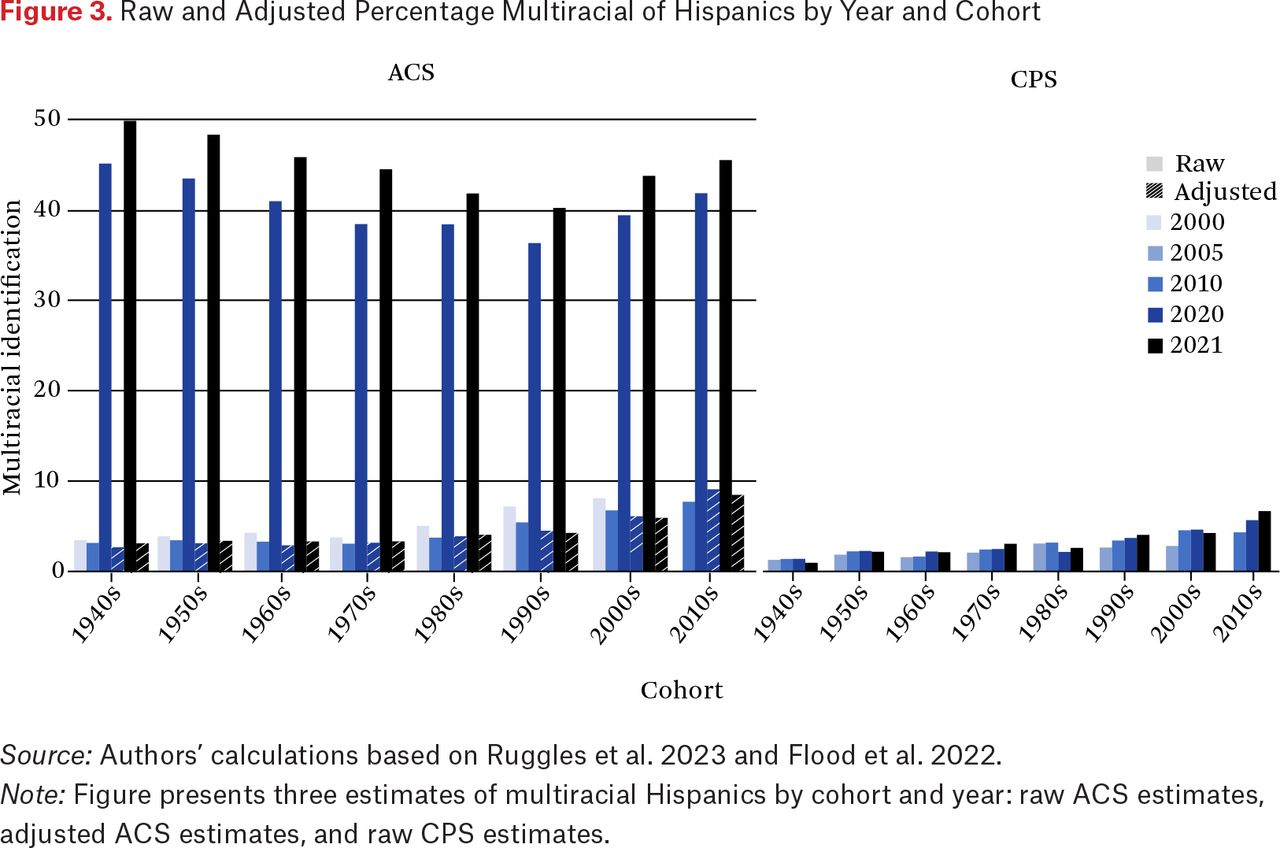
As explained in the data and methods section, we create an adjusted indicator for Hispanic multiracial identification, only for the 2020 and 2021 ACS, which allows us to deflate estimates of Hispanic multiracial identification to be comparable to 2000 and 2010 estimates. We plot raw and adjusted percentages of multiracial identification of Hispanics by cohort and year in figure 3. We also present similar estimates from the CPS March Annual Social and Economic Supplement for comparison. Given that the CPS maintained consistent wording and data processing procedures during this period, we use the CPS to comparatively examine the growth trajectory of the multiracial population, even under different baseline methodological procedures. We must note, of course, that the ACS and CPS race and ethnicity questions have different text and data editing procedures—with the ACS allowing for more freedom in write-in options even in prior years—which accordingly results in different estimates of the multiracial populations in each survey (Menendez 2007). However, because we are comparing trends in identification changes, differences in baselines do not affect our conclusions. Our adjusted ACS estimates align considerably closer to patterns illustrated in the CPS data relative to the original 2020 and 2021 multiracial indicators, with little change between 2010 and 2020 for most cohorts, and a slight increase for the 2010 cohort. Indeed, this further suggests that census procedural change is likely the major cause of the jump in multiracial identification between 2010 and 2020, given that we do not see a similar jump in the CPS data.

Raw and Adjusted Percentage Multiracial of Hispanics by Year and Cohort
Source: Authors’ calculations based on Ruggles et al. 2023 and Flood et al. 2022.
Note: Figure presents three estimates of multiracial Hispanics by cohort and year: raw ACS estimates, adjusted ACS estimates, and raw CPS estimates.
Figure 4 shows similar raw and adjusted multiracial identification by year and cohort in the ACS and CPS data, but for all racial and ethnic groups combined. Once we adjust for the Hispanic inflation of multiracial identification in 2020 and 2021, we do still see increases in multiracial identification in the ACS between 2010 and 2020, but less so relative to the raw ACS data. In the CPS, we see stable or decreasing multiracial identification by cohort between 2010 and 2020 for all cohorts, except for 2010—which shows a modest increase. However, such a comparison is still useful because it allows us to attempt to adjudicate the nature of some of the variation in multiracial identification of the U.S. population by year.

Total Raw and Adjusted Percentage Multiracial Identification by Year and Cohort
Source: Authors’ calculations based on Ruggles et al. 2023 and Flood et al. 2022.
Note: Figure presents raw and adjusted estimates of multiracials for all individuals in samples, by cohort and year. Panel 1 shows adjusted ACS estimates (adjustment only affects Hispanics), panel 2 shows raw ACS estimates, and panel 3 shows raw CPS estimates.
Thus, we can confidently state that changes in coding methodology doubles estimates of multiracial identification between 2010 and 2020 for the general population—which is a result of an increase in multiracial identification by a factor of seven among the Hispanic population due to the 2020 data processing method. However, as shown by increases in multiracial identification by cohort using adjusted ACS and CPS data, it is also true that natural growth has lent to an increase in the multiracial population of the United States as well. Later cohorts are more multiracial than prior cohorts, likely due to a mix of intermarriage and migration, as well as potential changes in cultural norms around multiracial identification.
Although our data do not allow us to test for changes in cultural norms around multiracial identification over time, we can control for some of their likely sociodemographic correlates. Doing so allows us to better test both the natural growth and census artifacts hypotheses without the effects of individual-level variation in some of the sociodemographic correlates of multiracial identification. We use logistic regression to estimate multiracial identification using 2010 and 2021 data, controlling for the following individual- and region-level correlates of multiracial identification: income, gender, education, immigrant generation, political ideology (county level), and geographic region of residence.12
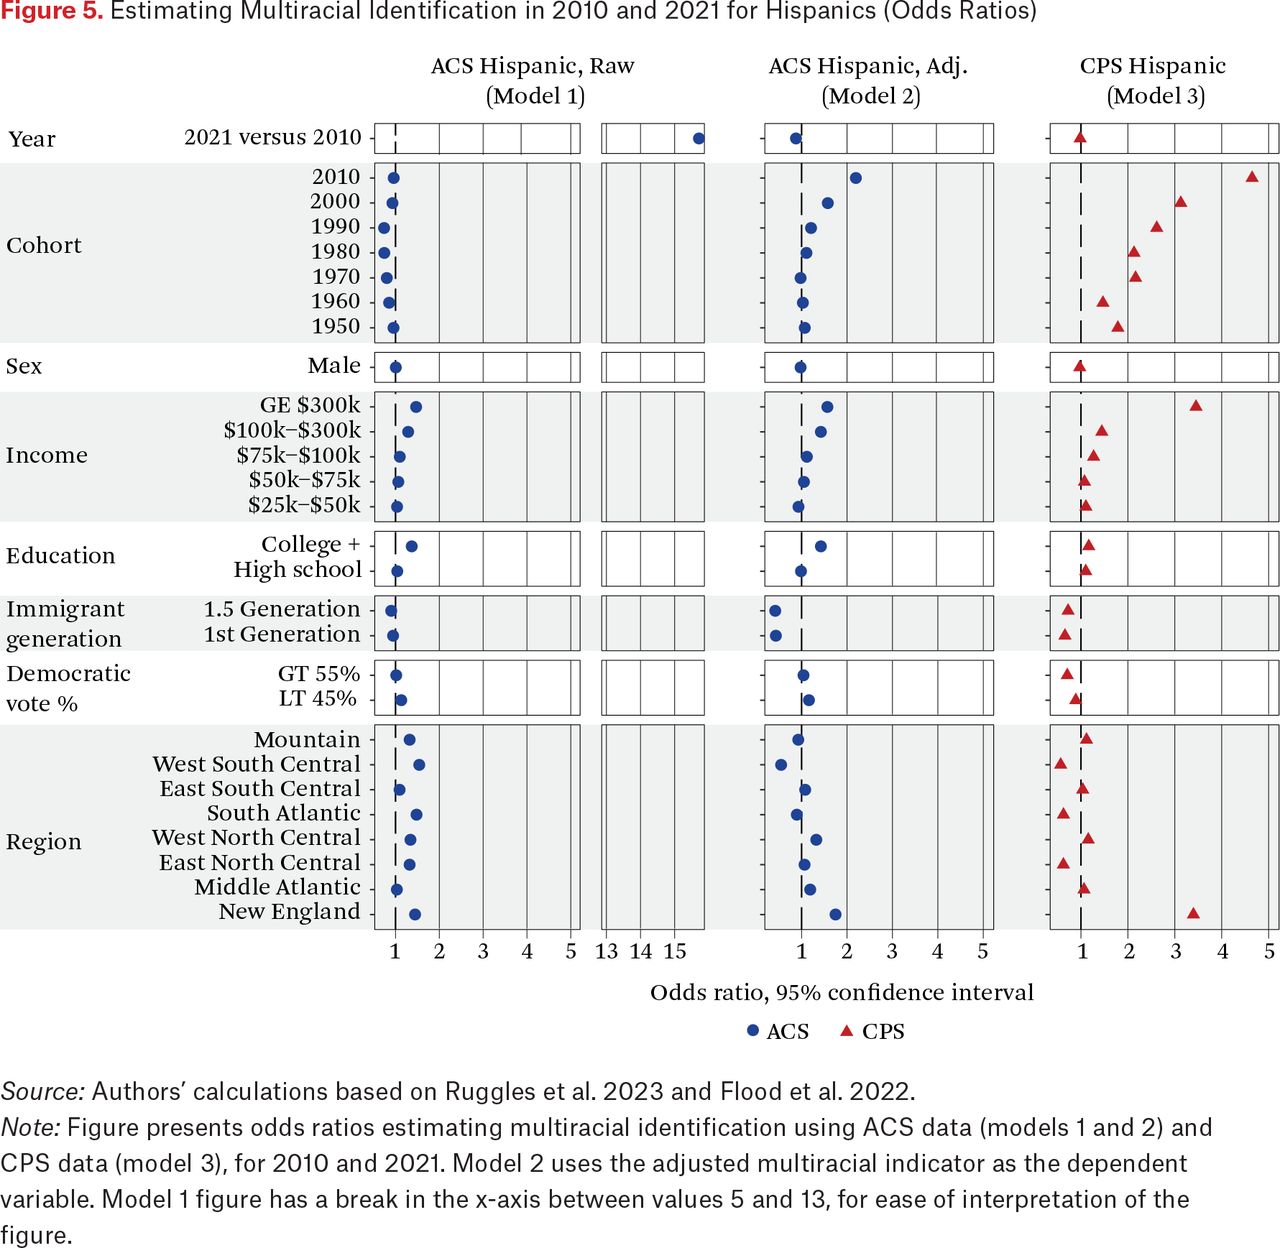
Figure 5 presents odds ratios estimating multiracial identification of Hispanics in the ACS (both raw and adjusted) and the CPS (output for models 1 through 3 presented in table A.1), with controls. We note two key findings. First, the odds ratio for year in the raw and adjusted ACS data dropped from 15.7 to 0.8, respectively. The odds ratio for year in the CPS data is 1.0, which indicates that the year has no statistical effect on multiracial identification in the CPS data, net of controls. The drop in the effect of year in the ACS models indicates that, even when controlling for sociodemographic correlates of multiracial identification, our adjusted multiracial indicator removes much of the effect of the change in census data procedures in the data. This is further evidence supporting the census artifact hypothesis. Second, after the adjustment, we see a steady increase in the odds of identifying as multiracial by cohort for Hispanics for those born in 1980 or later in the ACS. This increase in multiracial identification by cohort is also present in the CPS data (model 3), providing further support for the natural growth hypothesis for Hispanics.
Estimating Hispanic Multiracial Identification in 2010 and 2021 (Log Odds)

Estimating Multiracial Identification in 2010 and 2021 for Hispanics (Odds Ratios)
Source: Authors’ calculations based on Ruggles et al. 2023 and Flood et al. 2022.
Note: Figure presents odds ratios estimating multiracial identification using ACS data (models 1 and 2) and CPS data (model 3), for 2010 and 2021. Model 2 uses the adjusted multiracial indicator as the dependent variable. Model 1 figure has a break in the x-axis between values 5 and 13, for ease of interpretation of the figure.
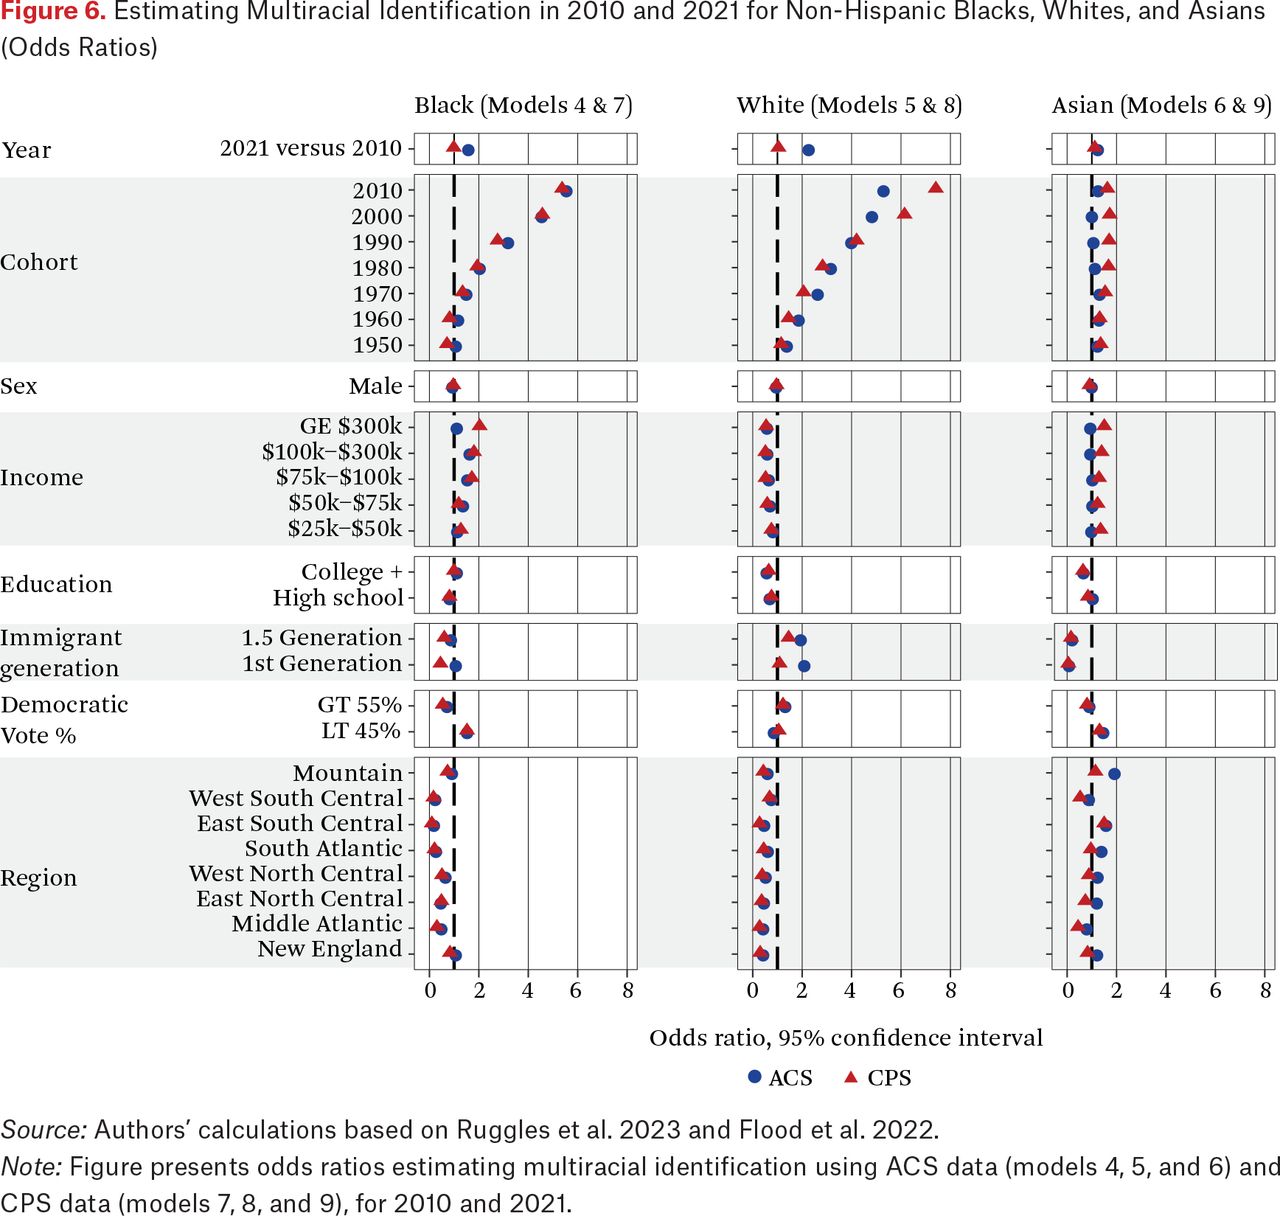
Figure 6 presents odds ratios estimating multiracial identification among non-Hispanic Black, White and Asian respondents in the ACS (circles) and the CPS (triangles), with controls (output for models 4–9 presented in table A.2). This allows us to examine the natural growth hypothesis for Blacks, Whites, and Asians. The adjusted ACS multiracial indicator was only for self-reported Hispanics, however; therefore we do not produce raw and adjusted estimates for non-Hispanics. In figure 6, odds ratio estimates for cohort trace closely in both the ACS and CPS datasets for Black and White respondents, with steady increases by cohort, but less so for Asian respondents. This indicates the importance of natural growth in multiracial identification, net of controls, only for Black and White respondents.
Estimating Black, Asian, and White Multiracial Identification in 2010 and 2021 (Log Odds)

Estimating Multiracial Identification in 2010 and 2021 for Non-Hispanic Blacks, Whites, and Asians (Odds Ratios)
Source: Authors’ calculations based on Ruggles et al. 2023 and Flood et al. 2022.
Note: Figure presents odds ratios estimating multiracial identification using ACS data (models 4, 5, and 6) and CPS data (models 7, 8, and 9), for 2010 and 2021.
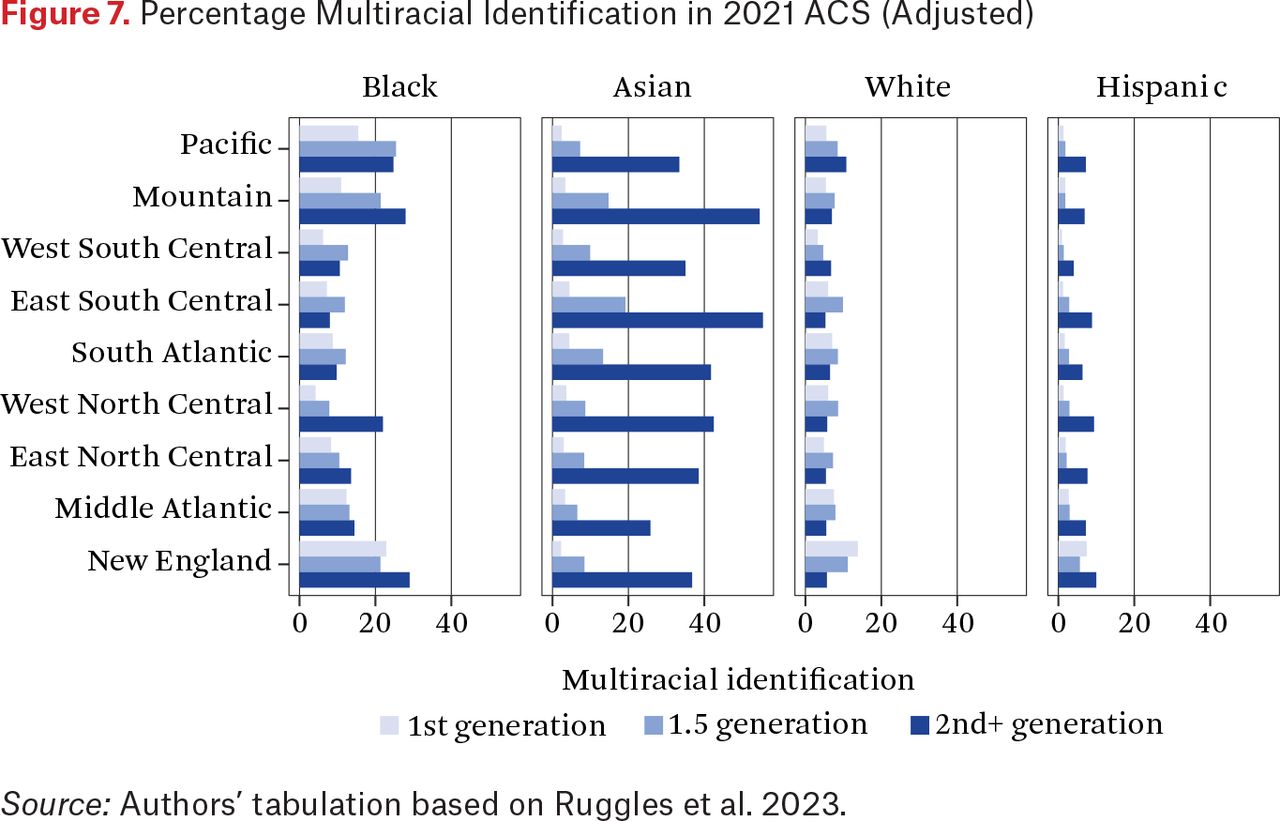
Puzzling here is that although Asians show the clearest raw increase in multiracial identification by cohort in figure 1, we see less of this growth in the model. Once we control for individual and region level covariates, the association of cohort drops away for Asians. However, we do see the importance of individual-level immigration and regional variation. Specifically, 1.5 generation and first generation immigrants have lower odds of identifying as multiracial than second- or later-generation Asians. We plot multiracial identification in the 2021 ACS by race-ethnicity (adjusted), region, and immigrant generation, to better elucidate these patterns. As we see in figure 7, the Asian American born are considerably more likely to identify as multiracial than the 1.5 and first generation, and this pattern varies by region. Explanation for this variation is beyond the scope of this article, but we suspect this may be related to regional cultural differences as well as differential intermarriage rates by Asians across U.S. regions.

Percentage Multiracial Identification in 2021 ACS (Adjusted)
Source: Authors’ tabulation based on Ruggles et al. 2023.
DISCUSSION
How the Census Bureau chooses to categorize people is not always aligned with how people see themselves. Unable to fit into standard U.S. race categories, many Latinos check Some Other Race in the census, though they may be otherwise considered White, Black, or Indigenous according to external classification by the census or the state (Rodriguez 2009). This work finds that modifications in census data procedures between 2010 and 2020 of Hispanic-origin Some Other Race write-ins in the racial identification question doubled multiracial identification among the general population, by increasing multiracial identification by a factor of seven among the Hispanic population.
In this issue, John Anders and his colleagues (2025) use a sample of linked respondents who completed both 2010 and 2020 Censuses and find a similar fortyfold increase in Hispanic multiracial counts. They also find that 80 percent of Hispanic multiracial identifications identified as single-race Hispanic White in 2010, which aligns with our findings. We hypothesize that some of these 2010 White-Hispanics who later identified as multiracial in 2020 may have written-in a Hispanic origin as a Some Other Race in 2010, but were backcoded out from the Some Other Race category in 2010.
However, after correcting for changes in census procedures, we still find strong evidence for the natural growth hypothesis through cohort-level growth in multiracial identification, but also some unexplained variation. Although we expect multiracial identification to continue to grow due to natural growth, we do not yet see a significant departure from monoracial identification norms, except for U.S.-born Asians, who have higher rates of multiracial identification. Future work may explore what is driving cohort changes in multiracial identification, including immigration, regional, socioeconomic, and cultural level changes. Indeed prior work has found evidence of fluidity in racial identification over time (Liebler et al. 2017), particularly in response to changes in social position (Saperstein and Penner 2012).
As the census considers a combined race-ethnicity question for the 2030 Census (OMB 2023), we hypothesize that Latinos may decrease their multiracial self-identification. Indeed, Latinos often do consider their national origin a racial category, especially when multiracial options are available on surveys. However, such a change in methods may cause yet another shock to comparability in census racial classifications between census years. This article shows both the importance of understanding self-identification patterns from the perspective of data collection and what they mean at the level of individuals and society at large. Scholarship has shown how the state has the power to “make race,” and may do so through adding or changing racial categories on the census, surveys, and administrative forms (Marx 1997; Loveman 2014; Mora 2014; Gómez 2020; Nobles 2000). Our work demonstrates that the state also has the power to change the ethnoracial composition of the population by changing processing procedures of existing race data without any actual changes in individual self-identification.
We expect research to continue to explore these topics, and delve deeper into issues of societal-level change in multiracial identification, given the complex and continually changing racial and ethnic tapestry of the United States.
FOOTNOTES
↵1 The 1970 Hispanic question asked “Is this person’s origin or descent—” with response categories of Mexican, Puerto Rican, Cuban, Central or South American, Other Spanish, and No, none of these.
↵2 The 1980 Hispanic question asked “Is this person of Spanish/Hispanic origin or descent?” with response categories of No (not Spanish/Hispanic); Yes, Mexican, Mexican-American, Chicano; Yes, Puerto Rican; Yes, Cuban; Yes, other Spanish/Hispanic.
↵3 However, if the respondent only selected Some Other Race, then this coding was kept.
↵4 We use data from 2005, 2010, 2020, and 2021. We are unable to use CPS data from 2000 due to a lack of congruence in race categories and a lack of capacity to measure multiracial identification in that year. In 2000, respondents could only select White, Black, American Indian/Aleut/Eskimo or Asian or Pacific Islander. In 2003, the Asian or Pacific Islander categories were separated and respondents were able to select multiple racial identifications for the first time.
↵5 From 2003 onward, the CPS allowed respondents to select one or more from five race groups: White, Black, Asian, Hawaiian/Pacific Islander, or American Indian/Alaskan native. From 2003 to 2012, the CPS reported fourteen combinations of two to four race groups, as well as the catch-all categories of two or three races and four or five races. However, beginning in 2013, the CPS presented a new scheme that reported all of the combinations of up to four races, therefore providing a total of twenty-six reportable groups in the data. For our analysis, this change would not affect our results because we are only interested in a binary outcome of multiracial, and not the specific categories of the makeup of the multiracial groups over time (see comparability notes in documentation for variable RACE in the CPS in Flood et al. 2022).
↵6 In the 2020 ACS, many Brazilians were “misclassified” as Hispanics (U.S. Census Bureau 2022). Following procedures similar to those of Jeffrey Passel and Jens Krogstad (2023) we remove Brazilians from the Hispanic category in 2020 that reported Other in their Hispanic categorization and did not have any other specific Hispanic ancestry. This is likely an overcorrection because the Hispanic backcoding in other years was based on Hispanic write-ins, which are limited in the public use data. If anything, this would only deflate our estimates of Hispanic multiracials. Passel and Krogstad note that this likely affected “at least 416,000 Brazilians” who described themselves as Hispanic or Latino on the 2020 ACS, using country of birth and single-ancestry variables. In our estimate, we identify 419,195 Brazilians moved out of the Hispanic category. However, our estimate uses both ancestry and place of birth variables.
↵7 This is because if one of the categories is a Some Other Race write-in of a Hispanic category, the other two are presumed to be any of the remaining major racial categories.
↵8 Hispanic ancestries are noted, so Other would indicate a not otherwise categorized non-Hispanic category.
↵9 As explained regarding census changes in 2020, if someone wrote in a Latin American country or Hispanic ancestry in the race question, they were recoded as Other.
↵10 We define the 1.5 generation as having migrated to the United States prior to age eighteen. We use County Presidential Returns, 2000–2020 data from the MIT Election Data and Science Lab (2022) for the county-level partisanship measure. For ACS and CPS respondents in areas with masked county-level indicators, we aggregate democratic vote shares as a “rest of state” value for these respondents. We then create a three-way categorial indicator to segment different levels of Democratic, Republican, or swing counties with the following values of democratic vote share: less than 45 percent, 45 to 55 percent, greater than 55 percent. We note that, given the smaller sample size of the CPS, we see greater suppression of county variables in the CPS than in the ACS. Because of this suppression, we are not fully confident in the comparisons by Democratic vote share between the ACS and CPS models. However, we chose to keep this control in the model for the sake of cross dataset comparability.
↵11 This drop in multiracial identification between 2000 and 2010 aligns with the 2010 addition to the directions for the race and ethnicity questions that note “Hispanic origins are not races” (Cohn 2010).
↵12 We use 2021 data for the models due to concerns about 2020 weights.
- © 2025 Russell Sage Foundation. Ventura, Ilana M., and René D. Flores. 2025. “The ‘Rise’ of Multiracials? Examining the Growth in Multiracial Identification in the 2020 U.S. Census.” RSF: The Russell Sage Foundation Journal of the Social Sciences 11(1): 44–64. https://doi.org/10.7758/RSF.2025.11.1.03. Direct correspondence to: Ilana M. Ventura, at ventura-ilana{at}norc.org, NORC, 55 East Monroe St, 30th Floor, Chicago, IL 60603, United States.
Open Access Policy: RSF: The Russell Sage Foundation Journal of the Social Sciences is an open access journal. This article is published under a Creative Commons Attribution-NonCommercial-NoDerivs 3.0 Unported License.
REFERENCES
In this issue


Jump to section
Related Articles
Cited By...
- No citing articles found.