
Abstract
A 2015 policy change substantially increased the administrative burden involved in accessing health insurance for Pacific Islander immigrants in Hawaii. We examine the heterogeneous health-care use effects of this policy, which revoked Medicaid eligibility for these migrants and replaced it with access to subsidized private health insurance. Using data on the universe of hospitalizations and emergency room visits in Hawaii, we classify individuals as high or low risk based on their use in a baseline period. We then use a difference-in-differences strategy to estimate the effects of the policy on use, separately for low-risk and high-risk groups. The policy exacerbated health inequality: high-risk individuals experienced larger reductions in total use and larger increases in uninsured use.
Administrative burdens in health care could negatively affect health, particularly among more disadvantaged groups, through a number of channels (Herd and Moynihan 2020). In this article, we examine a 2015 policy change that substantially increased the administrative burden involved in accessing health insurance for a vulnerable migrant group in the state of Hawaii. We seek to identify whether this policy had differential effects across the health distribution to shed light on how this increased administrative burden may have affected health inequality.
Hawaii is home to many immigrants from Pacific Island nations because of a series of treaties. Specifically, under the Compacts of Free Association (COFA), citizens of the Republic of Palau, the Federated States of Micronesia, and the Republic of the Marshall Islands can migrate to and work in the United States. These COFA migrants were initially given access to the U.S. social safety net, including Medicaid, but these benefits were eventually revoked. In Hawaii, all nonpregnant adult COFA migrants who were not aged, blind, or disabled lost access to Medicaid on March 1, 2015.
When COFA migrant Medicaid benefits were revoked, they were replaced by subsidies to purchase private insurance on the marketplaces set up under the Affordable Care Act (ACA). A successful transition from Medicaid to private coverage involved overcoming a number of bureaucratic hurdles. Migrants were instructed to purchase private health insurance on the ACA exchanges. Premiums were subsidized by the state provided that the migrant’s income could be verified to be less than 100 percent of the federal poverty line and the migrant chose a Silver-level plan (Department of Human Services 2014). A critical feature of this policy change was that Medicaid has a year-round open enrollment period, whereas enrollment on the exchanges could only take place during a six-week period. In addition, COFA migrants were required to apply for Medicaid and be rejected to be eligible for subsidies to purchase private insurance plans. Even if the policy changes had been implemented smoothly and clearly communicated to those affected, they would entail greater administrative burden; imperfect implementation (resulting in confusion about the policy change) only exacerbated the burden, as discussed later.
Given these obstacles, the health of many COFA migrants deteriorated likely because they lost insurance coverage. Teresa Molina and her colleagues (2020) document the expiration of Medicaid benefits increased mortality rates for COFA migrants relative to Whites and Japanese. Results from Timothy Halliday and Randall Akee (2020) suggest that many COFA migrants lost insurance coverage after the Medicaid expiration: uninsured emergency room (ER) visits increased dramatically after the policy change relative to the same comparison group used in this article. Because COFA migrants have poorer health and higher mortality rates than the rest of the Hawaiian population, that the policy change exacerbated health inequalities across the entire population is already clear. In this article, however, we further examine distributional effects within the COFA migrant population.
Specifically, we are interested in whether this policy may have exacerbated health inequality among the COFA population. The ideal dataset for this question would include individual-level measures of health for COFA migrants (and a group of comparison individuals) spanning multiple periods before and after the policy change. Because these data are not available, we rely instead on detailed information on health-care use. We categorize COFA migrants as either high or low (health) risk based on their historical hospitalization or emergency room experiences before the policy change. We then investigate whether the transition from Medicaid to private exchanges had greater effects on the least healthy migrants. Larger drops in health-care use for the least healthy (or high-risk) migrants would suggest that the policy heightened health inequality among this population.1
It was not clear beforehand which of these groups should be most affected by the policy change. On the one hand, high-risk individuals benefit more from having insurance and might therefore be more motivated to take up private insurance despite the administrative hurdles. This reasoning is embodied in the theoretical work on ordeals and self-selection into social programs (Nichols and Zeckhauser 1982), for which empirical evidence is somewhat mixed (Alatas et al. 2016).
On the other hand, several studies suggest that these administrative burdens can be higher and more detrimental for individuals with lower incomes and less human capital (Deshpande and Li 2019; Christensen et al. 2020; Holt and Vinopal 2021; Raker and Woods 2023). Given the positive correlations between health, human capital, and socioeconomic status, this would suggest that high-risk individuals would be more negatively affected by the higher administrative burdens imposed by the 2015 policy change. Specifically, high-risk individuals who are poorer and less educated could lack the support and knowledge needed to sign up for private insurance. Although considerable outreach aimed to provide information and assistance to COFA migrants after the policy change, work has shown interventions aimed at reducing administrative burdens are often ineffective at helping the neediest (Finkelstein and Notowidigdo 2019).
To examine this question empirically, we conduct a difference-in-differences analysis, comparing changes in health-care use of COFA migrants with those of a comparison group of White and Japanese residents in Hawaii. We estimate separate effects for high-risk and low-risk individuals. We find a large reduction in total hospital charges and visits for the full sample of COFA migrants after the reduction in Medicaid benefits. Most important, this effect is much larger among the high-risk group than the low-risk group.
To what extent is this result driven by the administrative burdens required to stay insured being disproportionately onerous for high-risk individuals? Because our dataset does not record an individual’s insurance status, we instead infer how the policy affected insurance status by exploring effects on different types of use, that covered by Medicaid or private insurance as well as that not insured at all. We find that decreases in insured use (and charges) and increases in uninsured use (and charges) are substantially higher for the high-risk group, which indicates the high-risk migrant population did not effectively transition to private insurance.
Our work contributes to the growing literature on the Medicaid program. Studies of various Medicaid expansions throughout its history provide evidence that the program has generated both immediate and long-term improvements in access to health care, health outcomes, and economic outcomes (Miller and Wherry 2017, 2019; Goodman-Bacon 2018, 2021; Miller, Johnson, and Wherry 2021). Several studies examine how effects vary across age groups, gender, race, income, and state characteristics (Sommers, Baicker, and Epstein 2012; Garthwaite et al. 2019; Lee and Porell 2020; Wiggins, Karaye, and Horney 2020; Lee, Dodge, and Terrault 2021; Wright et al. 2016). A smaller set of studies focus, as we do, on heterogeneity by health status (Swaminathan et al. 2018; Winkelman and Chang 2018; Myerson and Crawford 2020) and find particularly large effects on those with chronic illness.
This article also speaks to the trade-offs between the various policy levers a government can use to expand health insurance coverage among lower-income citizens: using the public sector via government-funded health care or the private sector using a combination of mandates and subsidies. Recent work highlighting these trade-offs has typically focused on choice, adverse selection, competitive pressure, and quality of care (Aizer, Currie, and Moretti 2007; Gruber 2017; Kuziemko, Meckel, and Rossin-Slater 2018; Layton et al. 2019). In this article, we focus on a different issue: the level and nature of administrative burdens associated with each alternative.
INSTITUTIONAL SETTING
The Compacts of Free Association are treaties with three Pacific Island nations: the Republic of Palau, the Federated States of Micronesia, and the Republic of the Marshall Islands. These treaties guarantee access by the U.S. military to the territorial waters of COFA nations. In exchange, COFA migrants are allowed to enter and work in the United States. Analysis of the immigration flow from the 1990s showed positive selection on education and earnings from the Federated States of Micronesia to Hawaii (Akee 2010). Relative to the rest of the state of Hawaii population, however, COFA migrants have higher poverty levels and more severe health problems (Hagiwara et al. 2016).
The treaties also guaranteed access to the U.S. safety net. However, this access ended after what was believed to be a drafting error in the 1996 Personal Responsibility and Work Opportunity Reconciliation Act (PRWORA) (Diamond 2020). As a consequence, COFA migrants were classified as nonqualified aliens, which prohibited them from accessing U.S. welfare programs, including Medicaid.
After 1996, the state of Hawaii, which is home to a large population of COFA migrants, allowed intermittent access to its state-funded Medicaid program until federal Medicaid was reinstated for all COFA migrants by an act of the U.S. Congress in 2021. We depict some aspects of this history in a timeline in figure 1. In describing this history, we focus on the suspension of Medicaid benefits for COFA migrants in 2015.

History of Insurance Access for COFA Migrants in Hawaii
Source: Authors’ tabulation.
In 1996, the number of COFA migrants in the state was relatively small. By 2015, it had grown to 27,890, excluding Guamanian/Chamorro (Halliday and Akee 2020).2 Medicaid access was controversial in the state, however, because it was viewed as a federal rather than a state responsibility. Because of the demands of the Great Recession, the state of Hawaii denied COFA migrants access to its Medicaid program in 2009 and, instead, allowed access to a substantially less generous program, Basic Health Hawaii (BHH). The implementation of BHH was challenged in court by COFA residents and, in December 2010, a federal district court issued a preliminary injunction that restored Medicaid benefits for COFA migrants. Hawaii appealed this decision and, in April 2014, a panel of judges removed the injunction on the grounds that the text of PRWORA made COFA migrants ineligible for Medicaid, ruling that Hawaii was not legally obligated to provide any funding for Medicaid. The ruling was challenged but subsequently upheld in November 2014 by the U.S. Supreme Court, which rejected the plaintiff’s appeal.
On March 1, 2015, state-funded Medicaid benefits expired for all nonpregnant adult COFA migrants who were not aged, blind, or disabled. These migrants were instructed to purchase private health insurance on the exchanges set up under the Affordable Care Act. Premiums were subsidized by the state provided that the migrant’s income could be verified to be less that 100 percent of the federal poverty line and the migrant chose a Silver-level plan (Department of Human Services 2014).
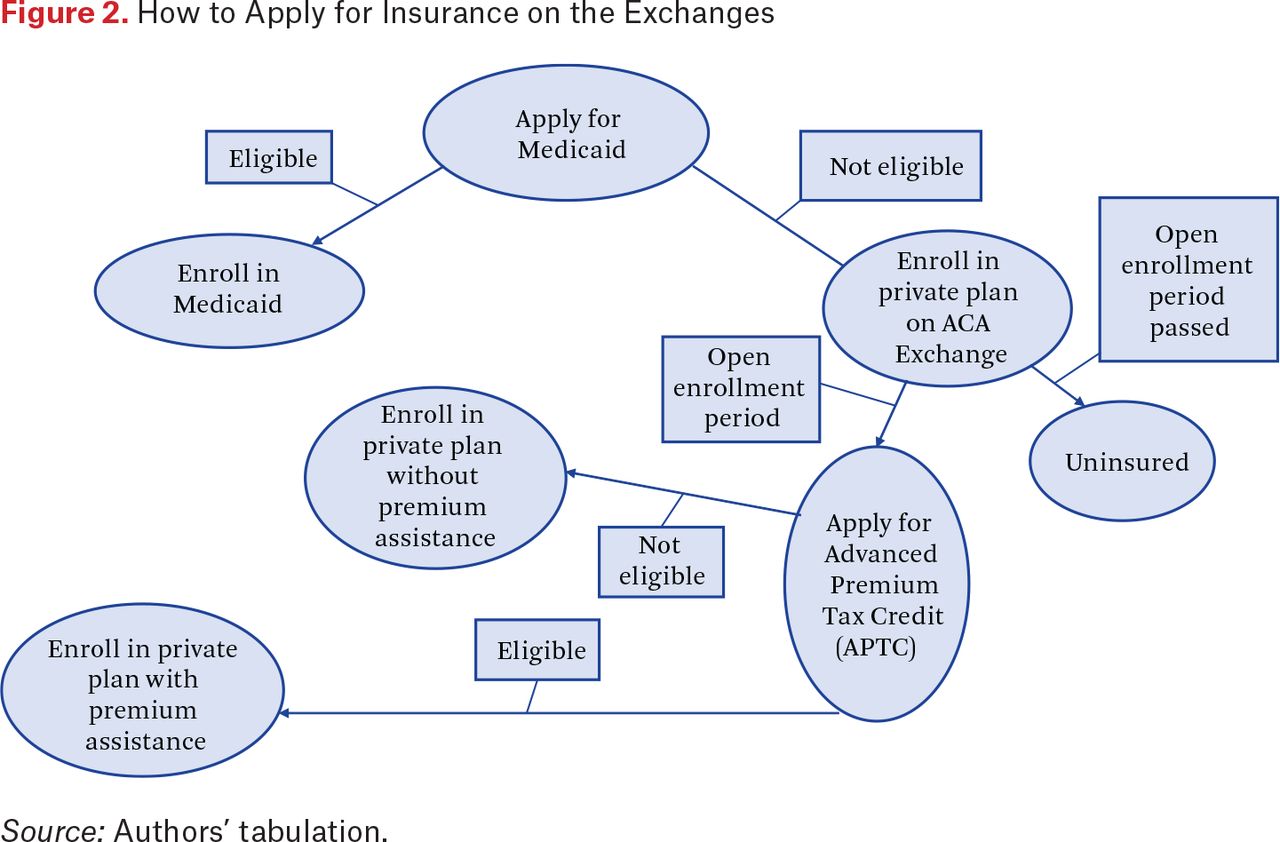
Figure 2 summarizes the post-2015 application process for COFA migrants. First, as noted earlier, COFA migrants were instructed to apply for Medicaid and be rejected in order to be eligible for private insurance on the ACA exchanges (Hofschneider 2019). Next, if the open enrollment period had not passed, COFA migrants could apply for a private plan on the exchanges. To qualify for premium assistance, COFA migrants needed to apply for an Advanced Premium Tax Credit (APTC) (Appel et al. 2017). To apply for an APTC, COFA migrants needed to have filed their federal tax returns in the previous year. However, COFA migrants often did not file federal returns in large part because they are not required to pay federal income tax because their incomes are often low. This is a common point of confusion for this population (Appel et al. 2017). Finally, if they qualified for an APTC, COFA migrants could apply for a private plan on the exchanges with premium assistance. Otherwise, they could still apply for a private plan without premium assistance.

How to Apply for Insurance on the Exchanges
Source: Authors’ tabulation.
The policy maintained COFA migrants’ access to health insurance, for which premiums continued to be fully subsidized for many of those previously eligible for Medicaid. The policy introduced, however, a number of additional administrative burdens for COFA migrants seeking to remain or become insured. All three—learning, psychological, and compliance costs (Herd and Moynihan 2018)—increased after the policy change.
With respect to learning costs, COFA migrants had to figure out both whether they were eligible for Medicaid after the policy change and how to sign up for insurance on the private exchanges. Even though community outreach efforts intended to help people enroll, confusion remained as the process was complicated. For example, anecdotal evidence suggests parents mistakenly thought their children were no longer insured because they themselves had lost coverage (Hofschneider 2019). Halliday and Akee (2020) show that the Medicaid expiration in 2015 reduced Medicaid-financed use for Micronesian children who were still eligible for public insurance. This is consistent with the idea that welfare reform can have a chilling effect or a reverse woodworking effect—that is, can reduce participation in social programs even among those still eligible.3 The Donald Trump administration’s later efforts to undermine the ACA by making large cuts to federal navigator support likely contributed to higher uninsured rates (Griffith et al. 2020), which highlights the importance of providing support throughout the enrollment process and suggests that the negative effects of the Medicaid expiration we document could have been later exacerbated by these changes.
Psychological costs were likely large. A study of COFA migrants in Arkansas revealed substantial frustration at being ineligible for Medicaid despite paying taxes to the federal government (McElfish et al. 2016). The individuals affected by the 2015 Hawaii policy change had been eligible for Medicaid for years and were now being asked to reenroll. It is also important to emphasize that COFA migrants in Hawaii face discrimination in housing, health care, and other aspects of everyday life (Inada et al. 2019; Stotzer 2019; Yamada 2011; Hofschneider 2018). Being kicked off of Medicaid by what could be viewed as discriminatory decision-making by state institutions would have further exacerbated the psychological toll of being a COFA migrant in Hawaii.
Finally, compliance costs also increased. COFA migrants were required to be turned down for Medicaid before enrolling on the HealthCare.gov website, which is not translated into any of the COFA nation languages (Hofschneider 2019; Appel et al. 2017). For those eligible for lower premiums via the APTC, in addition to the tax return requirement described, COFA migrants were required to provide an I-94 status document, which can be lost and are expensive to replace for those who acquired them before the form was digitized (Appel et al. 2017).
A related issue, and a critical feature of the policy change, was that Medicaid has a year-round open enrollment period, whereas enrollment on the exchanges could take place only during a six-week period. Before 2015, a COFA migrant who became seriously ill or injured could visit the emergency room and enroll on-site. This was no longer possible after 2015.
Halliday and Akee (2020) suspect that many COFA migrants were uninsured after the Medicaid expiration because of the increased administrative burden. Given that they do not have access to individual-level information on insurance status, their evidence for this theory comes from hospital discharge data, which shows that uninsured ER visits increased dramatically after the policy change.
DATA DESCRIPTION
We use the same hospital discharge data that Halliday and Akee (2020) did. The Hawaii Health Information Corporation (HHIC), a now defunct nonprofit company based in Honolulu, collected data on hospital discharges. The resulting dataset is a complete census of all hospitalizations and ER visits in the state.4 An important feature of the HHIC data is that it includes race-ethnicity information, including for Micronesians.
We use hospital admissions data rather than insurance claims data. This presents several limitations, including a lack of information on outpatient use and that insurance status cannot be on the right-hand side of any estimations. That is, we know only which payer paid for the use. Thus, if a person switched insurers during the sample period, it is difficult or even impossible to determine when the transition occurred.
We use data on 409,556 hospitalizations and ER visits between January 1, 2014, and December 31, 2015, for all White, Japanese, and COFA migrants. We restrict the sample to people with Hawaii addresses and those age eighteen to sixty-four, that is, the population primarily affected by the policy change. For each use, we know the source of payment: Medicaid, private insurance, or self-pay.
A critical feature of these data is that they contain an individual identifier that allows us to track use over a two-year span. We use this identifier to construct a panel where the unit of observation is an individual-month. No discharge in a given month means no use that month. We therefore code these observations as zeros. If use did occur in a month, we computed the total number of hospitalizations and ER visits in that month by payer for each individual. We did the same for the total amount of charges per individual per month in dollars. We also have the date of death for individuals in this dataset who died in hospitals. If the individual was known to have died between 2014 and 2015, the panel ends on the month and year of their death.5
The data do not include any individuals in the state who were not hospitalized or did not visit any ER over this two-year period. However, our interest in this research is to estimate the population-level effects of changing Medicaid eligibility. Therefore, we require that our data contain the entire set of observations that match the total state of Hawaii population for the relevant race groups under consideration in this analysis.
To do so, we use a procedure identical to the one used by Halliday and Akee (2020, appendix A). Essentially, we add dummy observations of zeros for never-hospitalized race, gender, and age groups. We then apply frequency weights equal to their population counts. This ensures that our data are a census of all ER and inpatient use in the state of Hawaii and that the analysis has no selection issues.
Specifically, we generate additional observations by race and ethnic groups for the individuals who do not appear in our hospitalization or ER visit dataset. The newly created observations consist of a twenty-four month string of zeros for all use and charge variables for these individuals. The purpose for adding in these additional observations is to ensure that the total population counts match that of existing data from the American Community Survey (and relevant population weights) for this period. Because the HHIC data set is a census of all hospitalizations and ER visits for the state of Hawaii over this period, adding the complementary amount of observations by race for the state of Hawaii provides us with a complete count data set. These frequencies are then distributed across age and gender for each race group.6 If the individual appears in the HHIC data, their frequency weight is unity.
After this imputation of zeros and calculation of weights, the resulting dataset is essentially an individual-level dataset recording inpatient and ER visits for all White, Japanese, and COFA individuals in Hawaii for the years 2014 and 2015. We do not have insurance status, but we do have visits and charges broken down by payer type. In our main analysis, we examine these payer types separately to make inferences about effects on insurance status.
We report descriptive statistics in table 1, summarizing use counts in columns 1 and 2 and charges in columns 3 and 4. We use frequency weights for all computations and all statistics correspond to patient-month observations. Columns 1 and 3 correspond to the full sample; columns 2 and 4 correspond to COFA migrants. We report statistics by type of visit (ER or inpatient) and payer (Medicaid, private, Medicaid and private, and self). Charges are measured in nominal dollars per patient per month.
Descriptive Statistics
A few patterns in these tables are notable. First, COFA migrants are substantially more likely to have Medicaid as a payer than private insurance than the general population. For example, the number of ER visits funded by Medicaid is 1.57 times the number of privately funded ER visits for COFA migrants (0.011 divided by 0.007) but only 0.87 times for the full sample (0.0053 divided by 0.0061). For hospitalizations, the analogous figures are 2.9 times for COFA migrants and 0.65 times for the full sample. We see a similar pattern for charges in columns 3 and 4.
Second, total insured use, defined as the sum of use funded by Medicaid and private insurance, is also higher for COFA migrants than for the full sample. The average number of total ER visits per patient-month was 0.018 for COFA migrants and 0.011 for the full sample, meaning that COFA migrants’ insured ER use was 64 percent higher than that of the general population. The corresponding statistics for hospitalization are 0.0059 for COFA migrants and 0.0028 for the full sample, indicating that COFA migrants’ insured hospitalizations were 111 percent higher.
Finally, this table provides evidence that many COFA migrants lack insurance during this period. For example, the average number of uninsured (self) ER visits for COFA migrants was 0.0057 per patient-month. This is notable given hat the average number of private insurance-funded ER visits was 0.007 per patient-month: in other words, the average number of uninsured ER visits was 81.4 percent of privately funded visits. The average number of uninsured ER visits for the full sample was 0.001 per patient-month. COFA migrants were 5.7 times more likely to have an uninsured visit to the ER than the general population.
IDENTIFYING HIGH RISK INDIVIDUALS
To shed light on whether the expiration of Medicaid benefits had different effects across the health distribution, we need a proxy for underlying health. We use insights from the risk adjustment literature (Ellis and McGuire 2007) to construct a risk score. We use this score to classify individuals as high- or low-health risk.
The goal is to create an index that is predictive of prospective health-care use and proxies for the health of an individual. Because we do not have direct measures of health, we rely on data on expenditures and use from a baseline period. Like Amy Finkelstein and Matthew Notowidigdo (2019), we assume that those with higher use are generally in worse health. Specifically, we use the first six months of the sample to construct the risk score and the remaining eighteen months to estimate our econometric models. The policy change occurred after the end of baseline sample and could not have affected the use outcomes used to construct the risk score.
The risk score is constructed using health-care-related charges that are regressed onto demographic characteristics of the individual and ER usage or hospitalization in the baseline period. Specifically, we estimate
where i corresponds to individuals and the t to months. The first term in the model is a gender-specific quadratic function of age. The second is a complete set of dummy variables for the number of ER visits in a month. The last is a complete set of dummy variables for the number of hospitalizations in a month.
We report the R2s from several estimations of equation (1) in table 2. Consistent with the risk adjustment literature, the specification with only age and gender has poor explanatory power—an R2 much less than 1 percent. In the second specification, we add ER visits as a predictor and see that the model can now explain 2 percent of the variation. Finally, we add hospitalizations and the R2 increases dramatically, to 35 percent. We use the final specification from the table for the risk score due to its superior explanatory power.
Goodness-of-Fit of Different Models
To construct the risk score, we predict charges for each individual, averaged over the six months of the baseline sample, using equation (1). In calculating these values, we are essentially combining data on age, gender, and use to create a single risk index, where the weights on each of the variables are determined by their relationship with total charges. Although not strictly necessary, we took the inverse hyperbolic sine transformation of the time averages to address the skewed charge data.
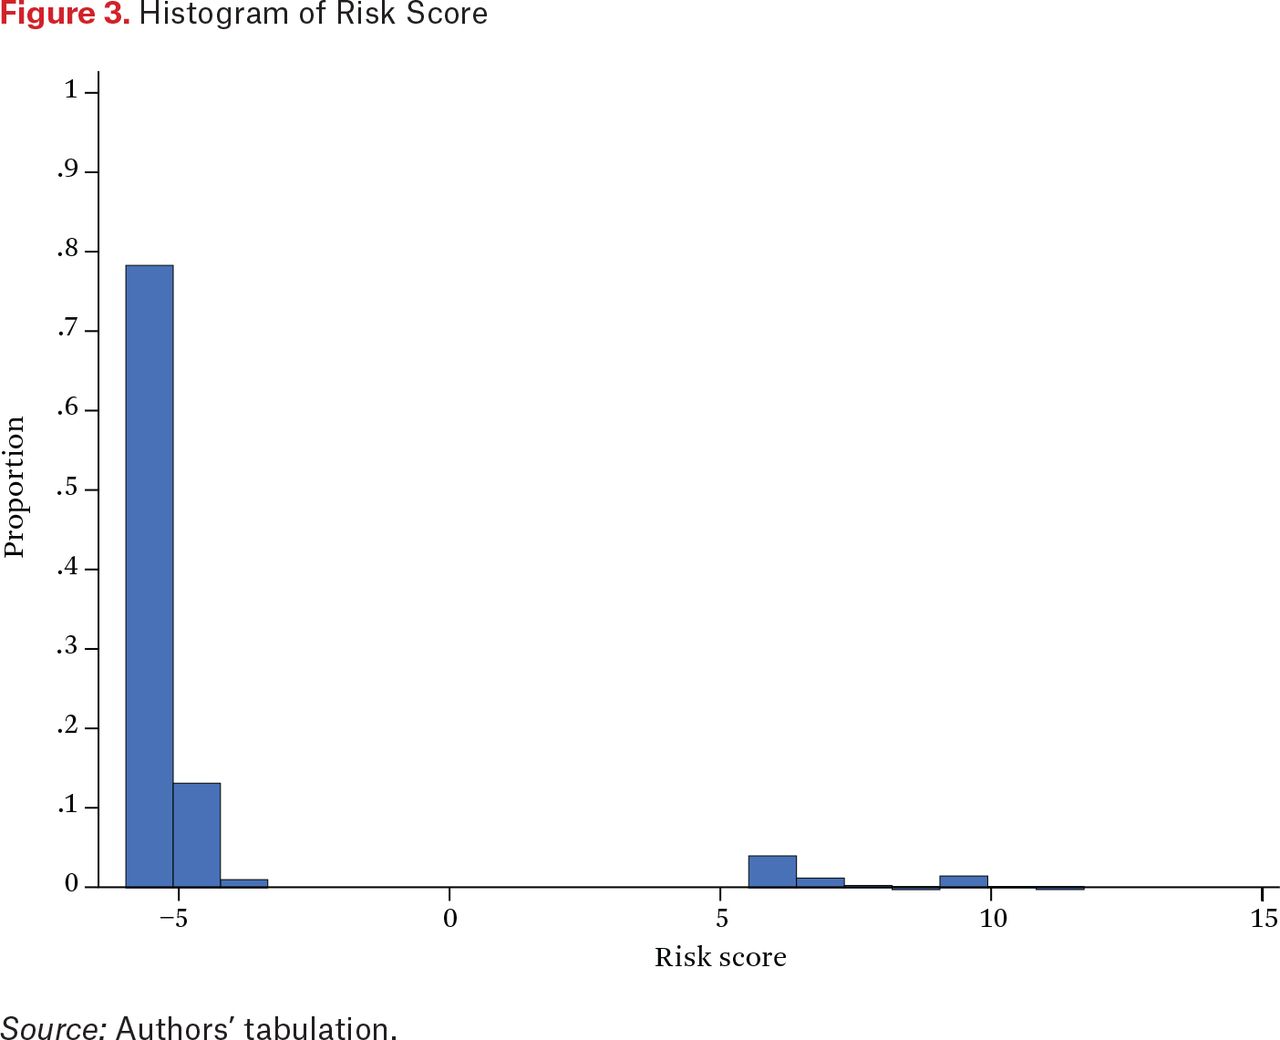
As shown in the histogram of the risk score in figure 3, the distribution is both skewed and bimodal. Roughly 93 percent of individuals have risk scores clustered around –5, and about 7 percent a score above 5. We classify individuals as high risk if their score was in the top 7 percent of the distribution and the remainder as low risk.

Histogram of Risk Score
Source: Authors’ tabulation.
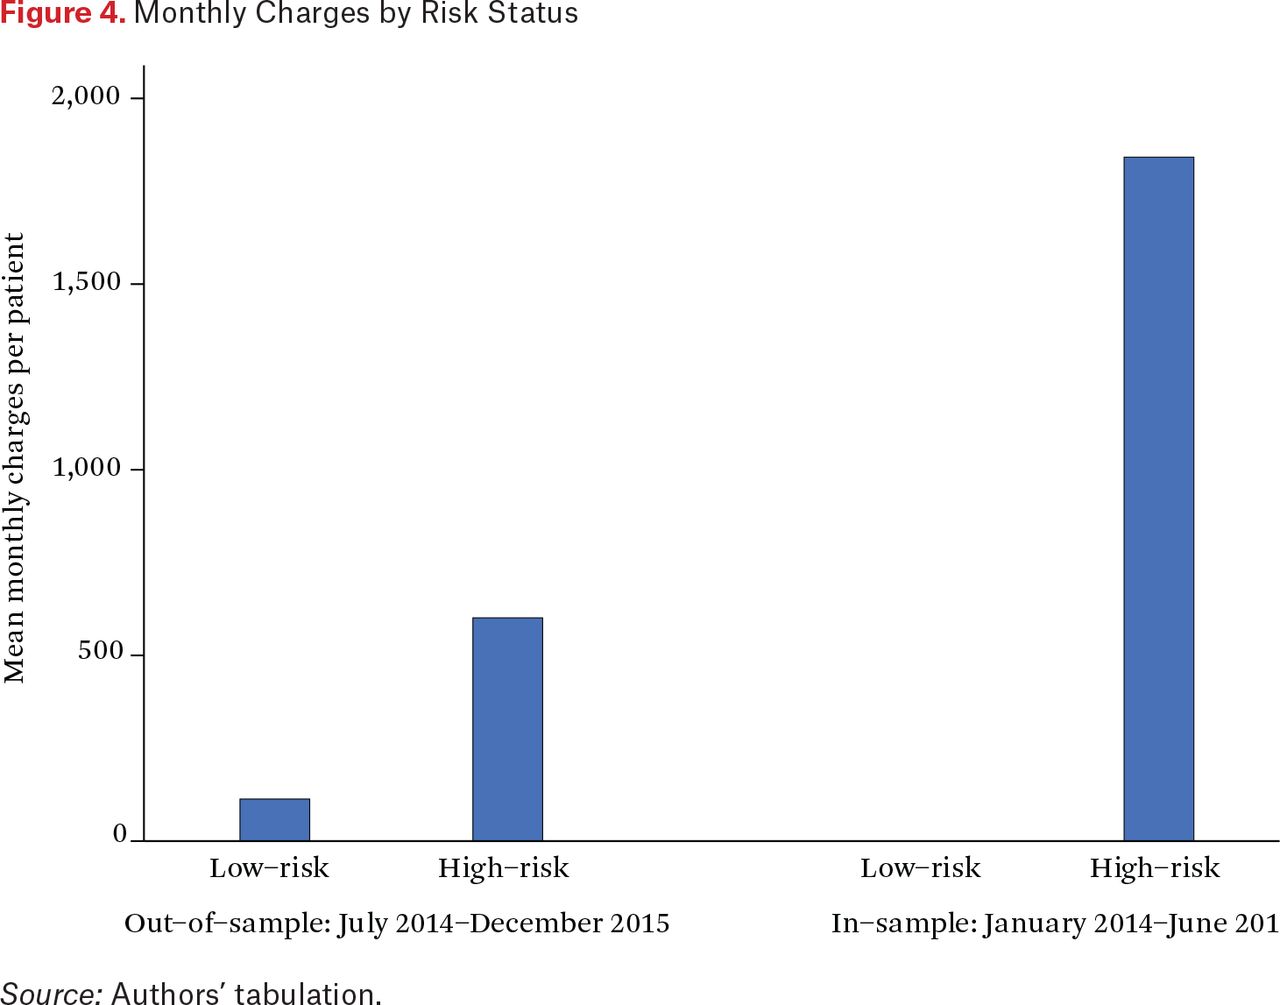
Figure 4 depicts differences in the average monthly medical expenditures by risk status. The right portion corresponds to the baseline period and thus is an in-sample prediction of charges. Average monthly charges for low-risk individuals is zero, meaning that our definition of high risk is equivalent to an indicator for positive expenditures in the baseline period. In other words, simply splitting the sample into individuals with no use and those with nonzero use in the baseline period would have resulted in the same division of groups.7 Average monthly charges for high-risk individuals is close to $2,000.

Monthly Charges by Risk Status
Source: Authors’ tabulation.
Does the risk score have predictive power? In the left portion of figure 4, we plot mean monthly charges for the estimation sample by risk status. Note that the risk score was computed using the first six months of the panel (January 2014 to June 2014), whereas the estimation sample corresponds to the final eighteen (July 2014 to December 2015). Thus the two samples do not overlap. Although the difference is less stark than for the in-sample prediction on the right, we do see that the risk score has substantial predictive power out-of-sample. Average charges for low-risk individuals is approximately $100 and average charges for high-risk individuals is around $600. A sixfold difference between the two groups remains.
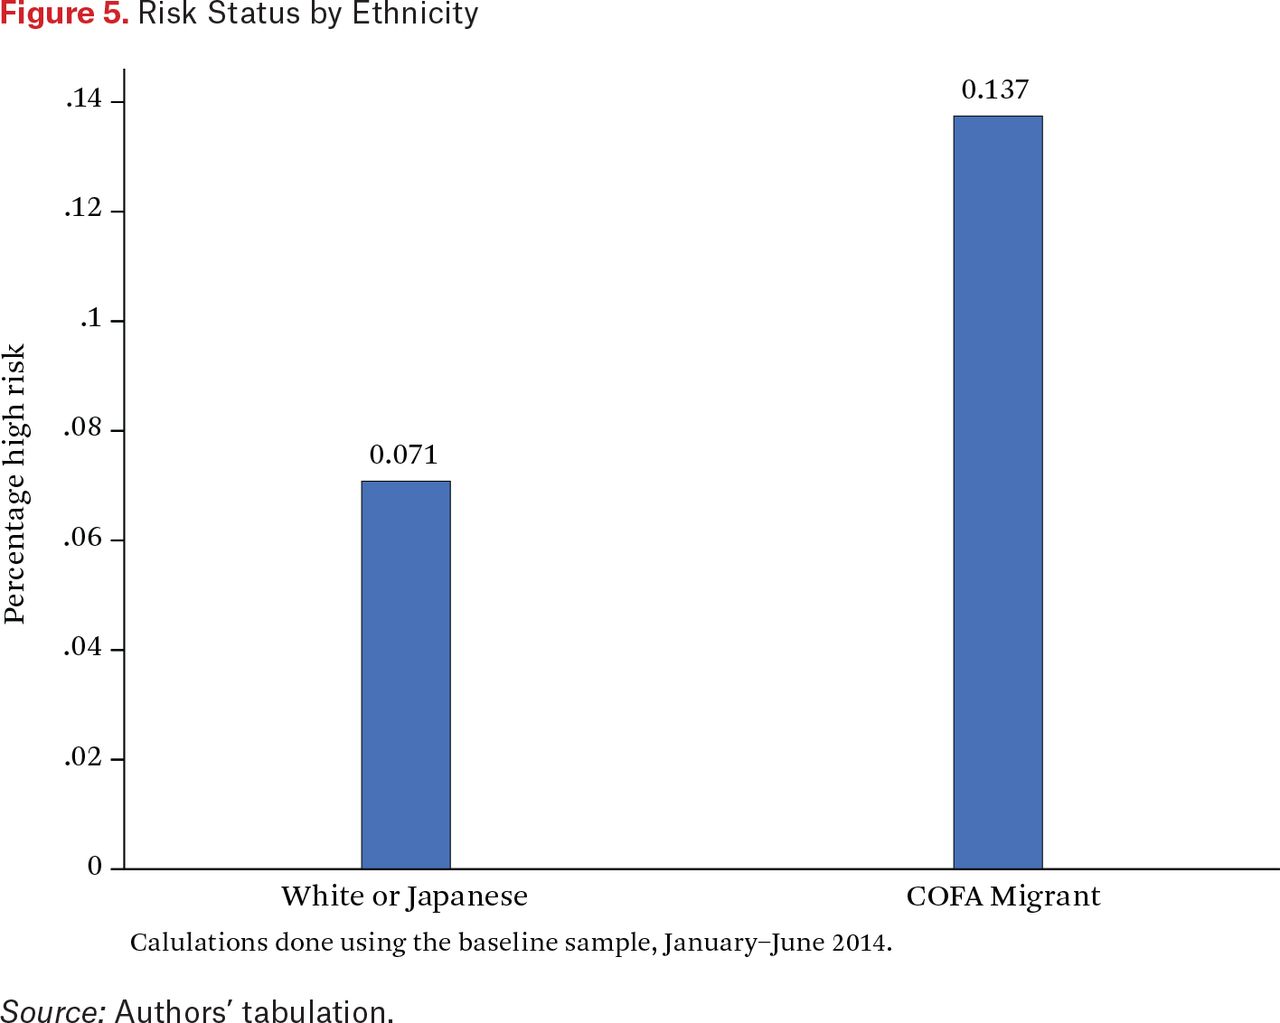
Finally, in figure 5, we plot the proportions of COFA migrants and White or Japanese people who are high risk in the baseline sample. Roughly, 7 percent of White or Japanese people are high risk. About 14 percent of COFA migrants are, however. This is broadly consistent with the descriptive statistics in table 1 showing that COFA migrants use substantially more health care than the general population.

Risk Status by Ethnicity
Source: Authors’ tabulation.
RESEARCH DESIGN AND EMPIRICAL SPECIFICATION
Our empirical analysis is based on a difference-in-differences strategy. Specifically, we examine the change in hospitalizations and emergency room visits after the expiration of Medicaid benefits for COFA migrants, separately for a treatment and a comparison group. We examine our data along a third dimension by categorizing all observations into either a high- or low-risk group, as detailed in the previous section.
Our treatment group consists of COFA migrants; our comparison group includes Whites and Japanese. COFA migrants were affected by the policy change, whereas Whites and Japanese experienced no change. We can therefore use this comparison group to provide us with an estimate of what the trends in outcomes would have looked like for COFA migrants if their Medicaid access had not been revoked. We attribute any deviation from these predicted trends by the COFA group to the policy change, which resulted in both higher administrative burdens in access to health insurance, as well as higher prices of medical care for those who lost insurance coverage.
In the following equations, the i subscript denotes individuals and t subscript denotes time periods (months). We let COFAi equal one for all COFA migrants and zero for Whites and Japanese people in Hawaii. The variable POSTt equals one for periods between March and December 2015 (the periods after which Medicaid expired) and zero for the earlier periods. The binary variable HIGHi is equal to one for individuals whom we categorize as high risk (described in the previous section). We estimate the following specification for a variety of outcome variables yit: counts and charges for hospitalizations and ER visits, the total as well as separated by payer:
As with any difference-in-differences specification, the identifying assumption is that the outcomes of the treatment group (COFA migrants) would have trended similarly to those of the comparison group (White and Japanese) if the policy change had not occurred. Under this assumption, we are able to recover the causal effect of the policy on our use and expenditure outcomes. Even though COFA migrants and the comparison individuals differ in a number of ways (socioeconomic status, health levels, insurance status, for example), the main effect of COFAi controls for these differences as long as they are fixed over our two-year study period.
The main deviation from the classic difference-in-differences is that we allow for separate estimates for high- and low-risk groups by interacting all variables with an indicator for high risk. Therefore, θLOW provides an estimate of the effect of losing Medicaid access on the low-risk group because this captures the difference between the change in outcomes for low-risk COFA migrants and the change in outcomes for low-risk comparison individuals. Meanwhile, θDIFF provides the differential effect of the policy on high-risk versus low-risk individuals. We calculate θHIGH = θLOW + θDIFF, which provides the effect of losing Medicaid access on the high-risk group. Because θHIGH is a linear combination of two regression coefficients, standard errors are calculated accordingly.
We also conduct the following event study analysis, which allows us to detect whether COFA migrant outcomes were trending differently from comparison group outcomes before the policy change. For this regression, we define dummy variables Dt, which are equal to one in month t and zero otherwise.

Once again, we calculate θHIGH,t = θLOW,t + θDIFF,t, which yields one coefficient per time period for each risk group, each of which represents the change in outcomes for the relevant risk group relative to the omitted period (February 2015).
An important feature of this design is that it allows us to assess the distributional impact of the Medicaid expiration. In particular, we are able to estimate how much of the change in use was borne by high-risk individuals. To do so, first we note that the total impact of the expiration is 0.93 × θLOW + 0.07 × θHIGH. Consequently, the proportion of the total impact borne by the sickest 7 percent of COFA migrants is
We report ρ for all of our estimations. Note that if θHIGH = θLOW then ρ = 7% and the Medicaid expiration has no distributional impact.
DIFFERENCE-IN-DIFFERENCES RESULTS
We begin with the estimation results from specification (2). Table 3 reports the results for total use and charges, separately for ER and inpatient. Tables 4 to 7 repeat this analysis for different payers: Medicaid, private, Medicaid plus private, and self. Each table reports three parameters of interest: the estimated effect of the policy for the low-risk group (θLOW), the effect for the high-risk group (θHIGH), and the difference between the two (θDIFF). The first two columns examine use counts (multiplied by one hundred for readability), and should be interpreted as the effect of the Medicaid expiration on use per hundred people. Columns 3 and 4 report results for charges in dollars. For each regression, we report the means of the dependent variables for the COFA population between July 2014 and February 2015, before the Medicaid expiration. This will allow us the measure the impact of the policy change relative to the pre-policy means.
Impact of Medicaid Expiration on Utilization and Charges by Risk Status: Total
Impact of Medicaid Expiration on Utilization and Charges by Risk Status: Medicaid
Impact of Medicaid Expiration on Utilization and Charges by Risk Status: Private
Impact of Medicaid Expiration on Utilization and Charges by Risk Status: Medicaid + Private
Impact of Medicaid Expiration on Utilization and Charges by Risk Status: Self
Our first finding is that the Medicaid expiration reduced the total number of ER visits for both low and high risk COFA migrants (as shown in column 1 of table 3). This reduction was significantly larger for high-risk than for low-risk individuals. To put the magnitudes of the coefficients into perspective, we compare each group’s coefficients with the (group-specific) mean of the dependent variable in the pre-period. The effect of the policy was only 3.5 percent of average ER use for low-risk individuals but 15 percent for high-risk individuals.
Coefficient estimates for total inpatient visits are also negative (column 2), though less precisely estimated. The reduction for the high-risk group was larger in magnitude but not significantly different from zero or from the low-risk coefficient. We find a similar pattern of results in the regressions on total charges (columns 3 and 4).
Why did the Medicaid expiration lead to reductions in ER and inpatient use? First, the Medicaid expiration essentially made obtaining insurance more costly, primarily in terms of time and effort. COFA migrants who wanted to stay insured had to enroll in one of the private insurance plans via the ACA exchange, and enrollment was restricted to a six-week period. Moreover, COFA migrants were required to enroll and be denied Medicaid coverage to enroll in private plans. For people who chose not take up private insurance after their Medicaid benefits expired, this policy effectively led to an increase in the price of health care.
The finding that high-risk individuals reduced their use more than low-risk individuals could have been due to a lower propensity to take up private insurance after losing Medicaid, greater sensitivity to health-care prices, or a combination. To shed light on the precise mechanisms, we examine use and charges separately for each of the following payers: Medicaid, private, Medicaid and private, and self.
Overall, we see that the Medicaid expiration shifted the payer from Medicaid to private insurance. Estimates in table 4, which report effects on Medicaid use and charges, are negative and highly significant. At the same time, estimates in table 5 indicate that privately funded use increased, although the magnitudes of the increases are smaller than the declines in Medicaid-funded use and charges. This shift in payers occurred for both high- and low-risk individuals.
More important, table 6 shows that insured ER visits and hospitalizations covered by either Medicaid or private insurance declined on net, and these impacts were substantially larger for high-risk people. In this table, the dependent variable is the sum of visits and charges funded by both Medicaid and private insurance.8 The net decline in insured ER visits is statistically significant (p < .01) for both risk types. On net, insured ER visits declined by 0.35 for low-risk individuals and 1.76 for high-risk individuals per hundred patients per month (column 1). As a percentage of the means in the pre-period, these declines are 7 percent for low-risk people and 29 percent for high-risk people. We see similar effects for hospitalizations in column 2. On net, hospitalizations declined by 0.06 (p < .1) and 0.29 (p < .05) for low- and high-risk people, respectively. These estimates are 3 percent and 18 percent of their pre-policy means. Finally, we see similar patterns for charges (columns 3 and 4 of table 6).
That the decline in insured use was larger for high-risk individuals suggests they were less likely to switch to private insurance after their Medicaid benefits expired. This is despite these individuals having a greater need for health insurance given their high use before the policy. Risk status is likely correlated with income and education, which in turn are likely to be important determinants of awareness of the policy and ability to enroll in private insurance. This could explain why private insurance failed to make up for the decline in Medicaid-covered use, particularly in the high-risk group.
Even though these results suggest that high-risk types faced greater obstacles to obtaining private insurance, it is still possible that their larger reductions in total use were driven in part by greater price sensitivity. In particular, high-risk individuals could have been more price elastic if much of their health-care use prior to the policy was unnecessary overuse. To investigate the plausibility of this explanation, we examine uninsured use and charges as the last outcome variables in table 7. If high-risk individuals had substantial unnecessary care before the Medicaid expiration, we might expect to see their total use go down (as we found earlier), but should not see increases in uninsured use.
The results in table 7 show that the Medicaid expiration increased uninsured ER visits and hospitalizations for high-risk individuals, and these increases were larger than for low-risk individuals. In column 1, we see that uninsured ER visits increased by 0.13 (p < .01) for low-risk individuals and 0.55 (p < .01) for high-risk per hundred patients per month. As percentages of their pre-policy means, these effects are, respectively, 7 percent and 56 percent. In column 2, we see that uninsured hospitalizations increased only for high-risk individuals. Uninsured hospitalizations increased by 0.07 (p < .05), which was 117 percent of its pre-policy mean. Similar patterns are found for charges (in columns 3–4). In sum, it is unlikely that the more drastic reduction in use for high-risk individuals was due to substantial overuse before the policy change. All told, the Medicaid expiration disproportionately affected the most vulnerable migrants. This is evident looking at estimates of ρ in tables 3 through 7, which indicate that between 17 and 33 percent of the total effect of the Medicaid expiration was borne by high-risk people, much higher than the 7 percent we would expect if low-risk and high-risk groups were equally affected. In column 4 of tables 3 and 6, and column 2 of table 7, we see that the entire increase in total inpatient charges, Medicaid or private inpatient charges, and uninsured hospitalizations were driven by high-risk migrants.9
EVENT STUDY RESULTS
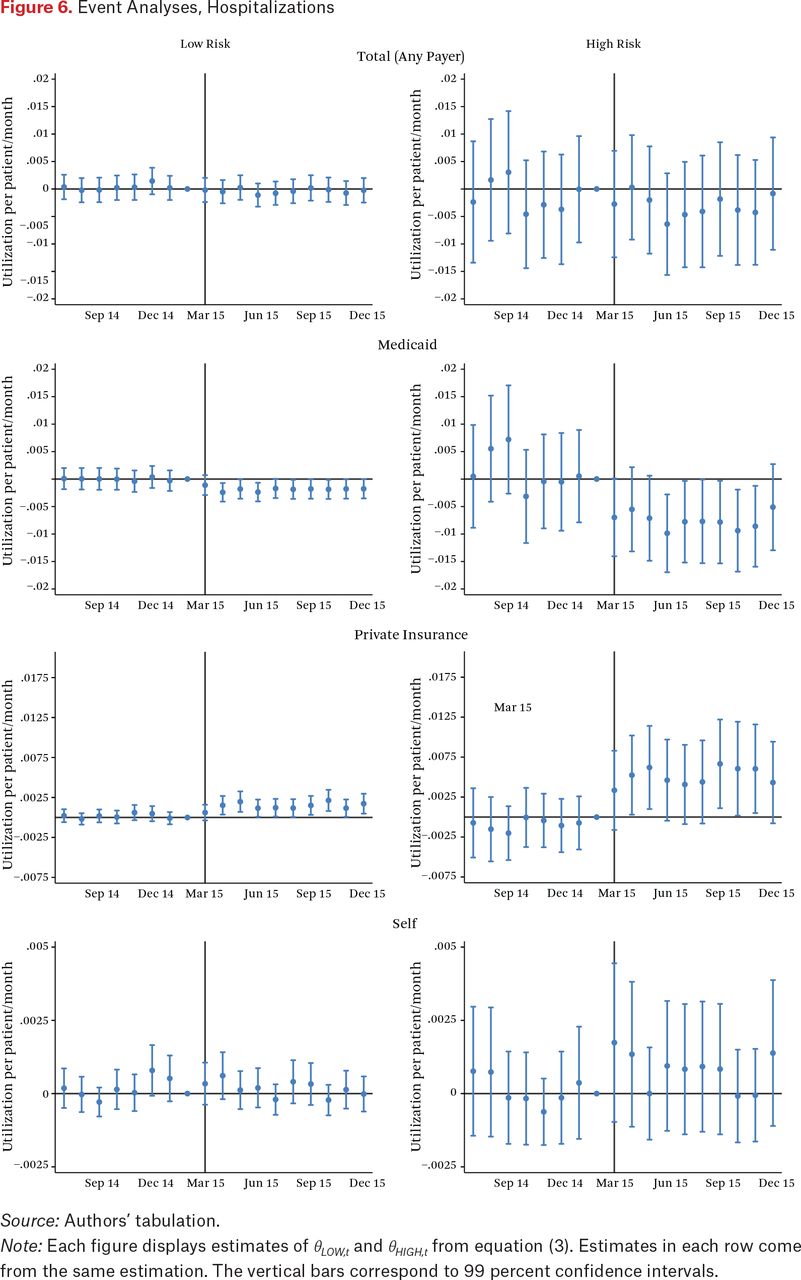
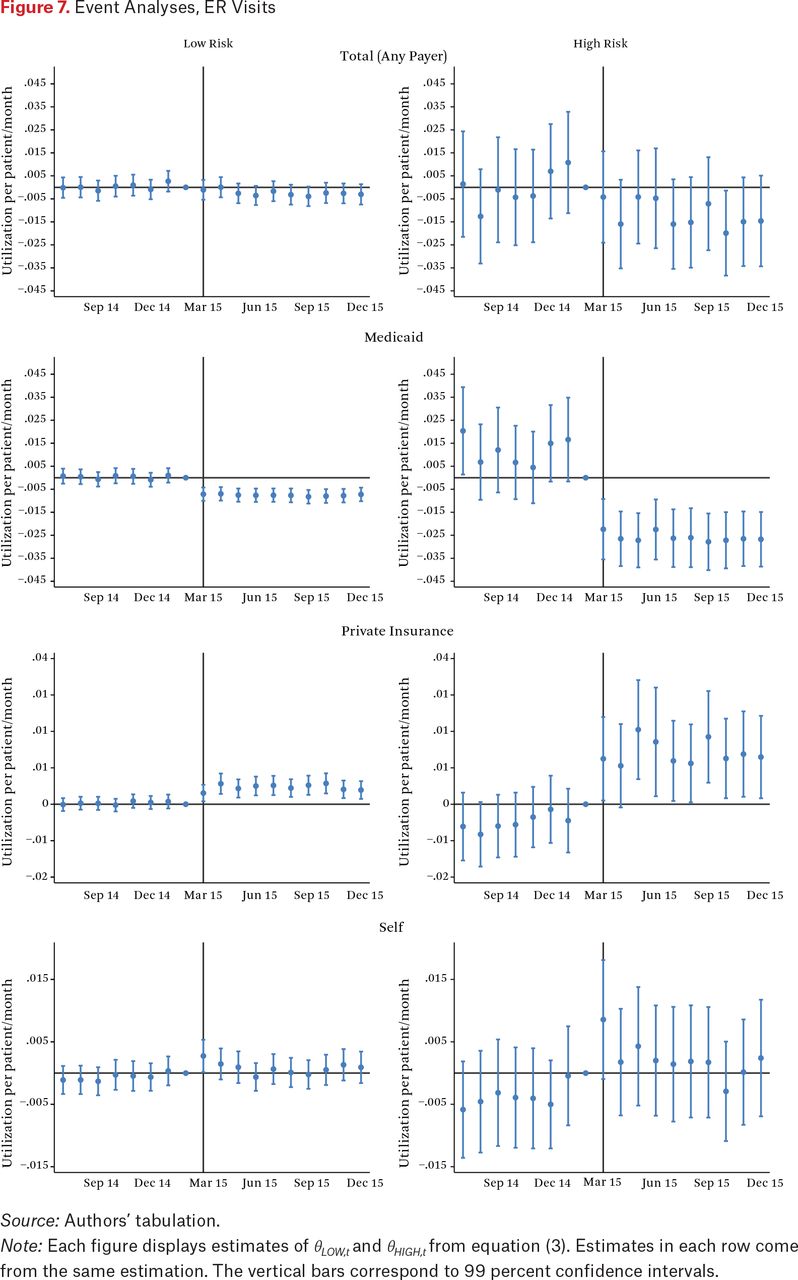
We next show the results of the event study analysis in equation (3), which helps assess the validity of our empirical strategy. Specifically, it helps identify any differences in the pre-trends of COFA migrants and our comparison group, which would indicate a potential violation of our parallel trends assumption. In addition, this event study analysis sheds light on any potential anticipation effects. Because the policy change was announced in November 2014, COFA migrants could have started adjusting their health-care use at this time, in preparation for the future loss of Medicaid eligibility. We plot each of the estimated θHIGH,t and θLOW,t coefficients and their confidence intervals in figure 6 for hospitalizations and figure 7 for ER visits. Each figure contains six plots corresponding to each payer (any payer, Medicaid, private, or self) and risk type (high or low).

Event Analyses, Hospitalizations
Source: Authors’ tabulation.
Note: Each figure displays estimates of θLOW,t and θHIGH,t from equation (3). Estimates in each row come from the same estimation. The vertical bars correspond to 99 percent confidence intervals.

Event Analyses, ER Visits
Source: Authors’ tabulation.
Note: Each figure displays estimates of θLOW,t and θHIGH,t from equation (3). Estimates in each row come from the same estimation. The vertical bars correspond to 99 percent confidence intervals.
On the whole, the figures suggest no pre-trend differences between COFA migrants and the comparison group in either risk category. This is particularly true for hospitalizations. For Medicaid-funded ER visits for high-risk migrants (second from the top right of figure 7), the pre-policy coefficients are all larger than zero (though mostly insignificant). This could potentially be the result of COFA migrants responding in the month before their Medicaid benefits officially expired rather than the month it did expire. Uncertainty about the official expiration date could have led to an earlier response. None of these figures show signs of any discontinuities around the time of the November 2014 announcement, which suggests limited response to this initial announcement, perhaps a sign of the general confusion and limited awareness at the time.
These figures also reiterate the findings of the previous tables. After the policy change, we see a decrease in Medicaid-covered use, an increase in private-funded use, and an increase in self-funded use. Across all outcome variables, effects are larger for the high-risk groups.
CONCLUSION
Our analysis focused on the effect of moving individuals off publicly provided health-care coverage to privately provided insurance. In particular, we were concerned with whether this had differential impacts across the health distribution. We separate our sample into a high-risk and a low-risk group using data from a period preceding the change in coverage. We might expect individuals in the high-risk group who have existing health conditions to be especially and adversely affected by changes in coverage. This would be especially problematic if these obstacles to the new coverage are highly correlated with individual income, resources, or skills.
We find that eliminating Medicaid benefits for COFA migrants in the state of Hawaii resulted in more use paid by private insurance and less paid by Medicaid, as expected. In addition, we find that on net the policy reduced inpatient and ER use for COFA migrants. Accordingly, access to subsidized private insurance via the ACA exchanges is an imperfect substitute for Medicaid eligibility.
The reduction is most pronounced for the high-risk individuals in our data, for whom we see even larger decreases in use. High-risk individuals also experienced larger increases in uninsured use. In other words, this policy exacerbated health inequalities. The finding that high-risk individuals reduced their use more than low-risk individuals did in response to an increase in administrative burden contradicts theories predicting that those in greater need should be more likely to go through an ordeal to access a program. Instead, our results are consistent with several empirical studies documenting higher and more consequential administrative burden for individuals with lower income and human capital (Deshpande and Li 2019; Christensen et al. 2020; Holt and Vinopal 2021; Raker and Woods 2023).
Overall, we contribute to the literature on health-care coverage and low-income populations. We show that the method of health-care coverage may matter on average for these populations.
Additionally, some of the most disadvantaged portions of the low-income population may be particularly vulnerable if enrollment or access to the new source of health-care coverage (private insurers) is related to an individual’s abilities or resources. The equity-efficiency trade-off in the method of the provision of health-care coverage is not easily remedied. Although we do not have definitive evidence for the cause for these differences, the relatively short enrollment window for private health insurance coverage may play an important role in discouraging complete uptake by these high-risk populations (Kamstra, Molina, and Halliday 2021). Other researchers show that administrative burden associated with medical services can delay patient care partially or completely because of difficulties with administrative tasks (Kyle and Frakt 2021). Jeffrey Kullgren and his colleagues (2012) estimate that more than 20 percent of U.S. adults faced nonfinancial barriers to care that resulted in unmet health care or delayed access.
We also contribute to the small, but emerging literature examining the health outcomes for COFA migrants in Hawaii and other locations in the United States. Pearl McElfish and her colleagues (2016) show, through structured interviews with Marshallese COFA migrants residing in Arkansas, that this population has similarly been denied by virtue of their non-eligible immigrant status eligibility for Medicaid or Medicaid expansion despite their relatively low incomes. As a result, this population has not realized a dramatic reduction in their uninsured rate. These lower rates of coverage translate directly into poorer health outcomes. Wendy Nembhard and her colleagues (2019) show that pregnant Marshallese women tend to have a higher prevalence of other medical risk factors than pregnant non-Hispanic White women in Arkansas.
Finally, future work should also investigate the effect that these differences in health insurance coverage have for other long-term outcomes. It is currently not known how this reduction in coverage and access affected death rates across the health distribution. Are the high-risk individuals who no longer have health-care coverage more likely to die following their reduction in ER use and hospitalization? Alternatively, if they are not dying, does this reduction in health-care access affect their ability to work and take care of their families? We do not have the relevant data currently, but understanding how these important other outcomes are affected will go a long way in estimating the true cost of this change in COFA migrants’ health-care access.
FOOTNOTES
↵1. Previous work shows that among COFA migrants as a group health-care use decreased and mortality increased (Halliday and Akee 2020; Molina et al. 2020), suggesting that reductions in health-care use have serious negative consequences for this population. We therefore equate larger drops in use with more severe deterioration of health, implying that larger effects on the high-risk group signal a worsening of health inequality.
↵2. The discussion in this section is based on a study by Pearl McElfish, Emily Hallgren, and Seiji Yamada (2015).
↵3. This is an issue with somewhat mixed evidence (Lurie 2008; Borjas 2001; Fix and Passel 1999; Van Hook 2003).
↵4. Our data do not include information from Tripler Army Medical Center because the race and ethnicity data that we rely on are not available for this provider.
↵5. A weakness of these data is that we do not know death dates for people who did not die in a hospital.
↵6. Using the American Community Survey (ACS) to obtain population counts of certain groups, particularly small groups, will likely yield errors (Halliday and Akee 2020). Consequently, we use ACS five-year averages for more reliable estimates.
↵7. Because this is unlikely to be true in all settings, we have included the description of our risk score calculation for those who may want to replicate this using other samples or data.
↵8. These estimations are in a sense redundant as they are mechanically the sum of the estimates in tables 4 and 5. However, estimating these models allows us to test whether the net changes are significant, which cannot be done simply by looking at the difference in the two tables.
↵9. We did not compute ρ because the estimate for low-risk migrants had the opposite sign as the estimate for high-risk migrants.
- © 2023 Russell Sage Foundation. Akee, Randall Q., Timothy J. Halliday, and Teresa Molina. “Replacing Medicaid with an Imperfect Substitute: Implications for Health Inequality.” RSF: The Russell Sage Foundation Journal of the Social Sciences 9(4): 61–83. DOI: 10.7758/RSF.2023.9.4.03. We thank Nicholas Ziebarth and seminar participants at Hitotsubashi University, Essen Health Conference, and RSF for useful comments. Direct correspondence to: Randall Q. Akee, at rakee{at}ucla.edu, 6367 Public Affairs; 337 Charles E Young Dr E, Los Angeles, CA 90095, United States; Timothy J. Halliday, at halliday{at}hawaii.edu, 2424 Maile Way; 533 Saunders Hall; Honolulu, HI 96822, United States; Teresa Molina, at tmolina{at}hawaii.edu, 2424 Maile Way; 515A Saunders Hall; Honolulu, HI 96822, United States.
Open Access Policy: RSF: The Russell Sage Foundation Journal of the Social Sciences is an open access journal. This article is published under a Creative Commons Attribution-NonCommercial-NoDerivs 3.0 Unported License.
REFERENCES
In this issue


Jump to section
Related Articles
Cited By...
- No citing articles found.