
Article Figures & Data
Figures
- Figure 1.
Monetary Eligibility and Alternative Base Periods
Source: U.S. Department of Labor 2020.
Note: The height of each bar represents the minimum income a worker needed to earn to qualify for unemployment insurance. The dark bars represent states with Alternative Base Periods and the light bars represent states that do not have alternative base periods.
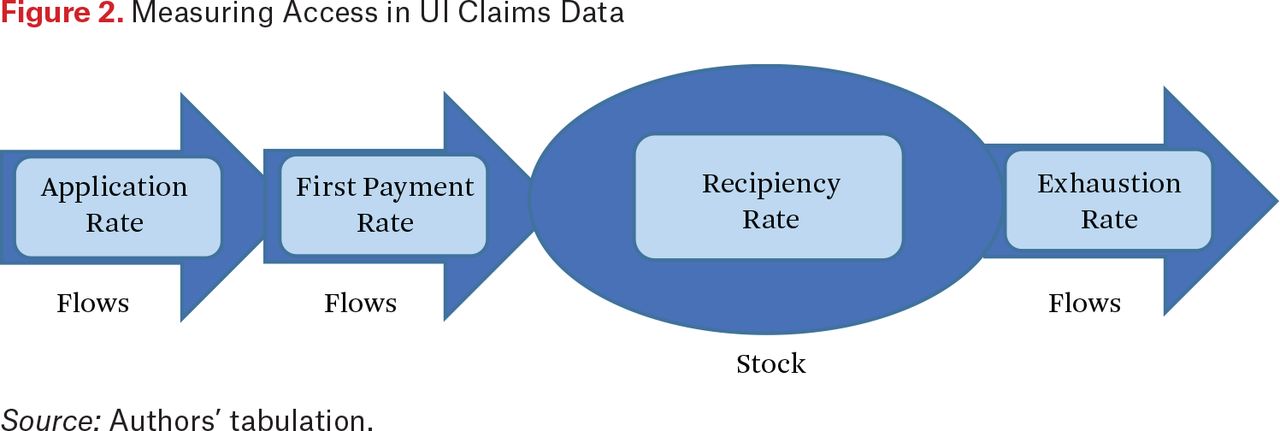
- Figure 2.
Measuring Access in UI Claims Data
Source: Authors’ tabulation.
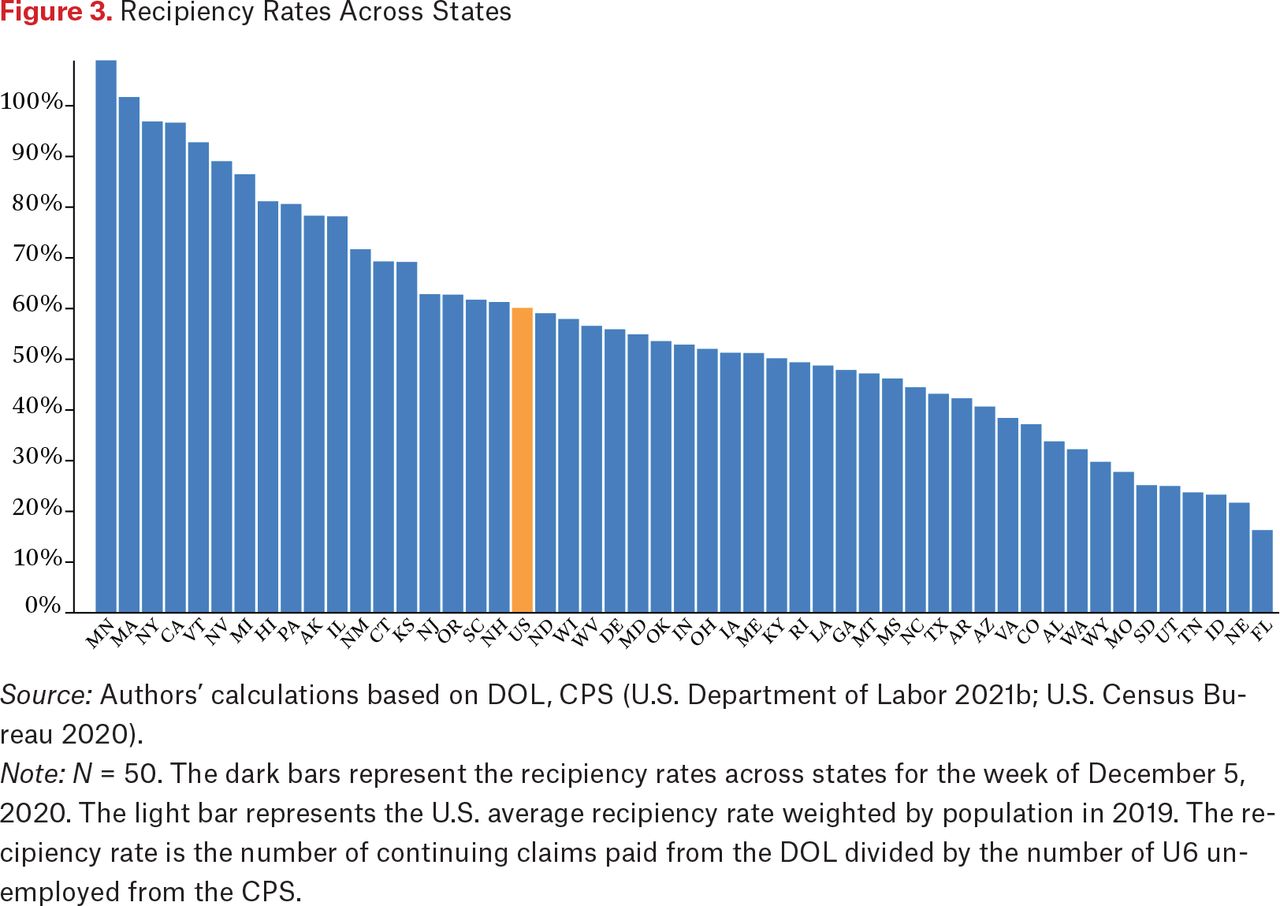
- Figure 3.
Recipiency Rates Across States
Source: Authors’ calculations based on DOL, CPS (U.S. Department of Labor 2021b; U.S. Census Bureau 2020).
Note: N = 50. The dark bars represent the recipiency rates across states for the week of December 5, 2020. The light bar represents the U.S. average recipiency rate weighted by population in 2019. The recipiency rate is the number of continuing claims paid from the DOL divided by the number of U6 unemployed from the CPS.
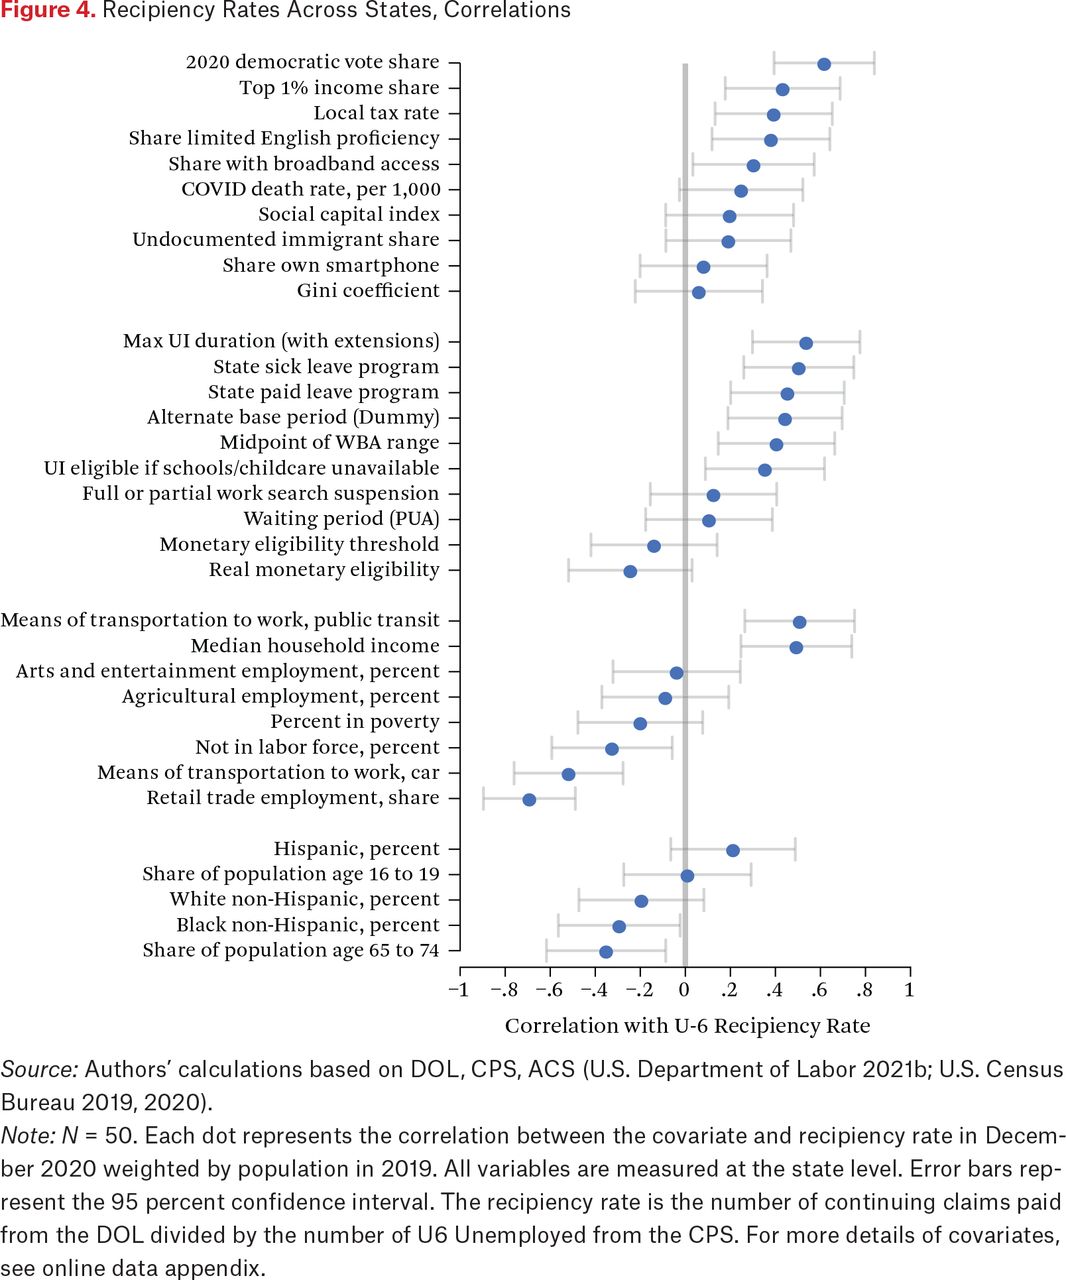
- Figure 4.
Recipiency Rates Across States, Correlations
Source: Authors’ calculations based on DOL, CPS, ACS (U.S. Department of Labor 2021b; U.S. Census Bureau 2019, 2020).
Note: N = 50. Each dot represents the correlation between the covariate and recipiency rate in December 2020 weighted by population in 2019. All variables are measured at the state level. Error bars represent the 95 percent confidence interval. The recipiency rate is the number of continuing claims paid from the DOL divided by the number of U6 Unemployed from the CPS. For more details of covariates, see online data appendix.
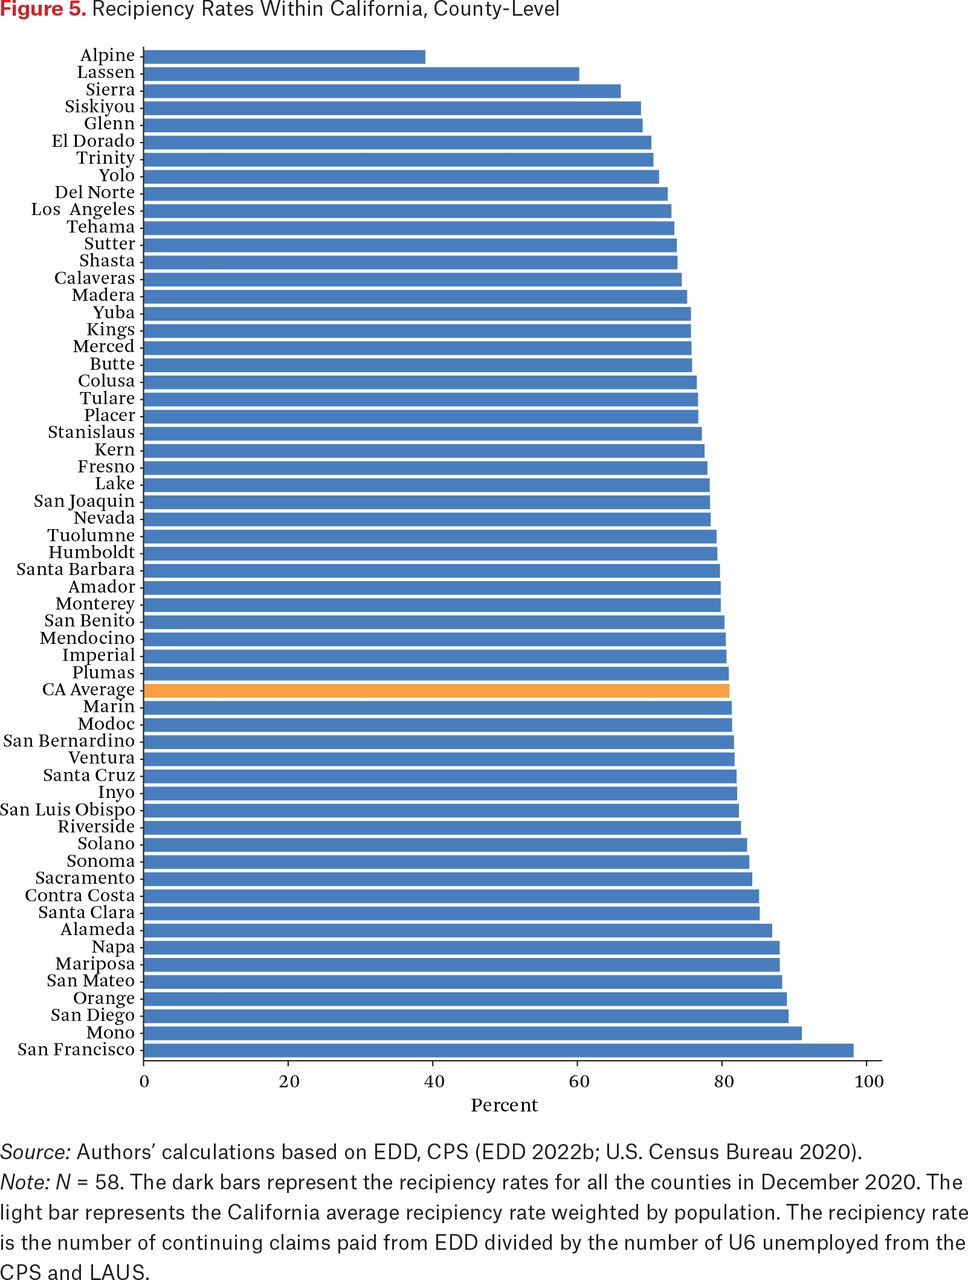
- Figure 5.
Recipiency Rates Within California, County-Level
Source: Authors’ calculations based on EDD, CPS (EDD 2022b; U.S. Census Bureau 2020).
Note: N = 58. The dark bars represent the recipiency rates for all the counties in December 2020. The light bar represents the California average recipiency rate weighted by population. The recipiency rate is the number of continuing claims paid from EDD divided by the number of U6 unemployed from the CPS and LAUS.
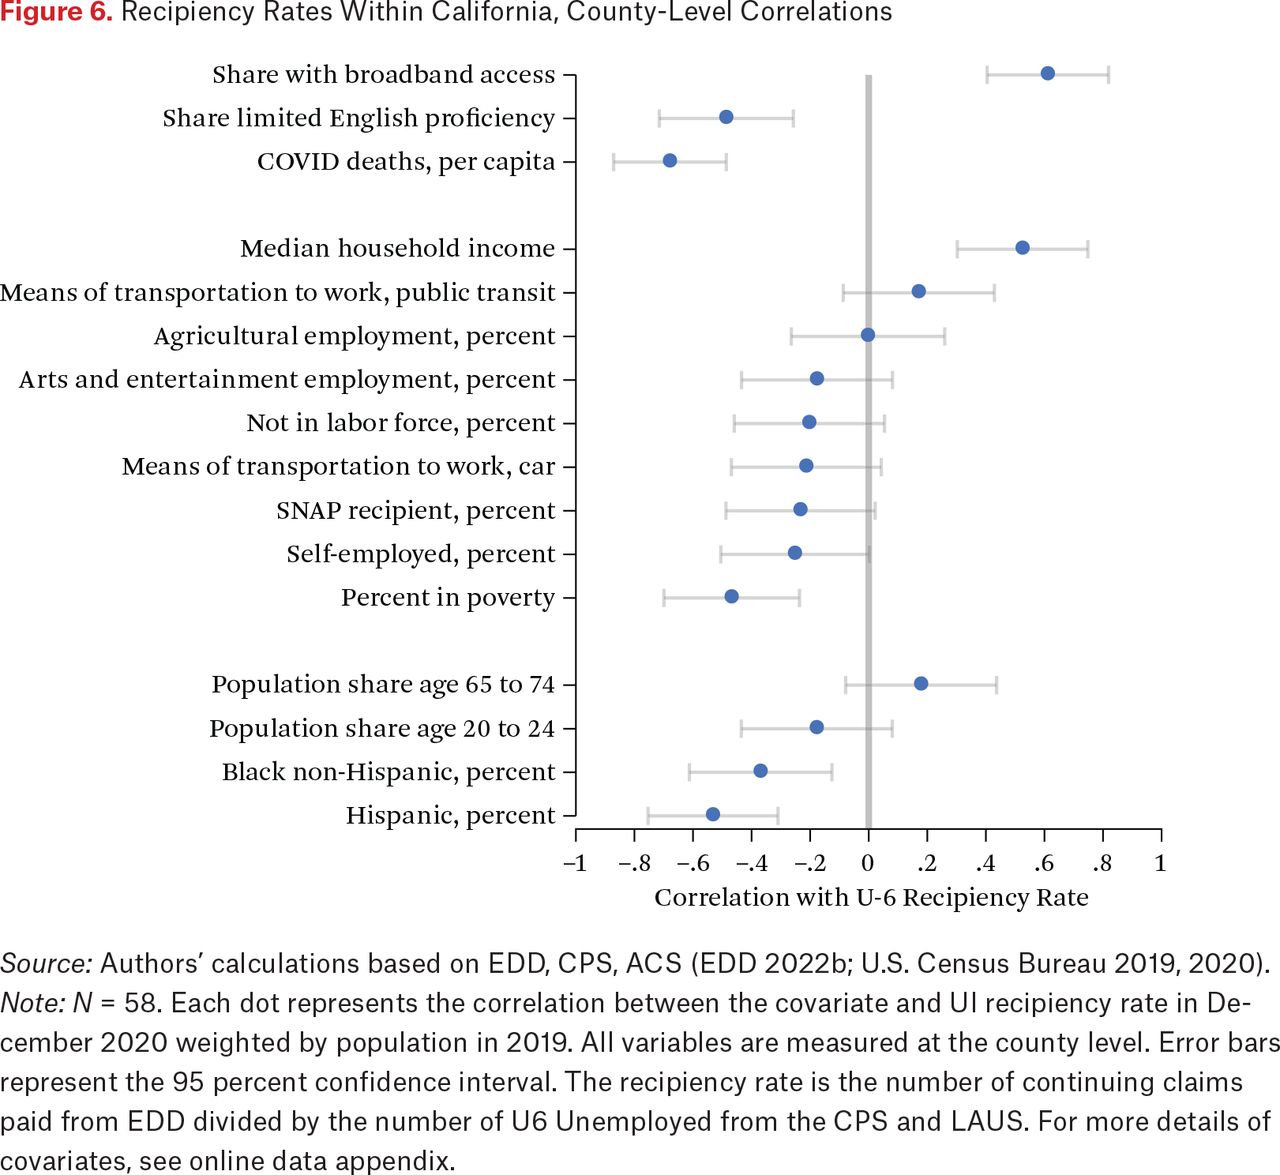
- Figure 6.
Recipiency Rates Within California, County-Level Correlations
Source: Authors’ calculations based on EDD, CPS, ACS (EDD 2022b; U.S. Census Bureau 2019, 2020).
Note: N = 58. Each dot represents the correlation between the covariate and UI recipiency rate in December 2020 weighted by population in 2019. All variables are measured at the county level. Error bars represent the 95 percent confidence interval. The recipiency rate is the number of continuing claims paid from EDD divided by the number of U6 Unemployed from the CPS and LAUS. For more details of covariates, see online data appendix.
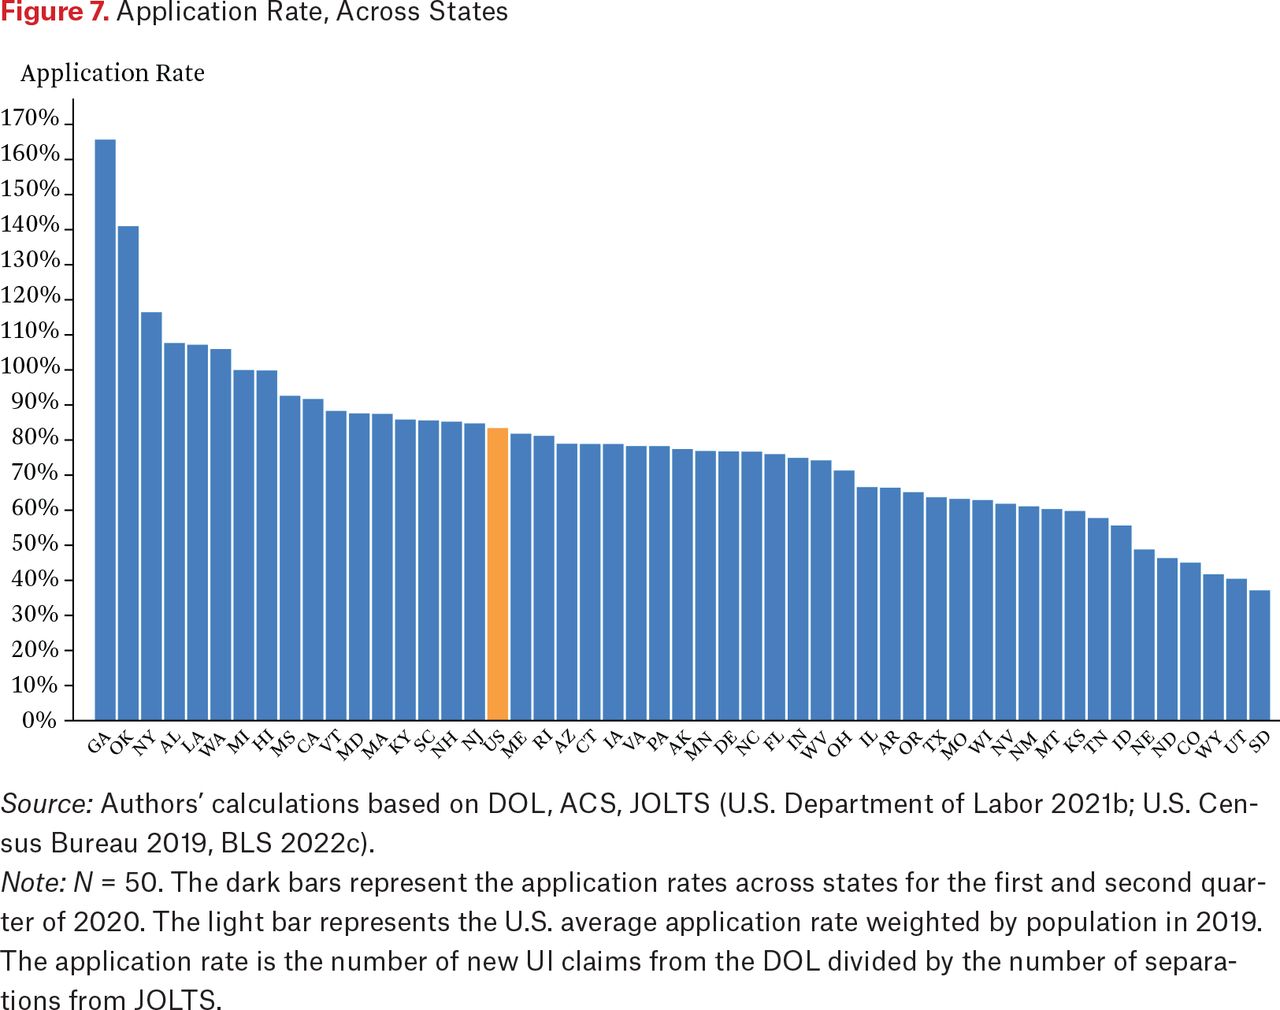
- Figure 7.
Application Rate, Across States
Source: Authors’ calculations based on DOL, ACS, JOLTS (U.S. Department of Labor 2021b; U.S. Census Bureau 2019, BLS 2022c).
Note: N = 50. The dark bars represent the application rates across states for the first and second quarter of 2020. The light bar represents the U.S. average application rate weighted by population in 2019. The application rate is the number of new UI claims from the DOL divided by the number of separations from JOLTS.
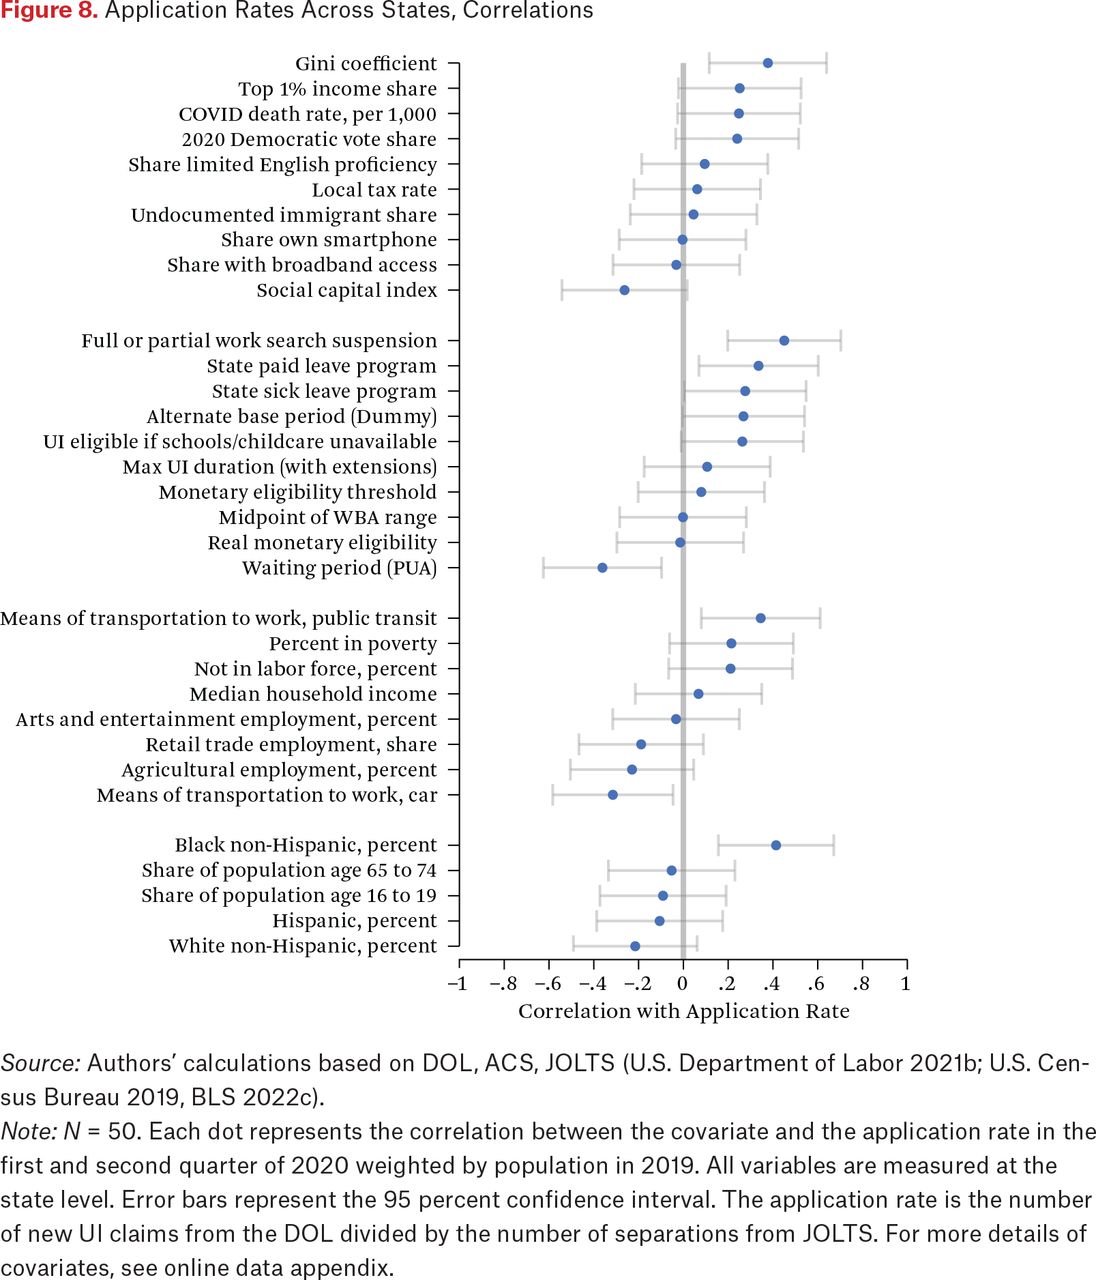
- Figure 8.
Application Rates Across States, Correlations
Source: Authors’ calculations based on DOL, ACS, JOLTS (U.S. Department of Labor 2021b; U.S. Census Bureau 2019, BLS 2022c).
Note: N = 50. Each dot represents the correlation between the covariate and the application rate in the first and second quarter of 2020 weighted by population in 2019. All variables are measured at the state level. Error bars represent the 95 percent confidence interval. The application rate is the number of new UI claims from the DOL divided by the number of separations from JOLTS. For more details of covariates, see online data appendix.
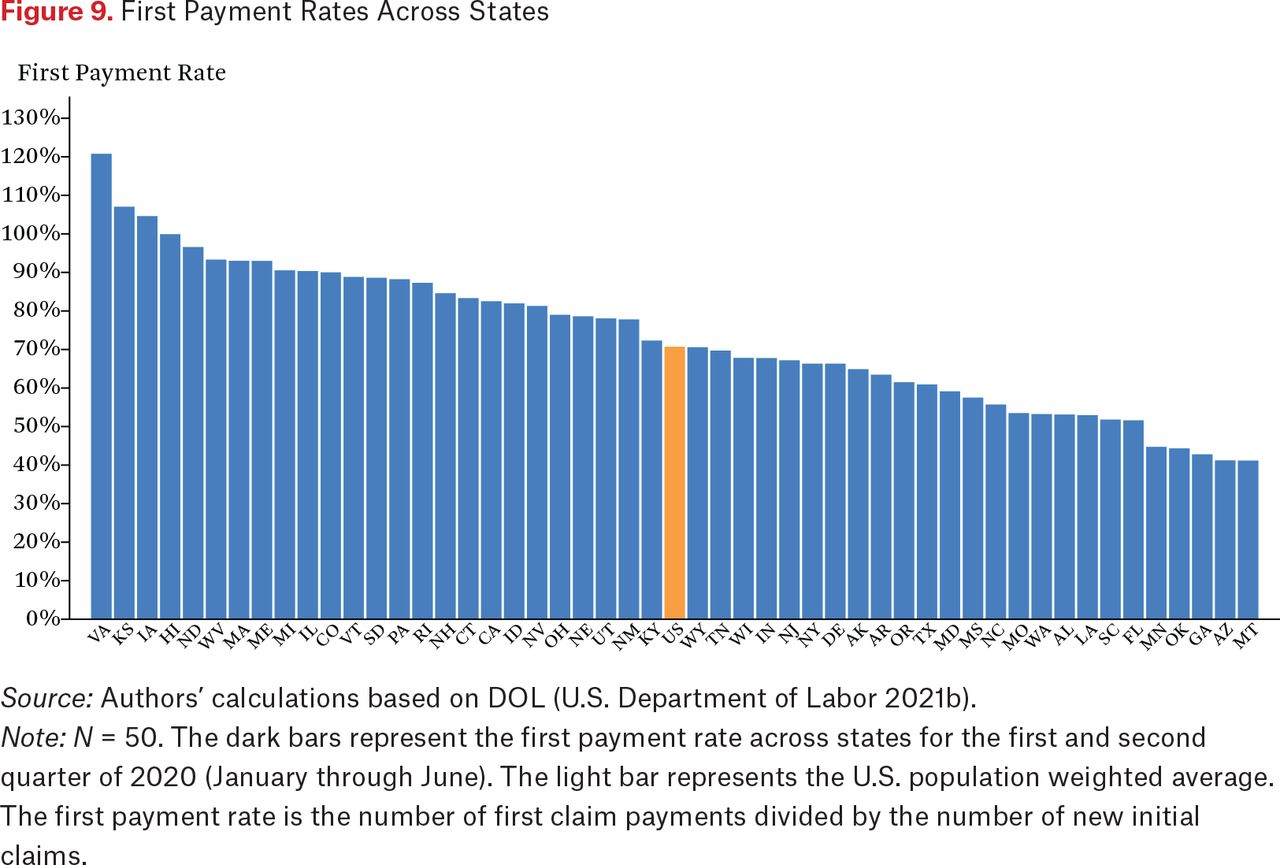
- Figure 9.
First Payment Rates Across States
Source: Authors’ calculations based on DOL (U.S. Department of Labor 2021b).
Note: N = 50. The dark bars represent the first payment rate across states for the first and second quarter of 2020 (January through June). The light bar represents the U.S. population weighted average. The first payment rate is the number of first claim payments divided by the number of new initial claims.
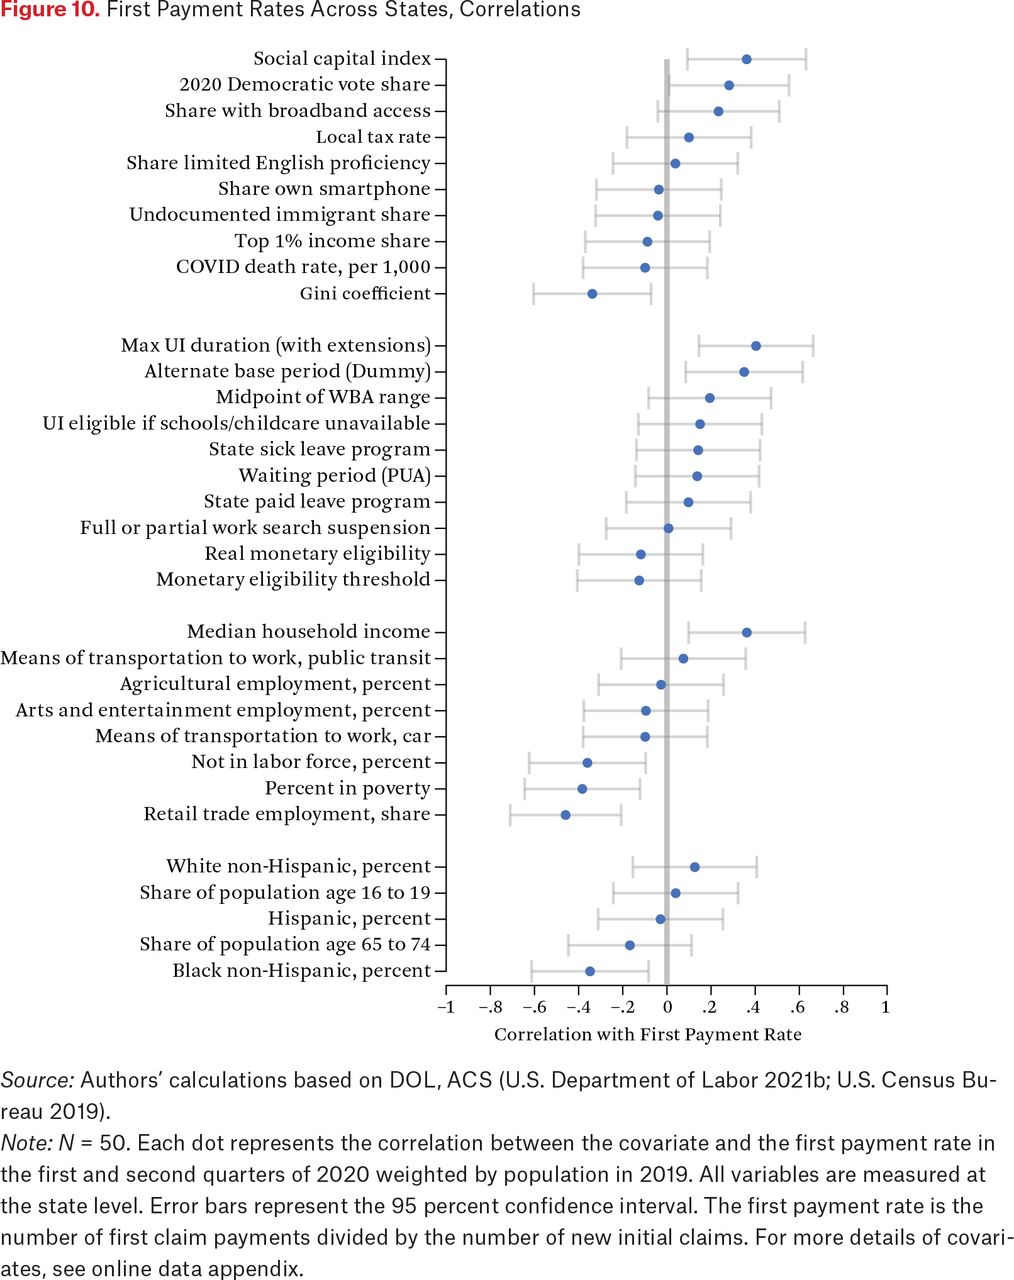
- Figure 10.
First Payment Rates Across States, Correlations
Source: Authors’ calculations based on DOL, ACS (U.S. Department of Labor 2021b; U.S. Census Bureau 2019).
Note: N = 50. Each dot represents the correlation between the covariate and the first payment rate in the first and second quarters of 2020 weighted by population in 2019. All variables are measured at the state level. Error bars represent the 95 percent confidence interval. The first payment rate is the number of first claim payments divided by the number of new initial claims. For more details of covariates, see online data appendix.
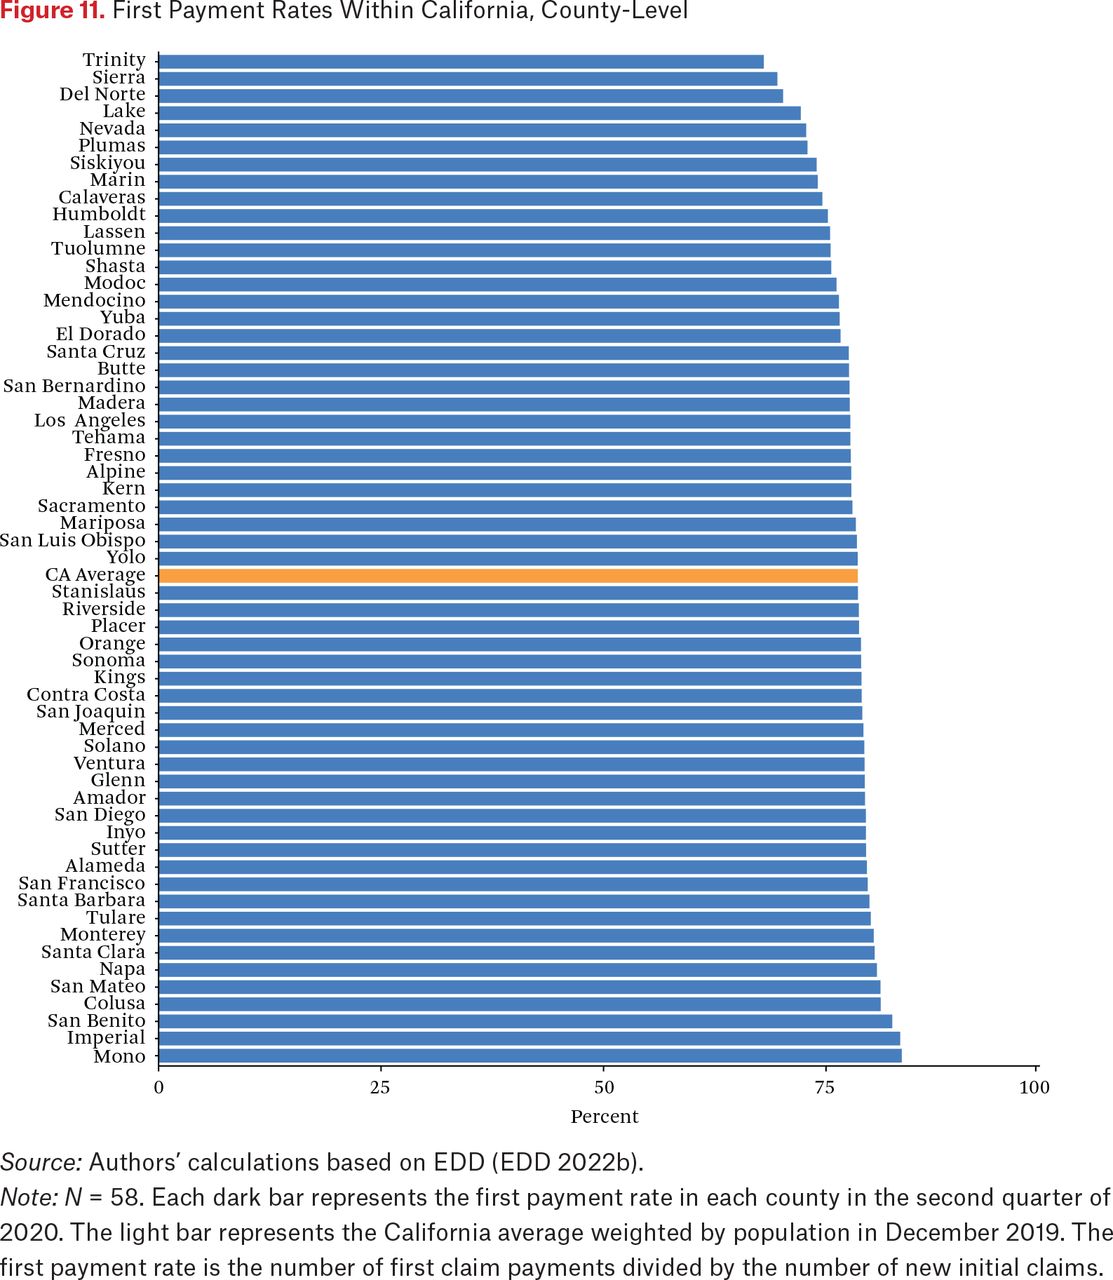
- Figure 11.
First Payment Rates Within California, County-Level
Source: Authors’ calculations based on EDD (EDD 2022b).
Note: N = 58. Each dark bar represents the first payment rate in each county in the second quarter of 2020. The light bar represents the California average weighted by population in December 2019. The first payment rate is the number of first claim payments divided by the number of new initial claims.
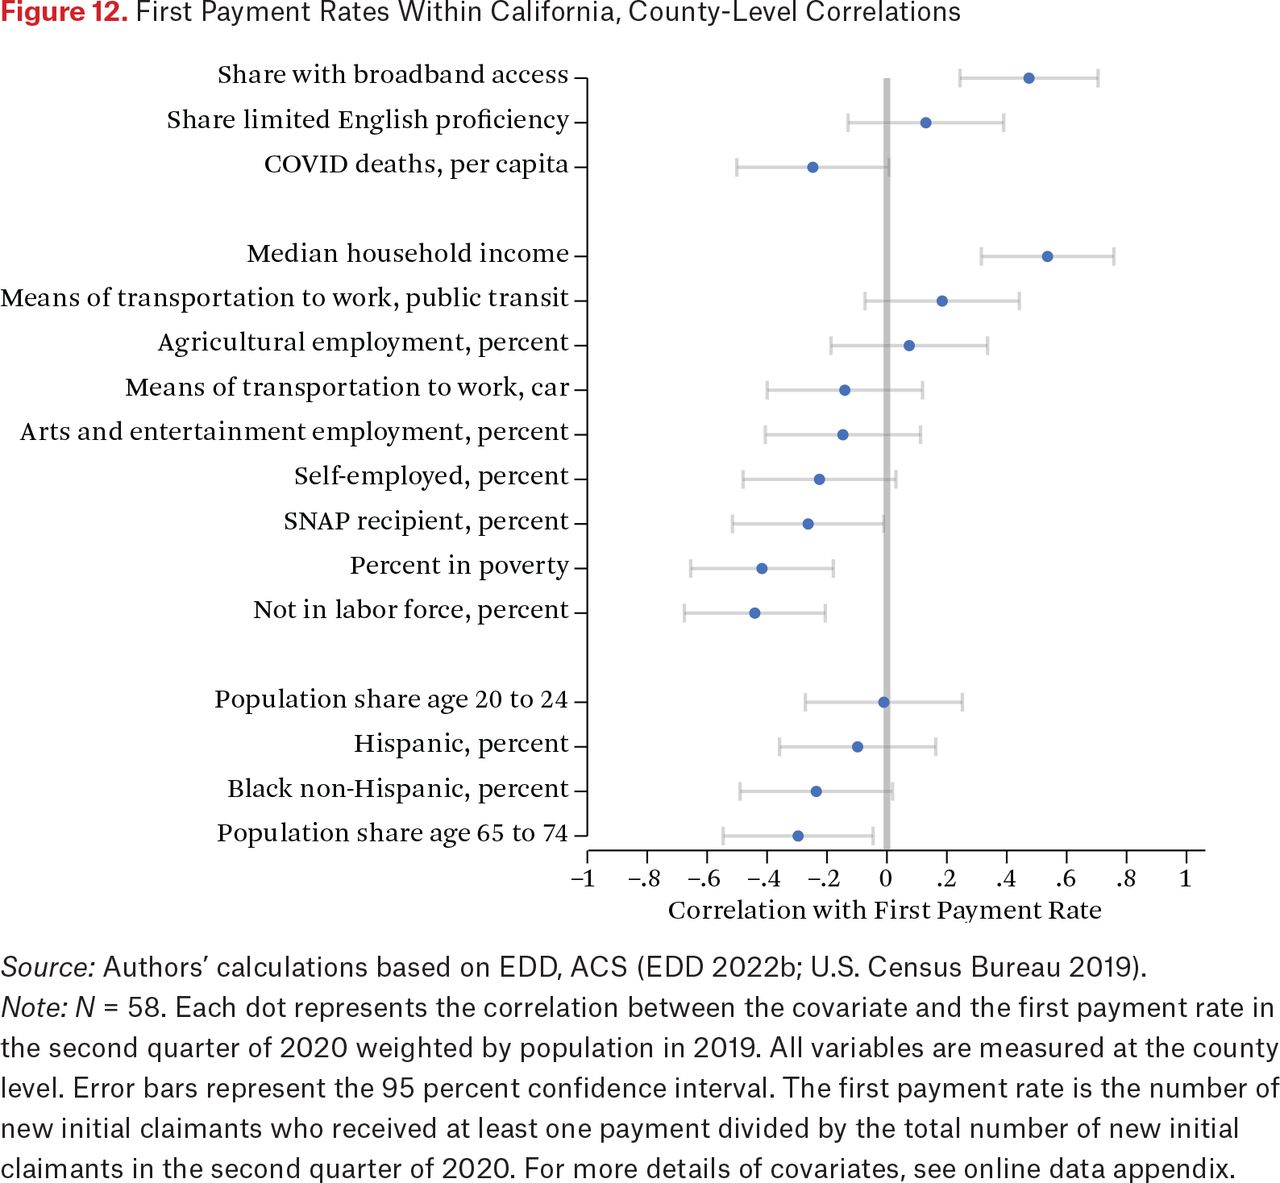
- Figure 12.
First Payment Rates Within California, County-Level Correlations
Source: Authors’ calculations based on EDD, ACS (EDD 2022b; U.S. Census Bureau 2019).
Note: N = 58. Each dot represents the correlation between the covariate and the first payment rate in the second quarter of 2020 weighted by population in 2019. All variables are measured at the county level. Error bars represent the 95 percent confidence interval. The first payment rate is the number of new initial claimants who received at least one payment divided by the total number of new initial claimants in the second quarter of 2020. For more details of covariates, see online data appendix.
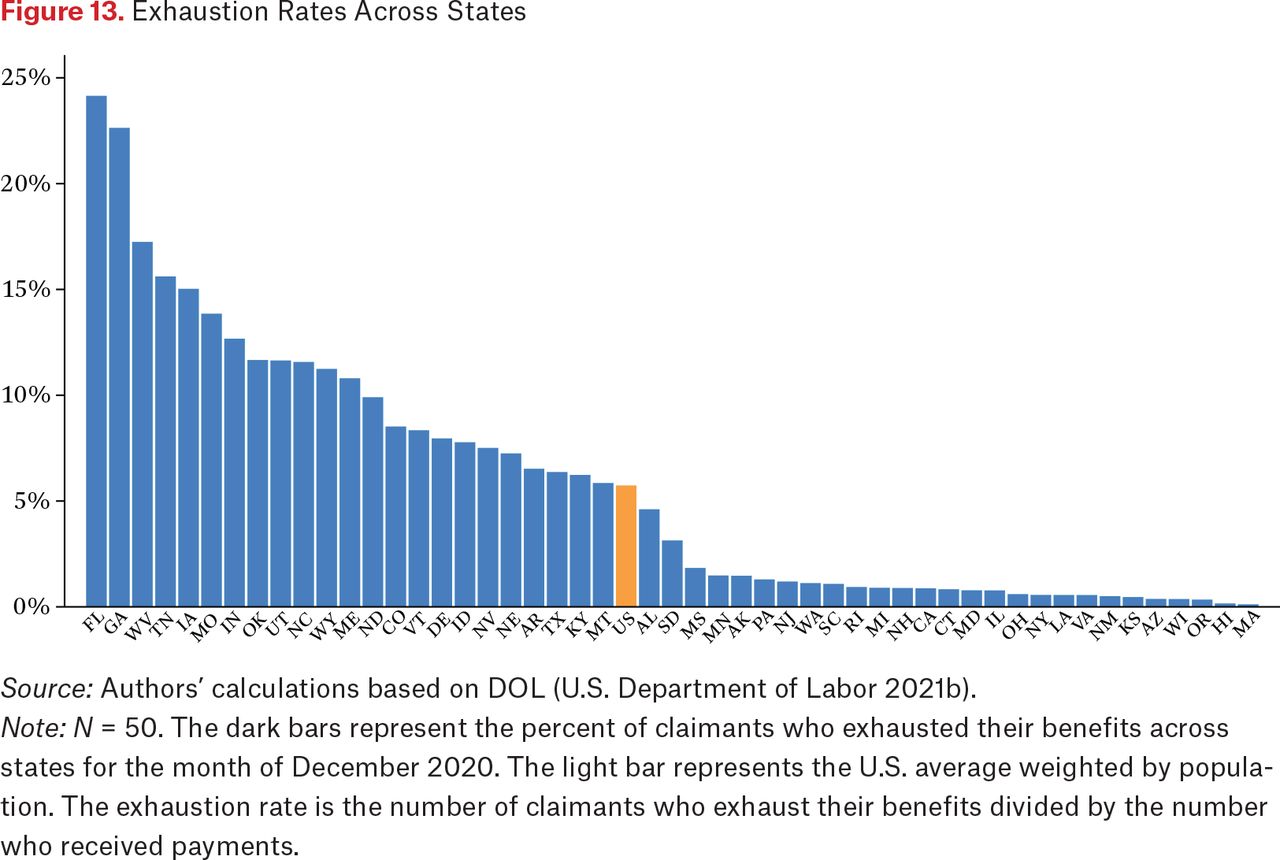
- Figure 13.
Exhaustion Rates Across States
Source: Authors’ calculations based on DOL (U.S. Department of Labor 2021b).
Note: N = 50. The dark bars represent the percent of claimants who exhausted their benefits across states for the month of December 2020. The light bar represents the U.S. average weighted by population. The exhaustion rate is the number of claimants who exhaust their benefits divided by the number who received payments.
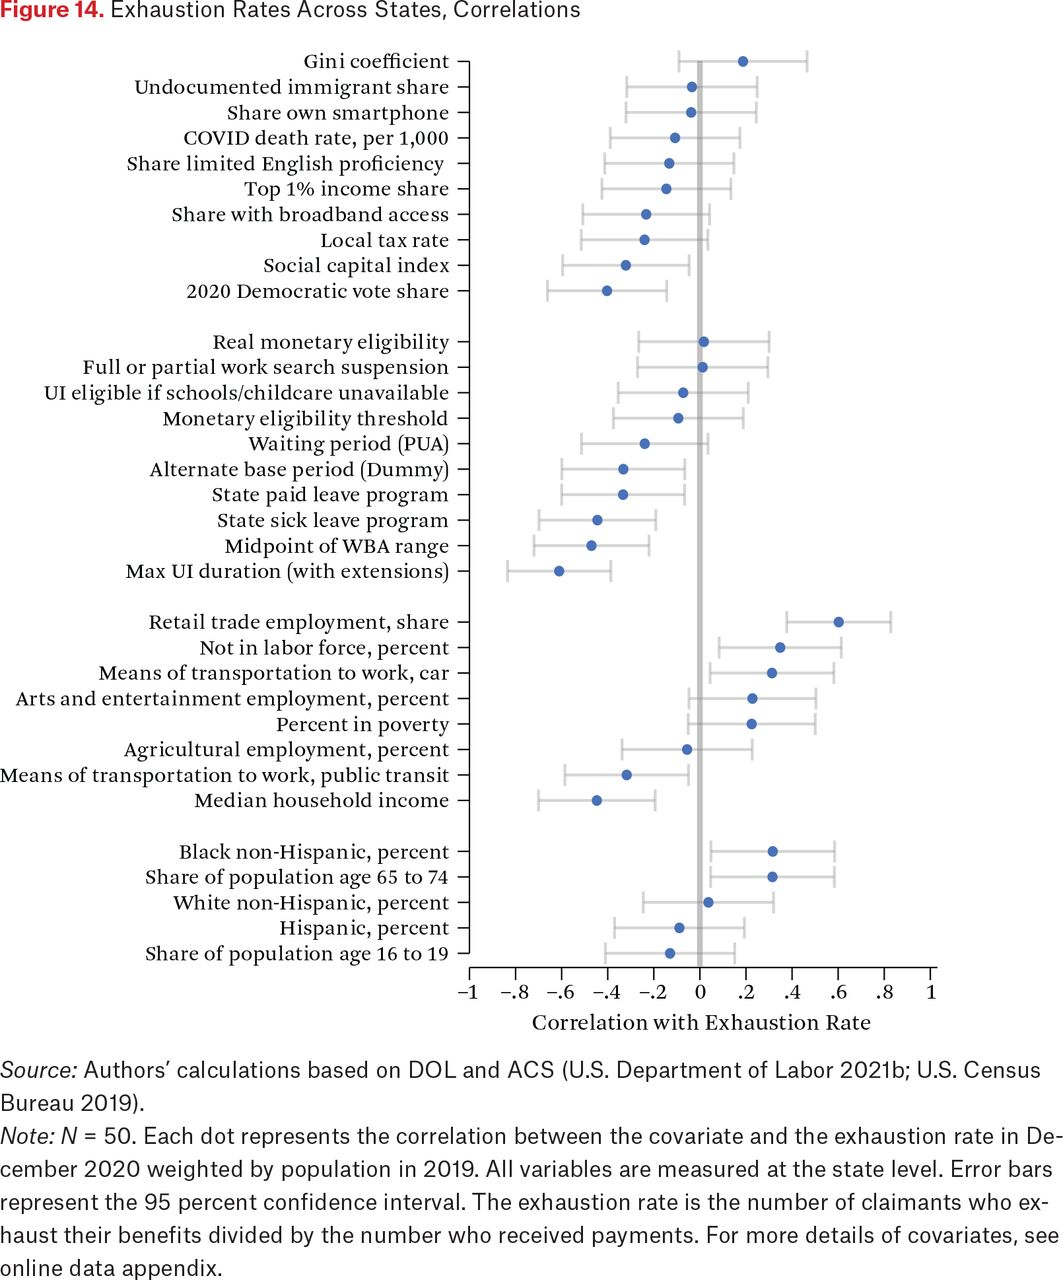
- Figure 14.
Exhaustion Rates Across States, Correlations
Source: Authors’ calculations based on DOL and ACS (U.S. Department of Labor 2021b; U.S. Census Bureau 2019).
Note: N = 50. Each dot represents the correlation between the covariate and the exhaustion rate in December 2020 weighted by population in 2019. All variables are measured at the state level. Error bars represent the 95 percent confidence interval. The exhaustion rate is the number of claimants who exhaust their benefits divided by the number who received payments. For more details of covariates, see online data appendix.
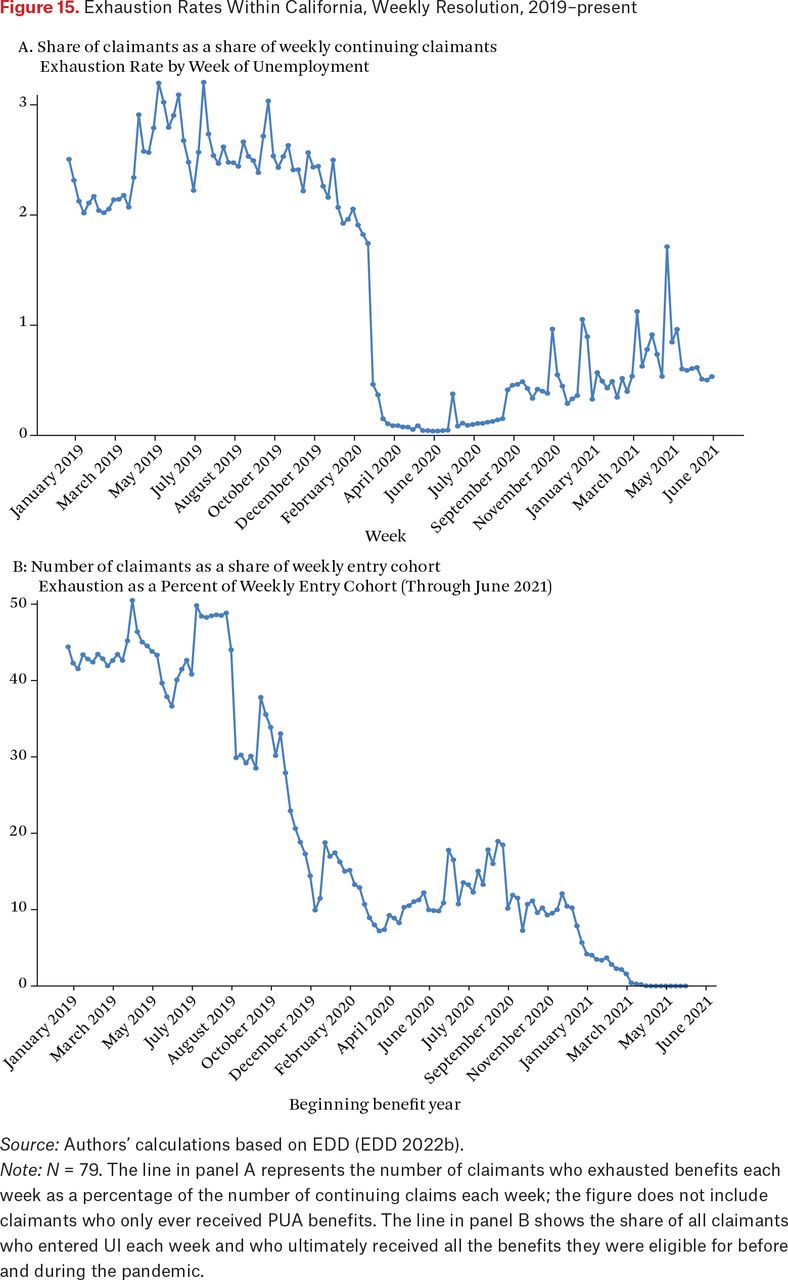
- Figure 15.
Exhaustion Rates Within California, Weekly Resolution, 2019–present
Source: Authors’ calculations based on EDD (EDD 2022b).
Note: N = 79. The line in panel A represents the number of claimants who exhausted benefits each week as a percentage of the number of continuing claims each week; the figure does not include claimants who only ever received PUA benefits. The line in panel B shows the share of all claimants who entered UI each week and who ultimately received all the benefits they were eligible for before and during the pandemic.
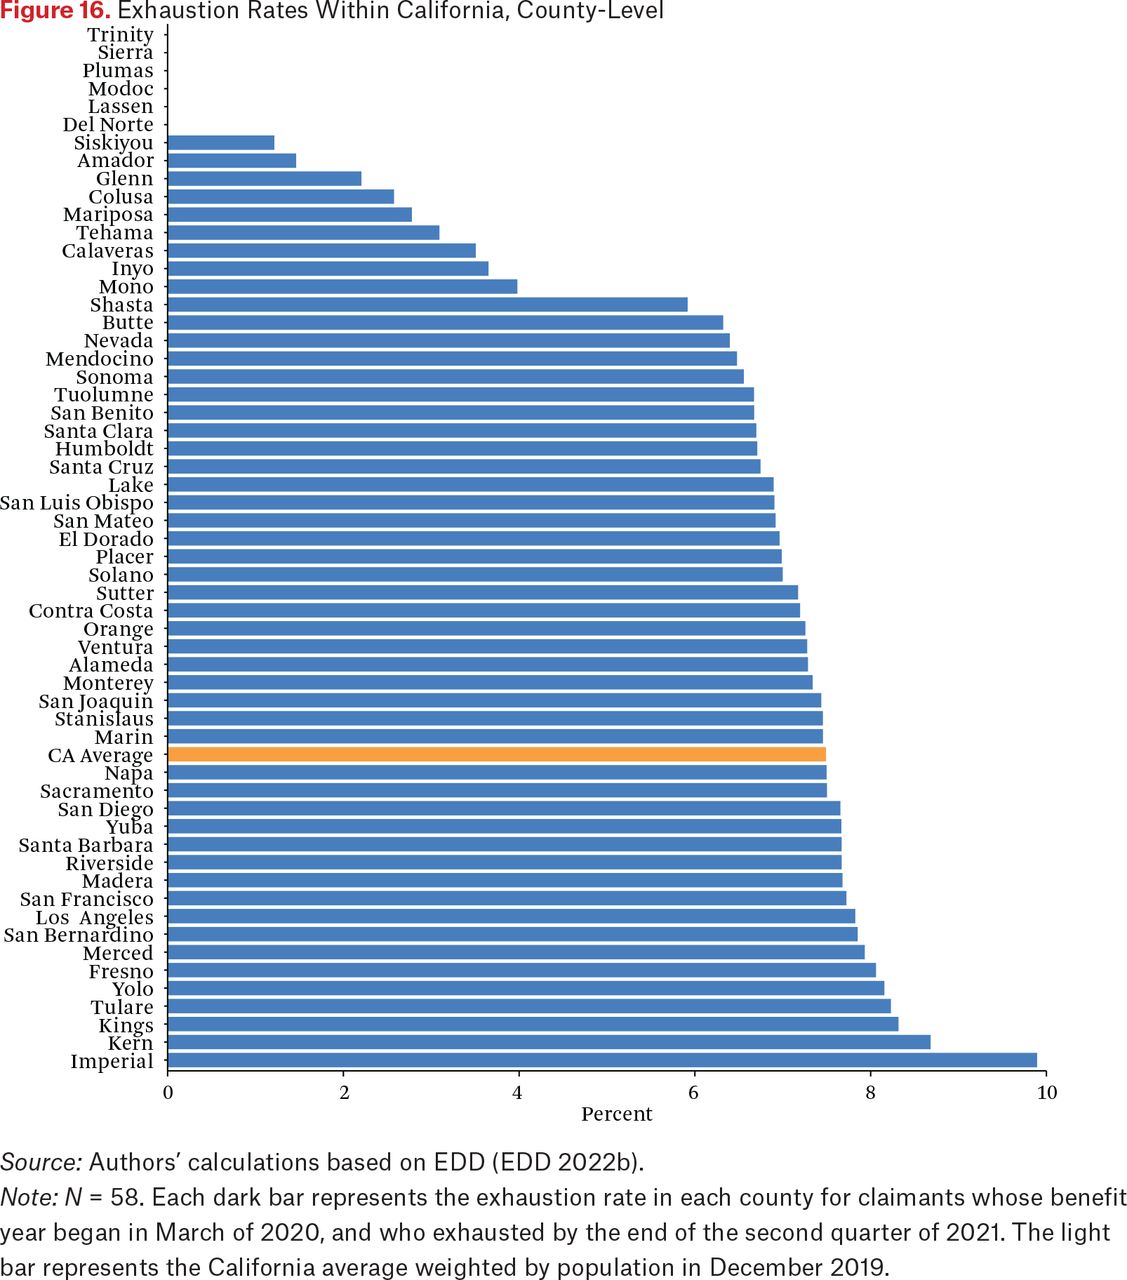
- Figure 16.
Exhaustion Rates Within California, County-Level
Source: Authors’ calculations based on EDD (EDD 2022b).
Note: N = 58. Each dark bar represents the exhaustion rate in each county for claimants whose benefit year began in March of 2020, and who exhausted by the end of the second quarter of 2021. The light bar represents the California average weighted by population in December 2019.
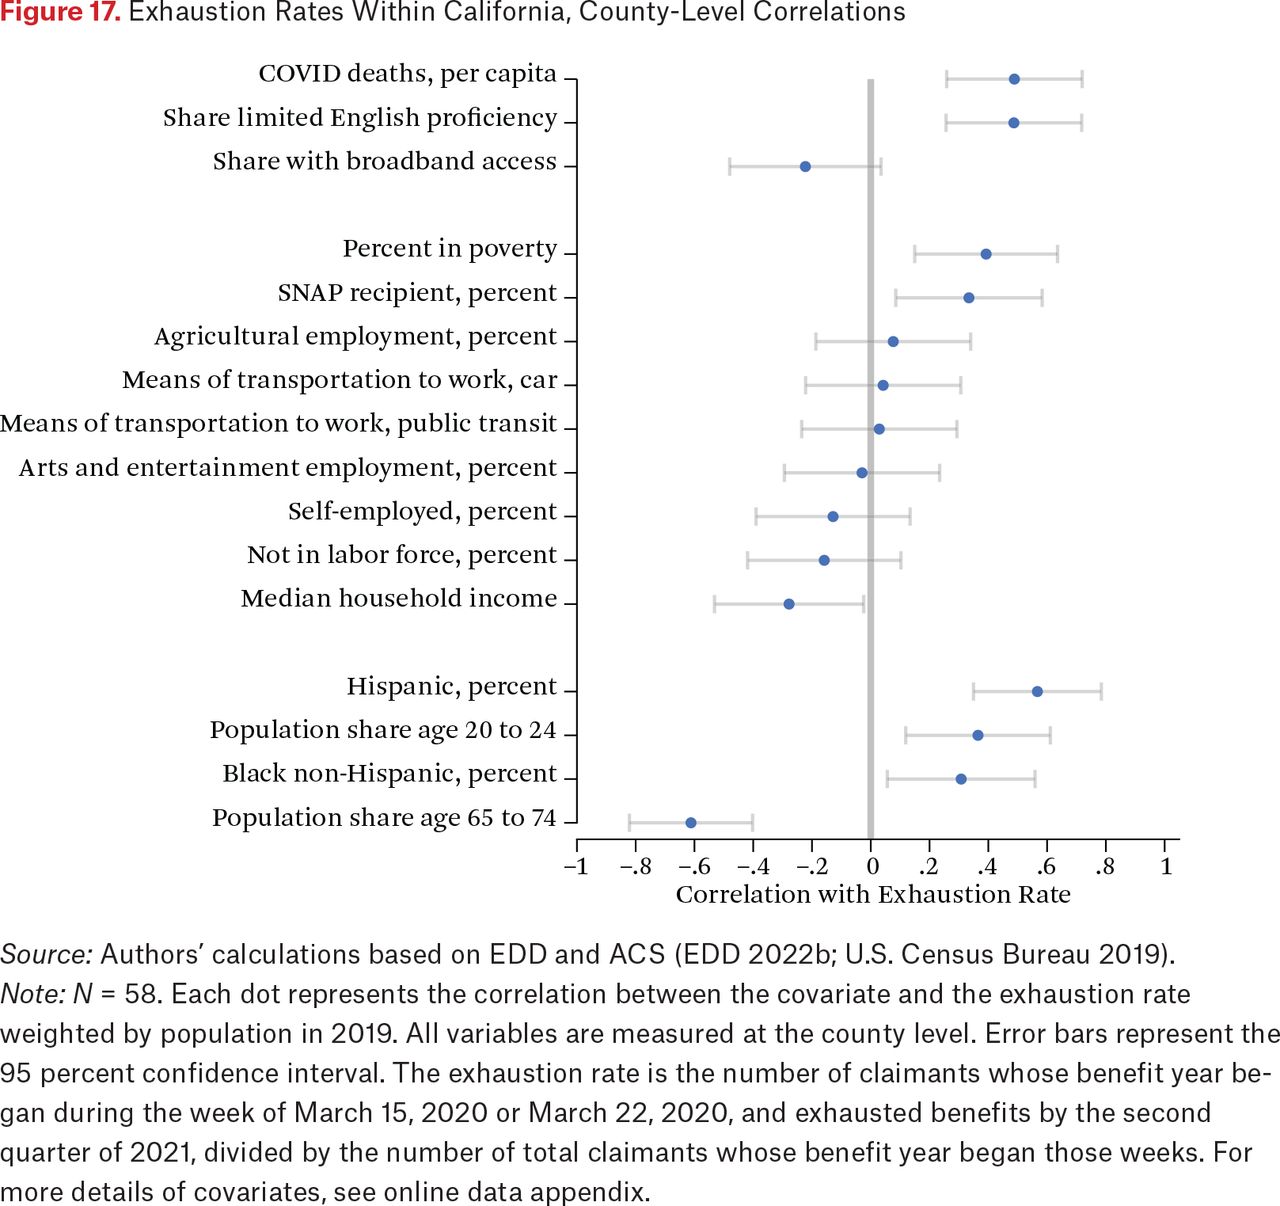
- Figure 17.
Exhaustion Rates Within California, County-Level Correlations
Source: Authors’ calculations based on EDD and ACS (EDD 2022b; U.S. Census Bureau 2019).
Note: N = 58. Each dot represents the correlation between the covariate and the exhaustion rate weighted by population in 2019. All variables are measured at the county level. Error bars represent the 95 percent confidence interval. The exhaustion rate is the number of claimants whose benefit year began during the week of March 15, 2020 or March 22, 2020, and exhausted benefits by the second quarter of 2021, divided by the number of total claimants whose benefit year began those weeks. For more details of covariates, see online data appendix.
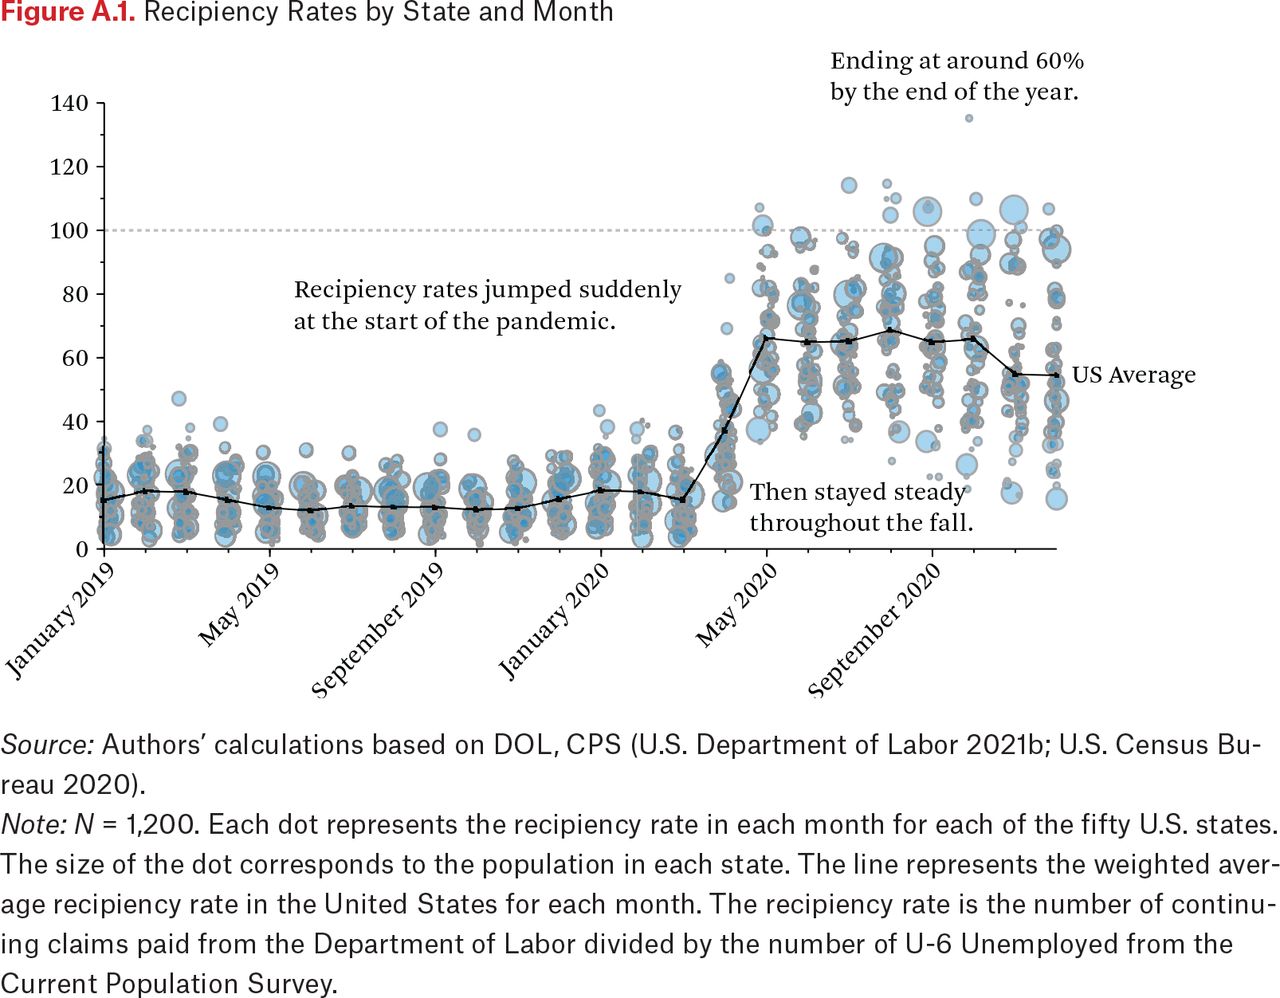
- Figure A.1.
Recipiency Rates by State and Month
Source: Authors’ calculations based on DOL, CPS (U.S. Department of Labor 2021b; U.S. Census Bureau 2020).
Note: N = 1,200. Each dot represents the recipiency rate in each month for each of the fifty U.S. states. The size of the dot corresponds to the population in each state. The line represents the weighted average recipiency rate in the United States for each month. The recipiency rate is the number of continuing claims paid from the Department of Labor divided by the number of U-6 Unemployed from the Current Population Survey.
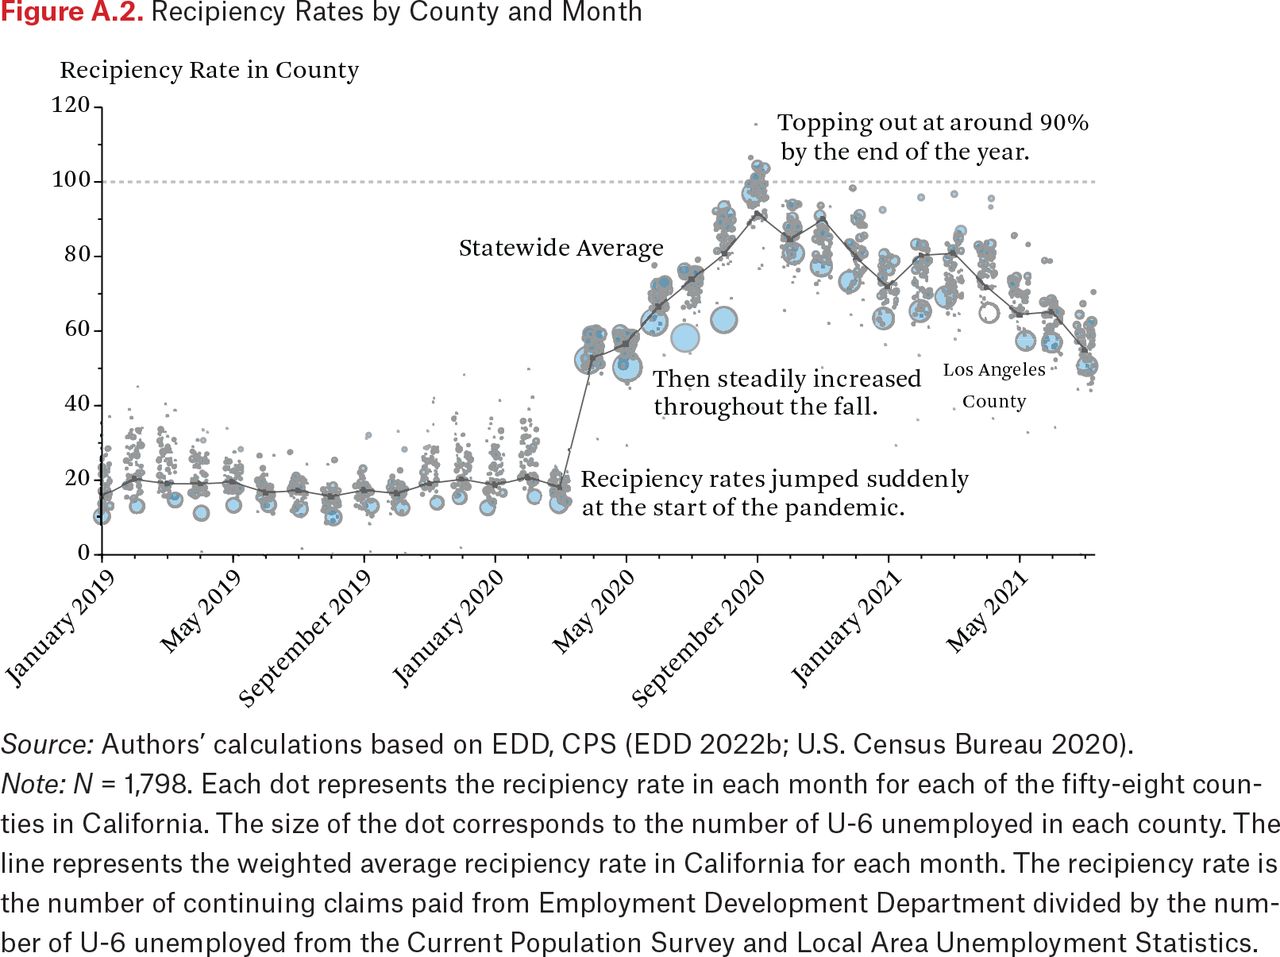
- Figure A.2.
Recipiency Rates by County and Month
Source: Authors’ calculations based on EDD, CPS (EDD 2022b; U.S. Census Bureau 2020).
Note: N = 1,798. Each dot represents the recipiency rate in each month for each of the fifty-eight counties in California. The size of the dot corresponds to the number of U-6 unemployed in each county. The line represents the weighted average recipiency rate in California for each month. The recipiency rate is the number of continuing claims paid from Employment Development Department divided by the number of U-6 unemployed from the Current Population Survey and Local Area Unemployment Statistics.


Tables
Online Appendix
Online Appendix
Files in this Data Supplement:
- Online Appendix - Online Appendix
In this issue


Jump to section
- Article
- Abstract
- UI SYSTEM DURING THE PANDEMIC AND CONCEPTUAL FRAMEWORK
- OPERATIONALIZING THE MEASURES OF ACCESS
- DESCRIPTIVE STATISTICS ON MEASURES OF ACCESS
- RECIPIENCY RATES AMONG THE UNEMPLOYED
- APPLICATION RATES AMONG THE UNEMPLOYED
- FIRST PAYMENT RATES AMONG CLAIMANTS
- EXHAUSTION RATES
- CONCLUSION
- APPENDIX
- FOOTNOTES
- REFERENCES
- Figures & Data
- Additional
- Info & Metrics
- References
Related Articles
Cited By...
- No citing articles found.