
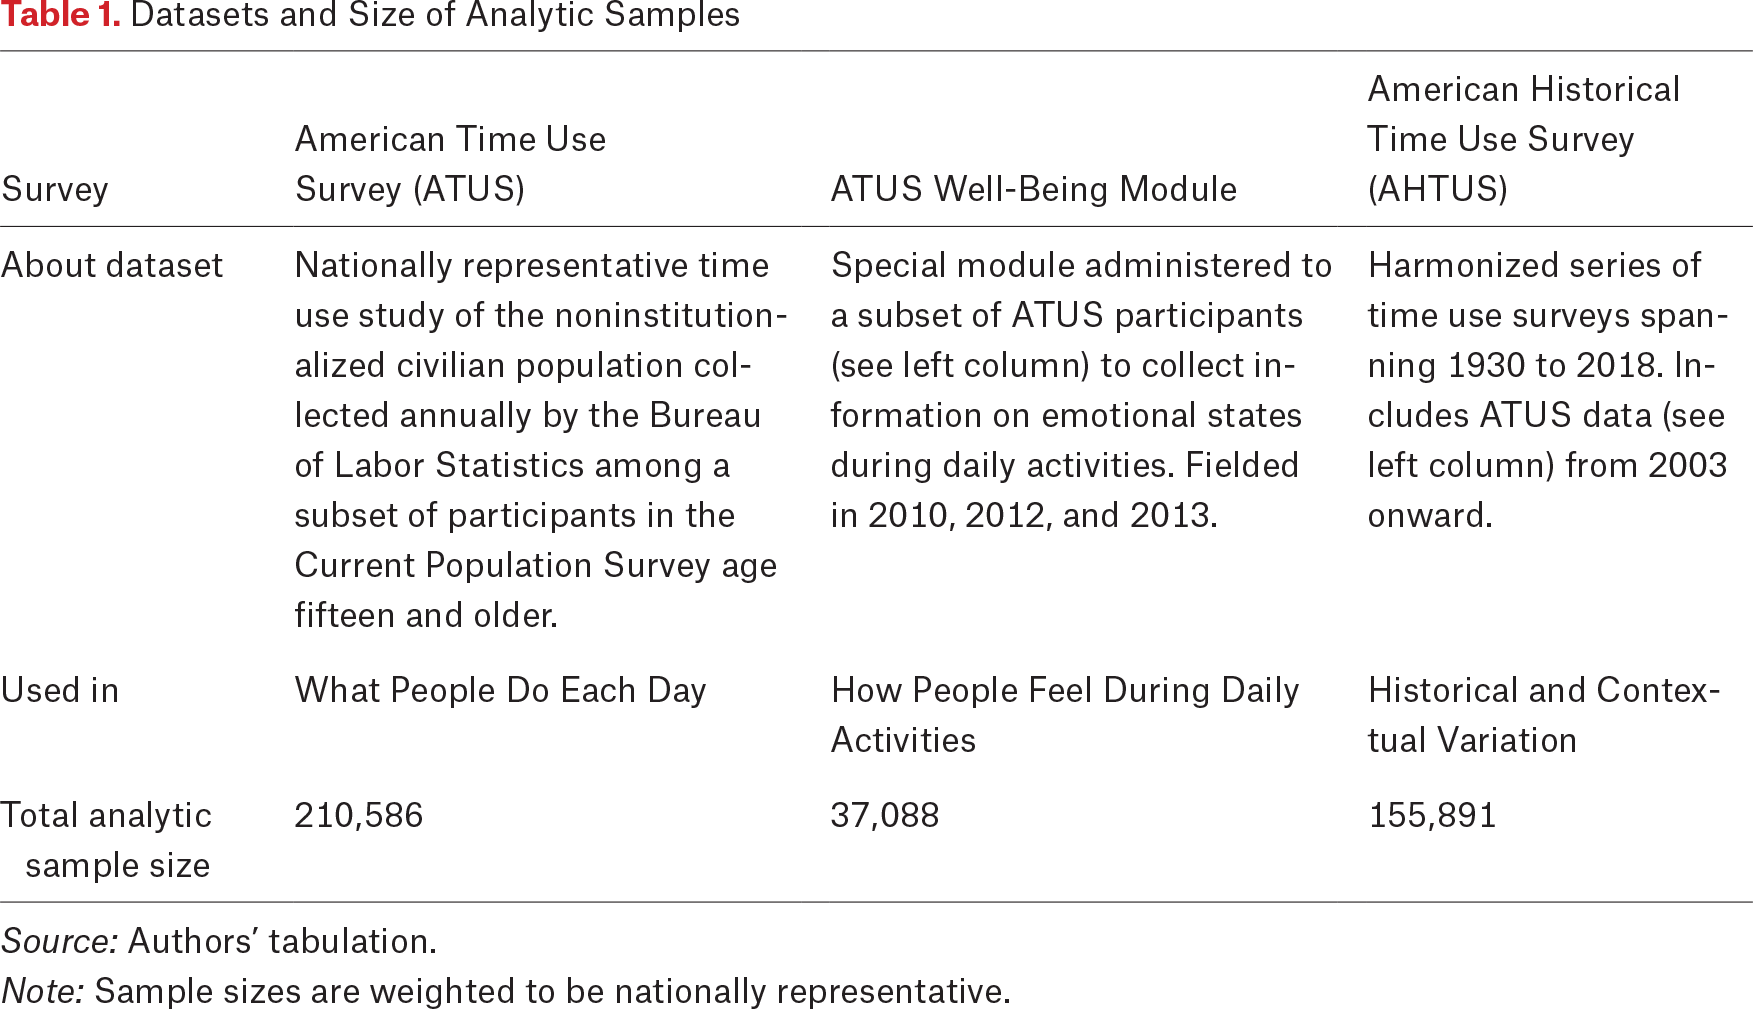
Article Figures & Data
Figures
- Figure 1.
Unpleasantness of Daily Activities
Source: Authors’ calculations based on American Time Use Survey Well-Being Model, 2010, 2012, 2013 (Flood et al. 2023).
Note: Estimates and 95 percent confidence intervals. Average u-index values across 160 race-specific u-index calculations (using 160 replicate weights). Confidence intervals represent the uncertainty in the u-index estimate from using 160 different replicate weights.
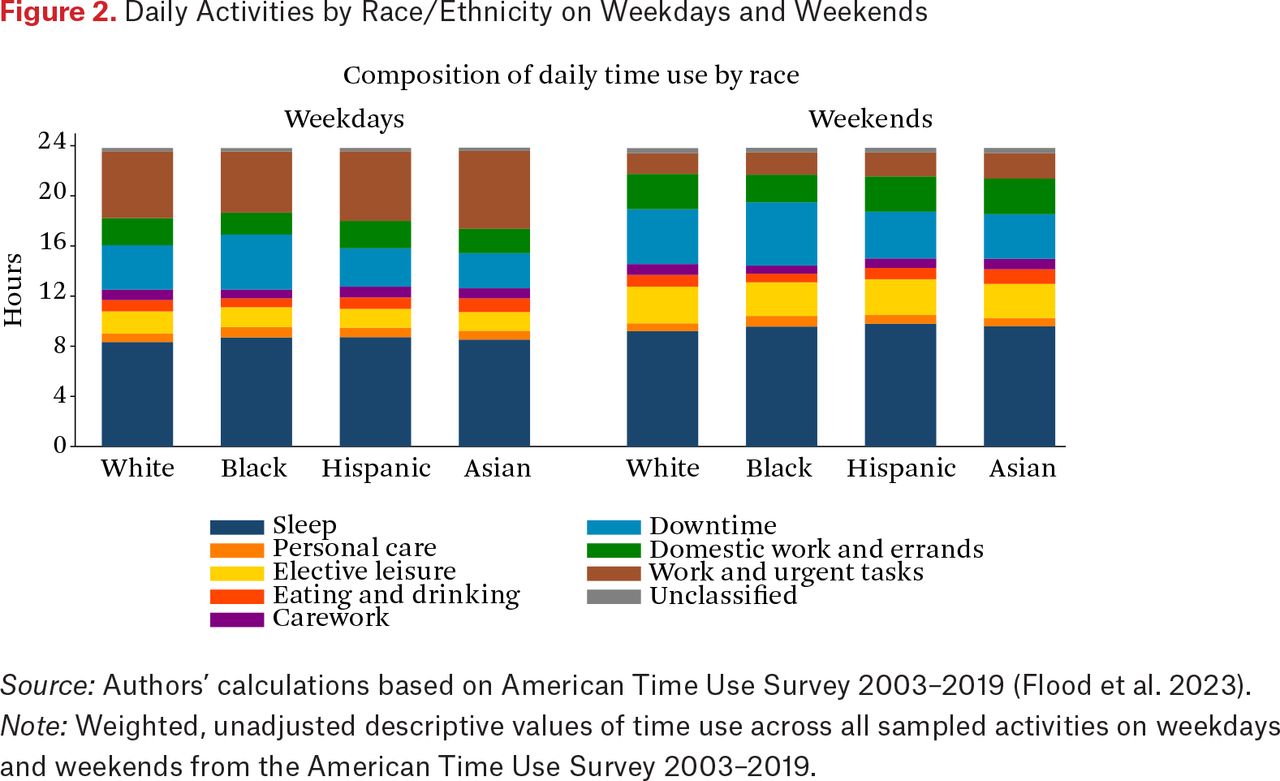
- Figure 2.
Daily Activities by Race/Ethnicity on Weekdays and Weekends
Source: Authors’ calculations based on American Time Use Survey 2003–2019 (Flood et al. 2023).
Note: Weighted, unadjusted descriptive values of time use across all sampled activities on weekdays and weekends from the American Time Use Survey 2003–2019.
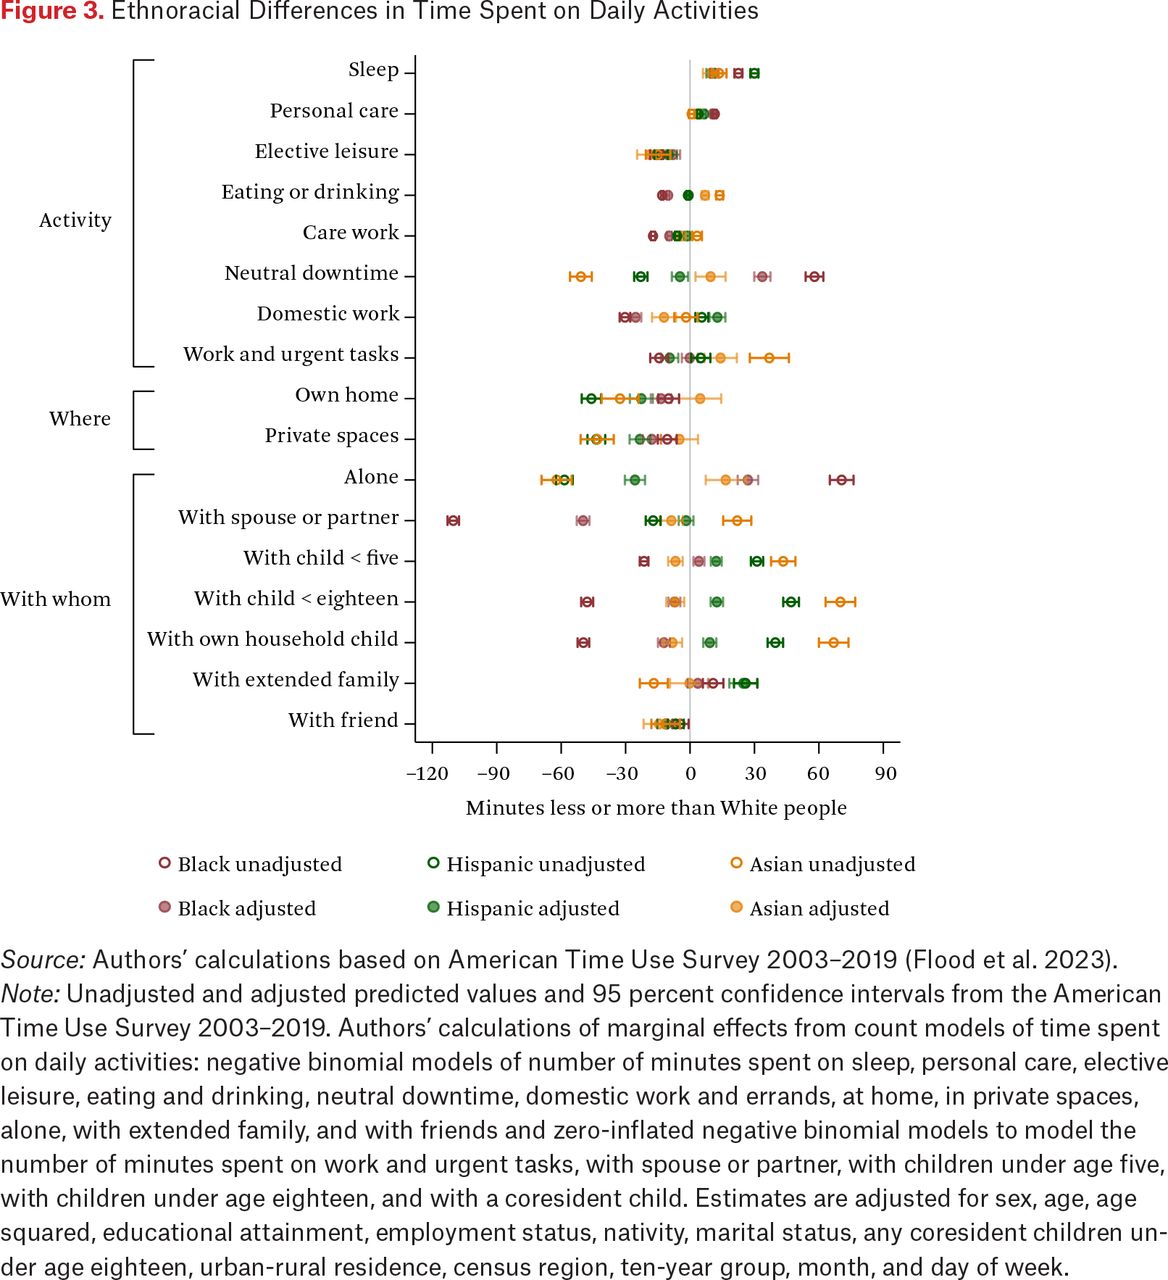
- Figure 3.
Ethnoracial Differences in Time Spent on Daily Activities
Source: Authors’ calculations based on American Time Use Survey 2003–2019 (Flood et al. 2023).
Note: Unadjusted and adjusted predicted values and 95 percent confidence intervals from the American Time Use Survey 2003–2019. Authors’ calculations of marginal effects from count models of time spent on daily activities: negative binomial models of number of minutes spent on sleep, personal care, elective leisure, eating and drinking, neutral downtime, domestic work and errands, at home, in private spaces, alone, with extended family, and with friends and zero-inflated negative binomial models to model the number of minutes spent on work and urgent tasks, with spouse or partner, with children under age five, with children under age eighteen, and with a coresident child. Estimates are adjusted for sex, age, age squared, educational attainment, employment status, nativity, marital status, any coresident children under age eighteen, urban-rural residence, census region, ten-year group, month, and day of week.
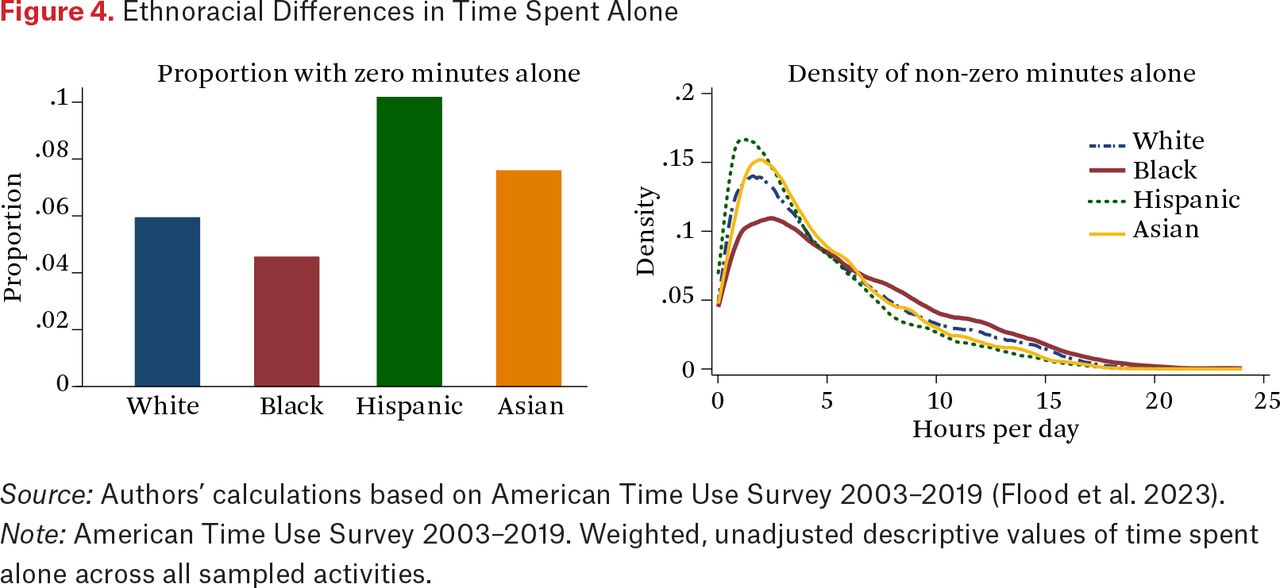
- Figure 4.
Ethnoracial Differences in Time Spent Alone
Source: Authors’ calculations based on American Time Use Survey 2003–2019 (Flood et al. 2023).
Note: American Time Use Survey 2003–2019. Weighted, unadjusted descriptive values of time spent alone across all sampled activities.
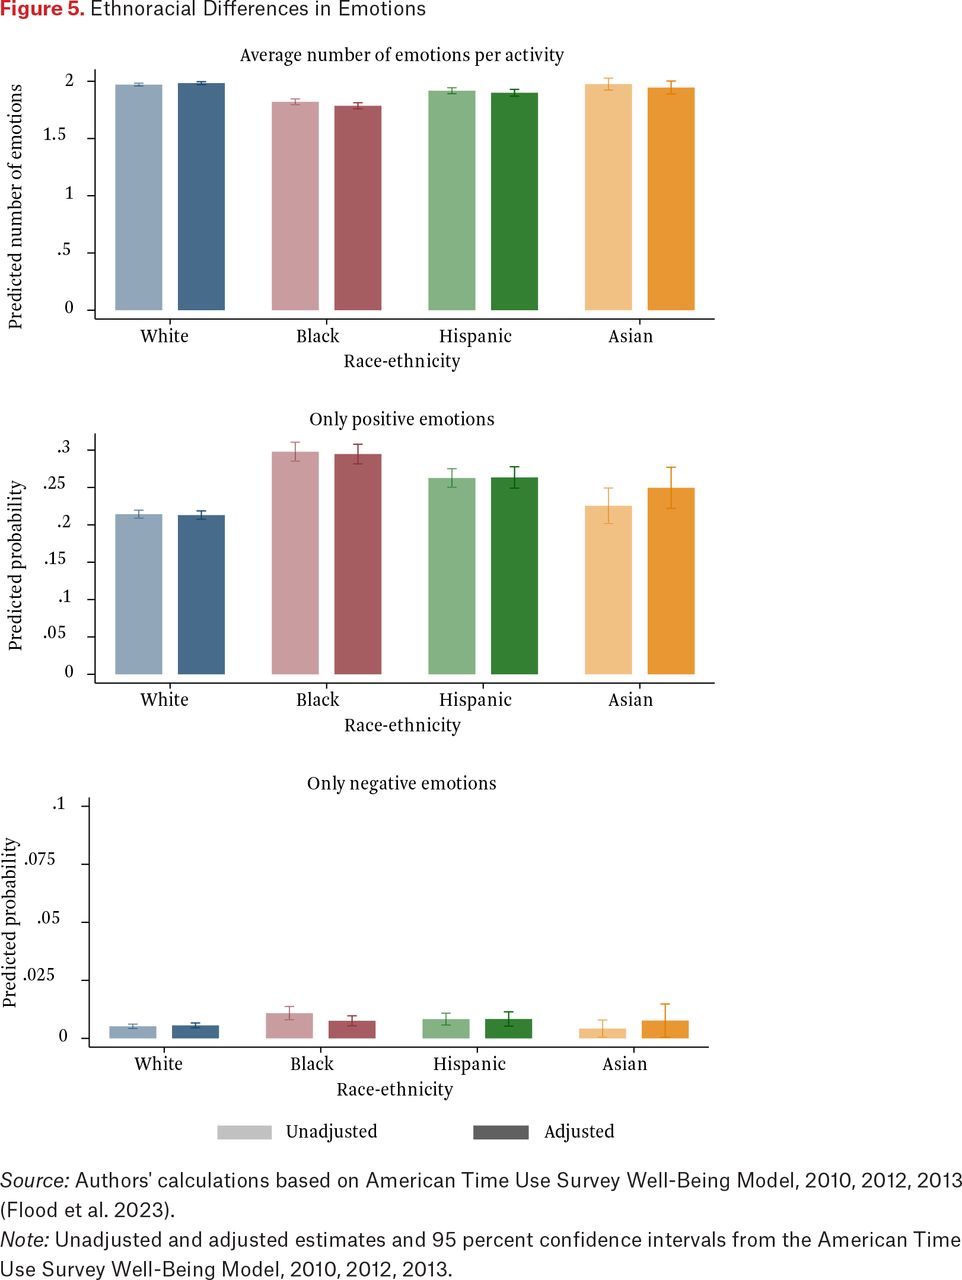
- Figure 5.
Ethnoracial Differences in Emotions
Source: Authors' calculations based on American Time Use Survey Well-Being Model, 2010, 2012, 2013 (Flood et al. 2023).
Note: Unadjusted and adjusted estimates and 95 percent confidence intervals from the American Time Use Survey Well-Being Model, 2010, 2012, 2013.
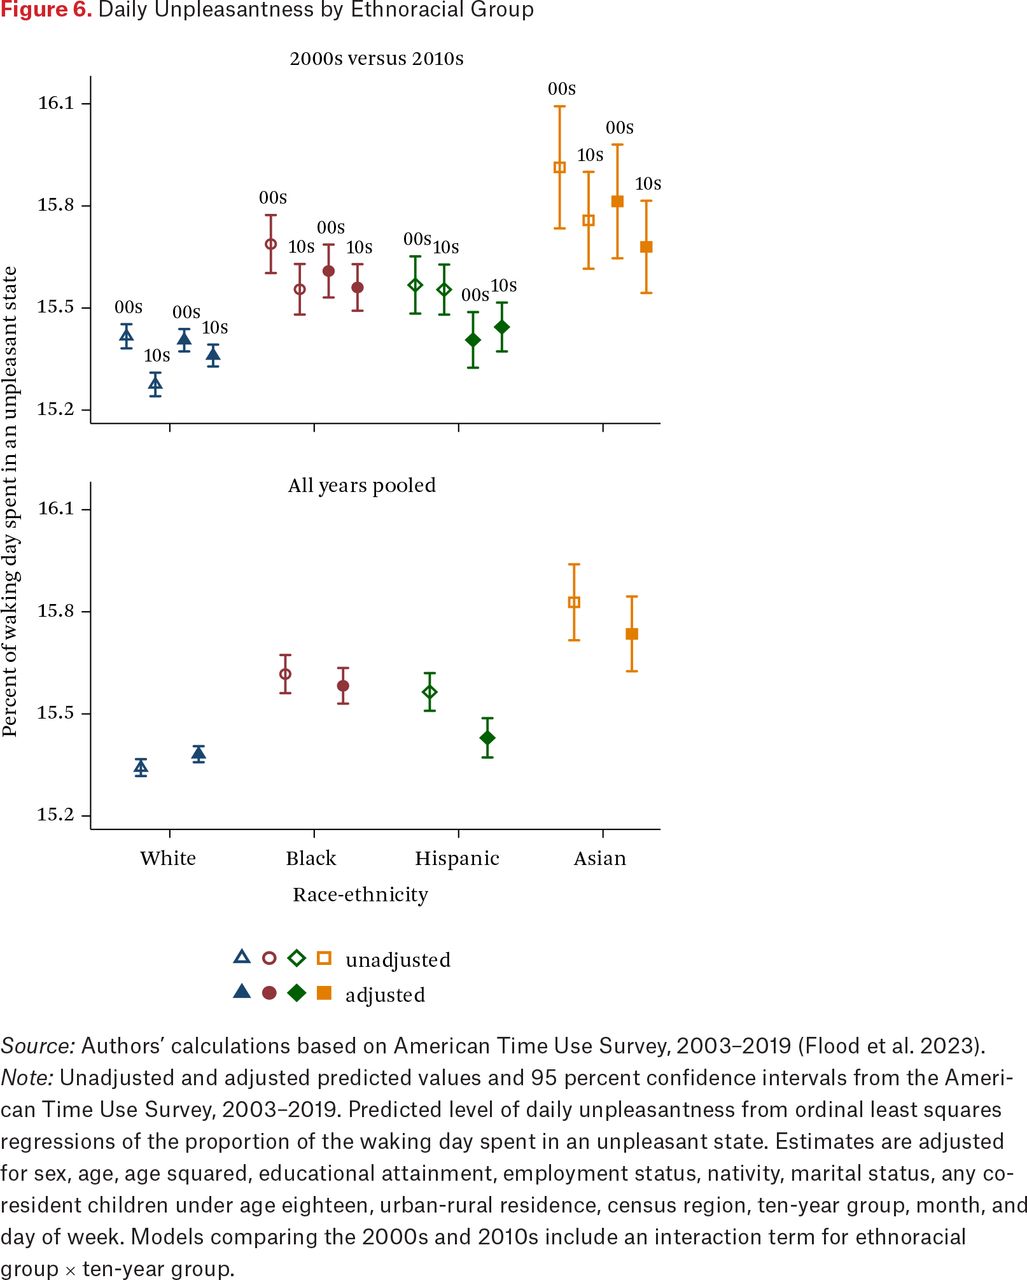
- Figure 6.
Daily Unpleasantness by Ethnoracial Group
Source: Authors’ calculations based on American Time Use Survey, 2003–2019 (Flood et al. 2023).
Note: Unadjusted and adjusted predicted values and 95 percent confidence intervals from the American Time Use Survey, 2003–2019. Predicted level of daily unpleasantness from ordinal least squares regressions of the proportion of the waking day spent in an unpleasant state. Estimates are adjusted for sex, age, age squared, educational attainment, employment status, nativity, marital status, any coresident children under age eighteen, urban-rural residence, census region, ten-year group, month, and day of week. Models comparing the 2000s and 2010s include an interaction term for ethnoracial group × ten-year group.
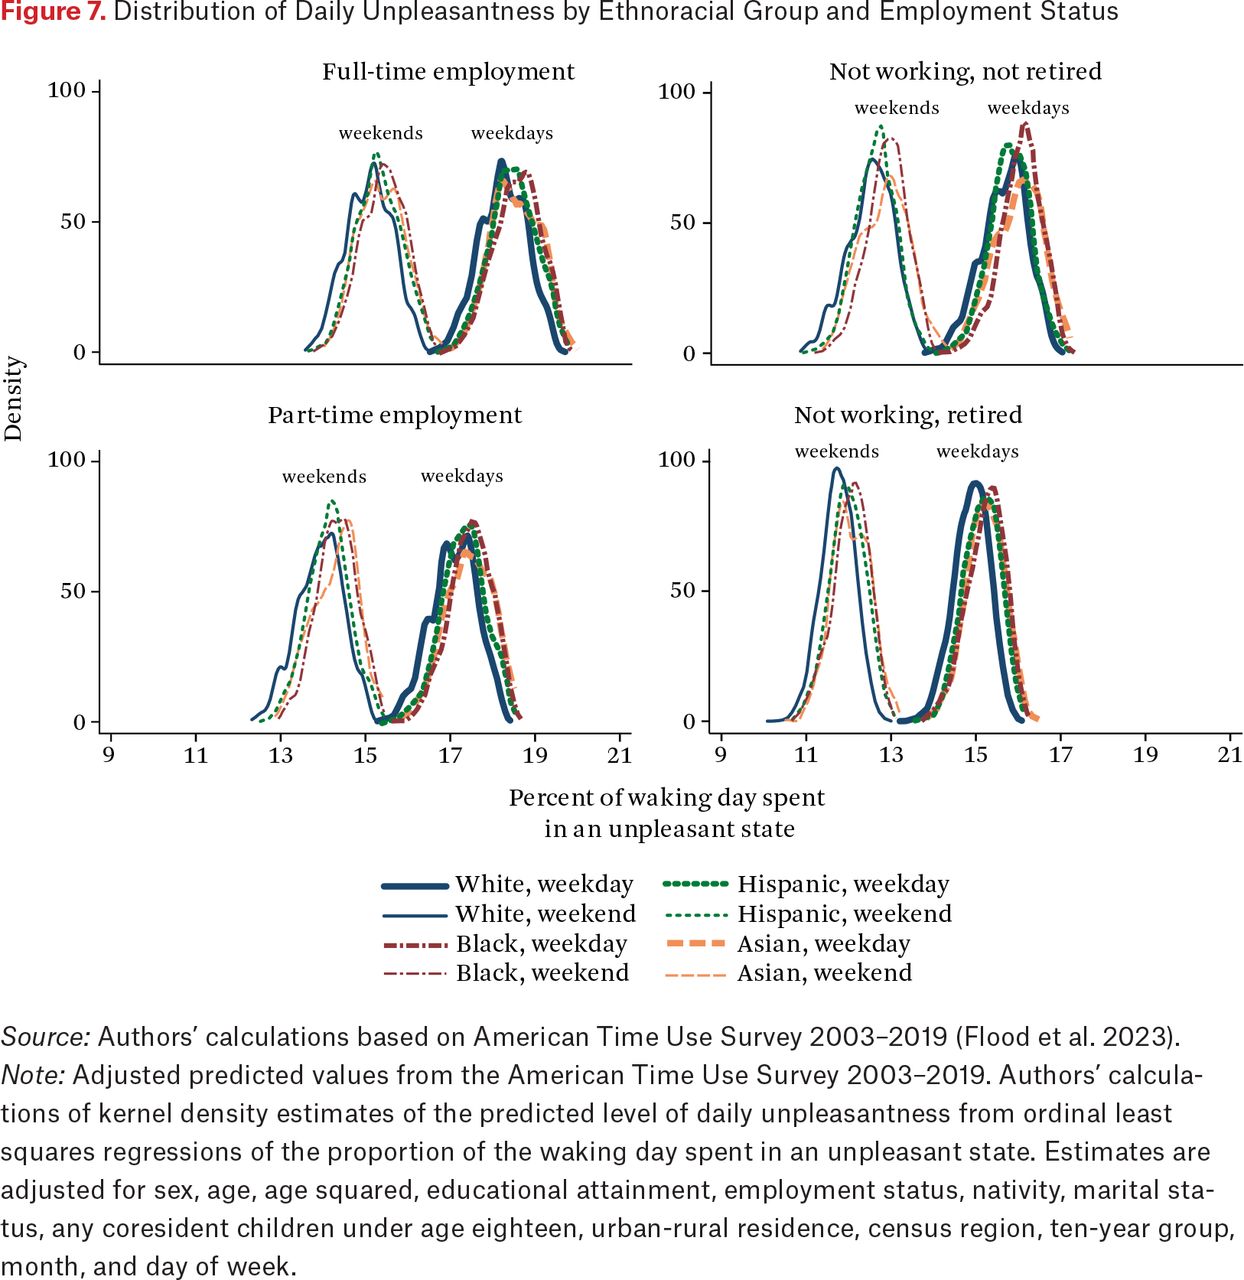
- Figure 7.
Distribution of Daily Unpleasantness by Ethnoracial Group and Employment Status
Source: Authors’ calculations based on American Time Use Survey 2003–2019 (Flood et al. 2023).
Note: Adjusted predicted values from the American Time Use Survey 2003–2019. Authors’ calculations of kernel density estimates of the predicted level of daily unpleasantness from ordinal least squares regressions of the proportion of the waking day spent in an unpleasant state. Estimates are adjusted for sex, age, age squared, educational attainment, employment status, nativity, marital status, any coresident children under age eighteen, urban-rural residence, census region, ten-year group, month, and day of week.
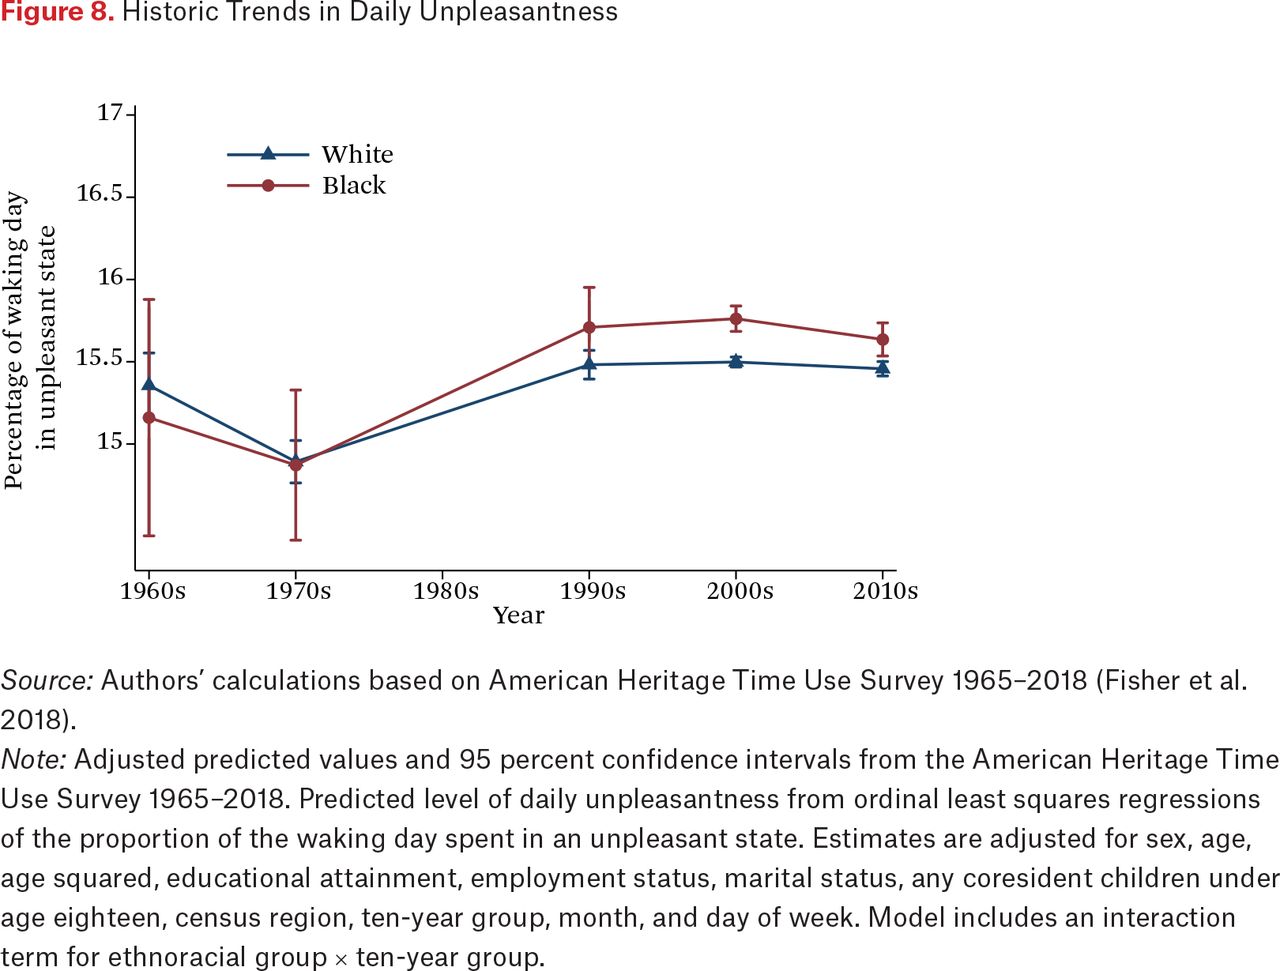
- Figure 8.
Historic Trends in Daily Unpleasantness
Source: Authors’ calculations based on American Heritage Time Use Survey 1965–2018 (Fisher et al. 2018).
Note: Adjusted predicted values and 95 percent confidence intervals from the American Heritage Time Use Survey 1965–2018. Predicted level of daily unpleasantness from ordinal least squares regressions of the proportion of the waking day spent in an unpleasant state. Estimates are adjusted for sex, age, age squared, educational attainment, employment status, marital status, any coresident children under age eighteen, census region, ten-year group, month, and day of week. Model includes an interaction term for ethnoracial group × ten-year group.


Tables
Appendix
Appendix
Files in this Data Supplement:
- Adobe PDF - James_Online_Appendix.pdf - Appendix
In this issue


Jump to section
Related Articles
Cited By...
- No citing articles found.