
Article Figures & Data
Figures
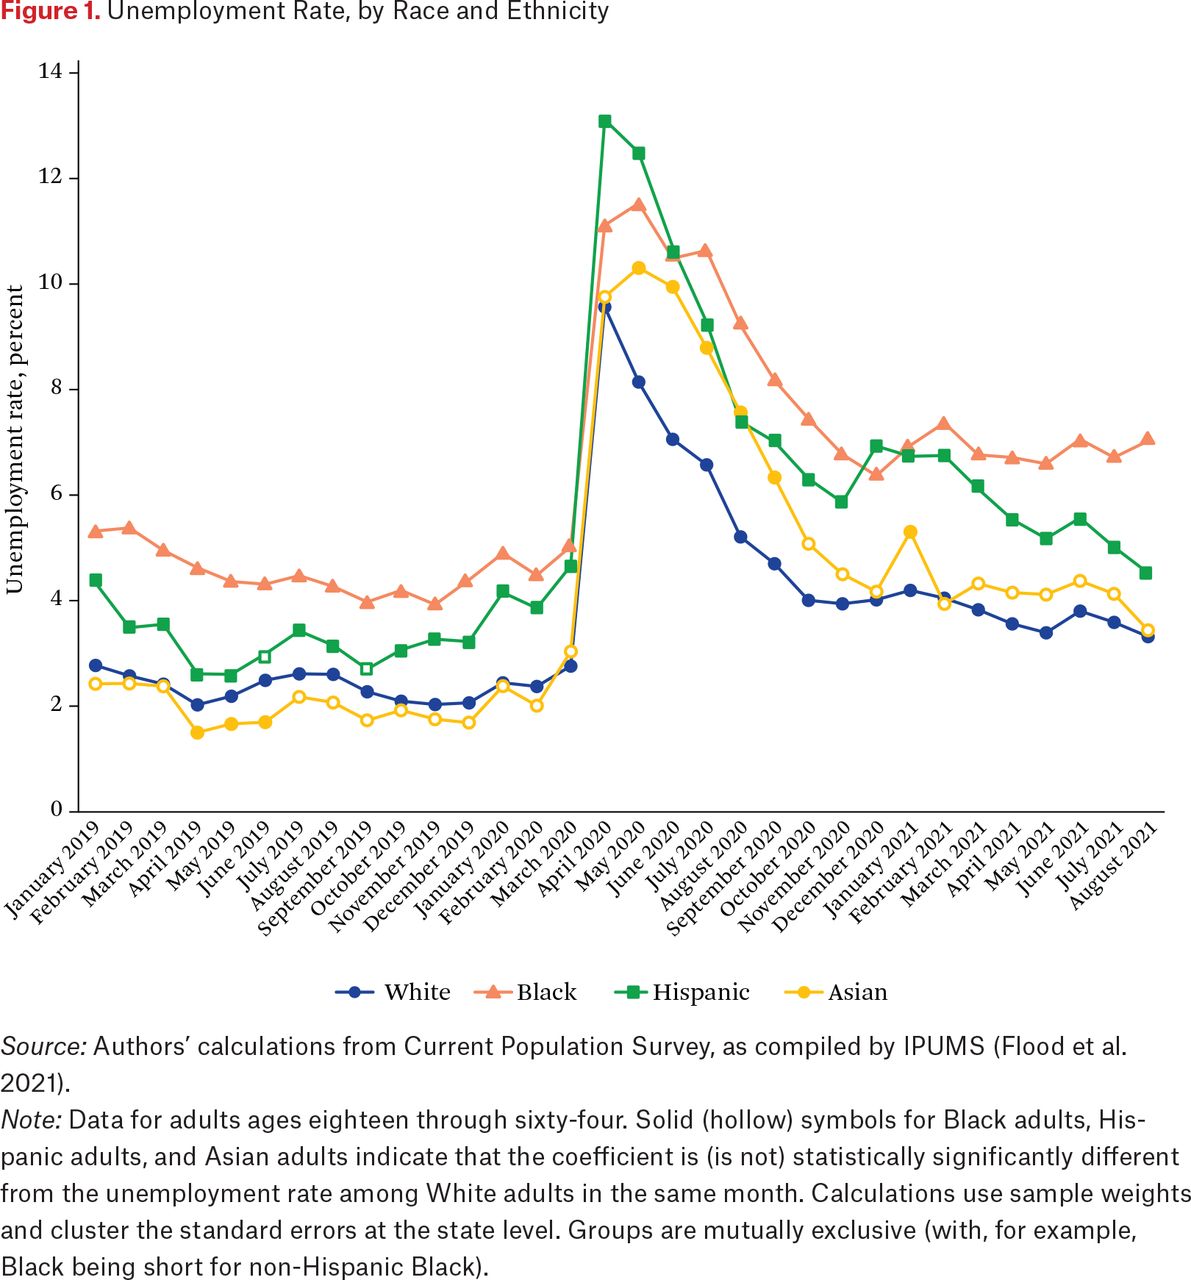
- Figure 1.
Unemployment Rate, by Race and Ethnicity
Source: Authors’ calculations from Current Population Survey, as compiled by IPUMS (Flood et al. 2021).
Note: Data for adults ages eighteen through sixty-four. Solid (hollow) symbols for Black adults, Hispanic adults, and Asian adults indicate that the coefficient is (is not) statistically significantly different from the unemployment rate among White adults in the same month. Calculations use sample weights and cluster the standard errors at the state level. Groups are mutually exclusive (with, for example, Black being short for non-Hispanic Black).
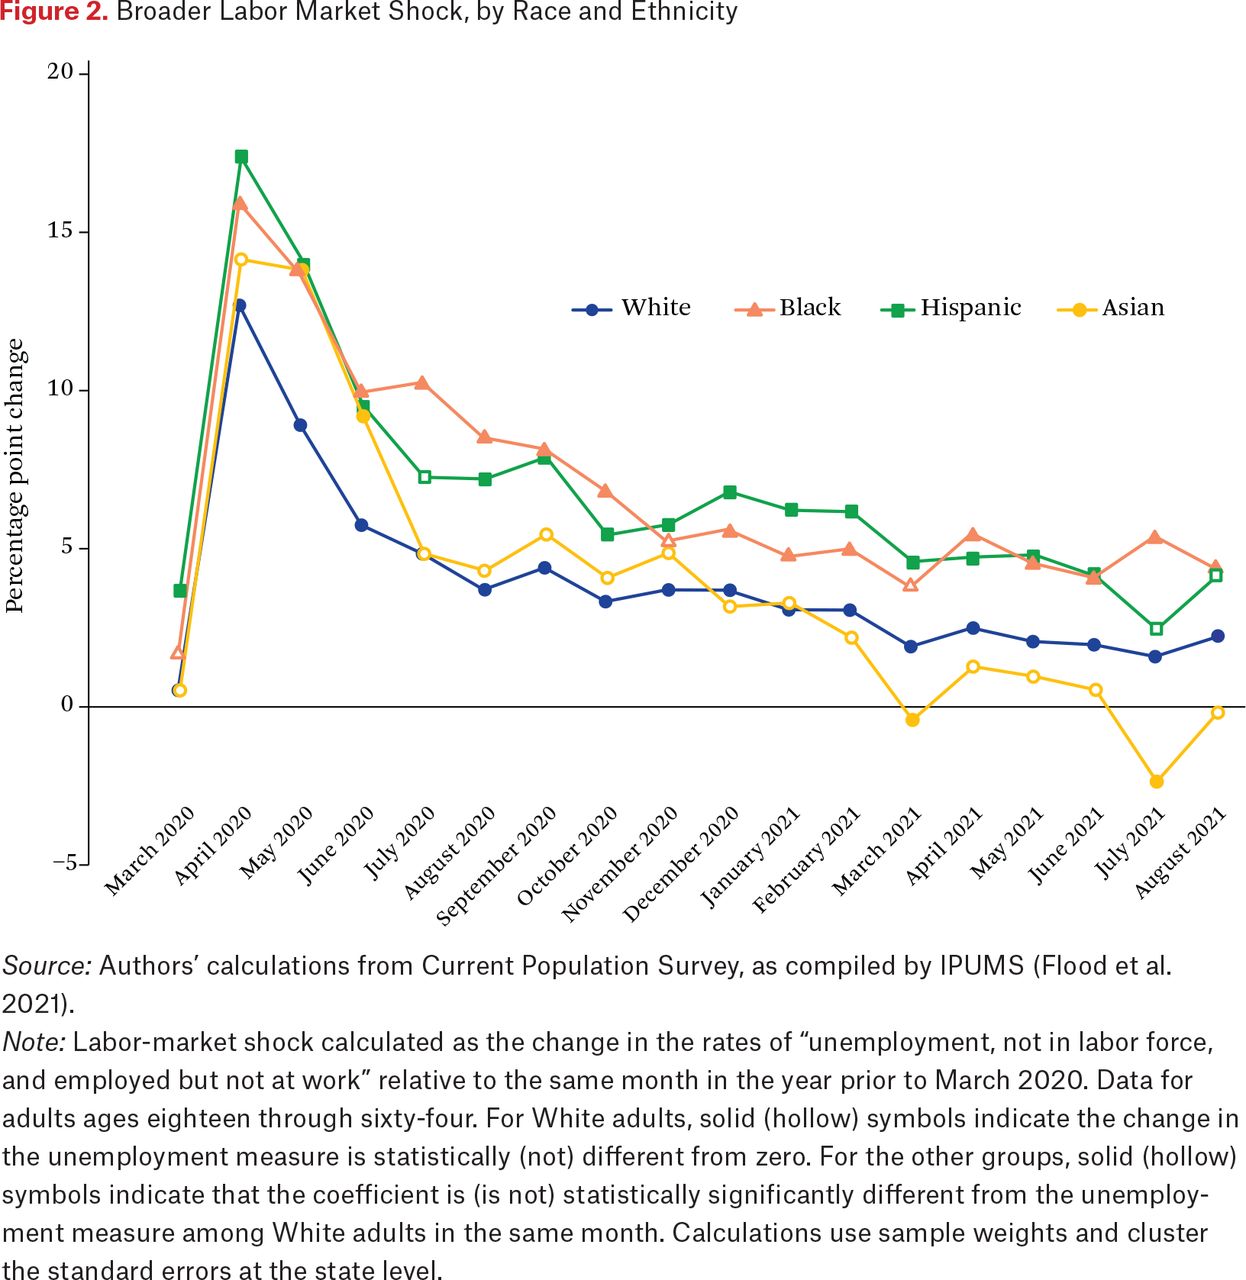
- Figure 2.
Broader Labor Market Shock, by Race and Ethnicity
Source: Authors’ calculations from Current Population Survey, as compiled by IPUMS (Flood et al. 2021).
Note: Labor-market shock calculated as the change in the rates of “unemployment, not in labor force, and employed but not at work” relative to the same month in the year prior to March 2020. Data for adults ages eighteen through sixty-four. For White adults, solid (hollow) symbols indicate the change in the unemployment measure is statistically (not) different from zero. For the other groups, solid (hollow) symbols indicate that the coefficient is (is not) statistically significantly different from the unemployment measure among White adults in the same month. Calculations use sample weights and cluster the standard errors at the state level.
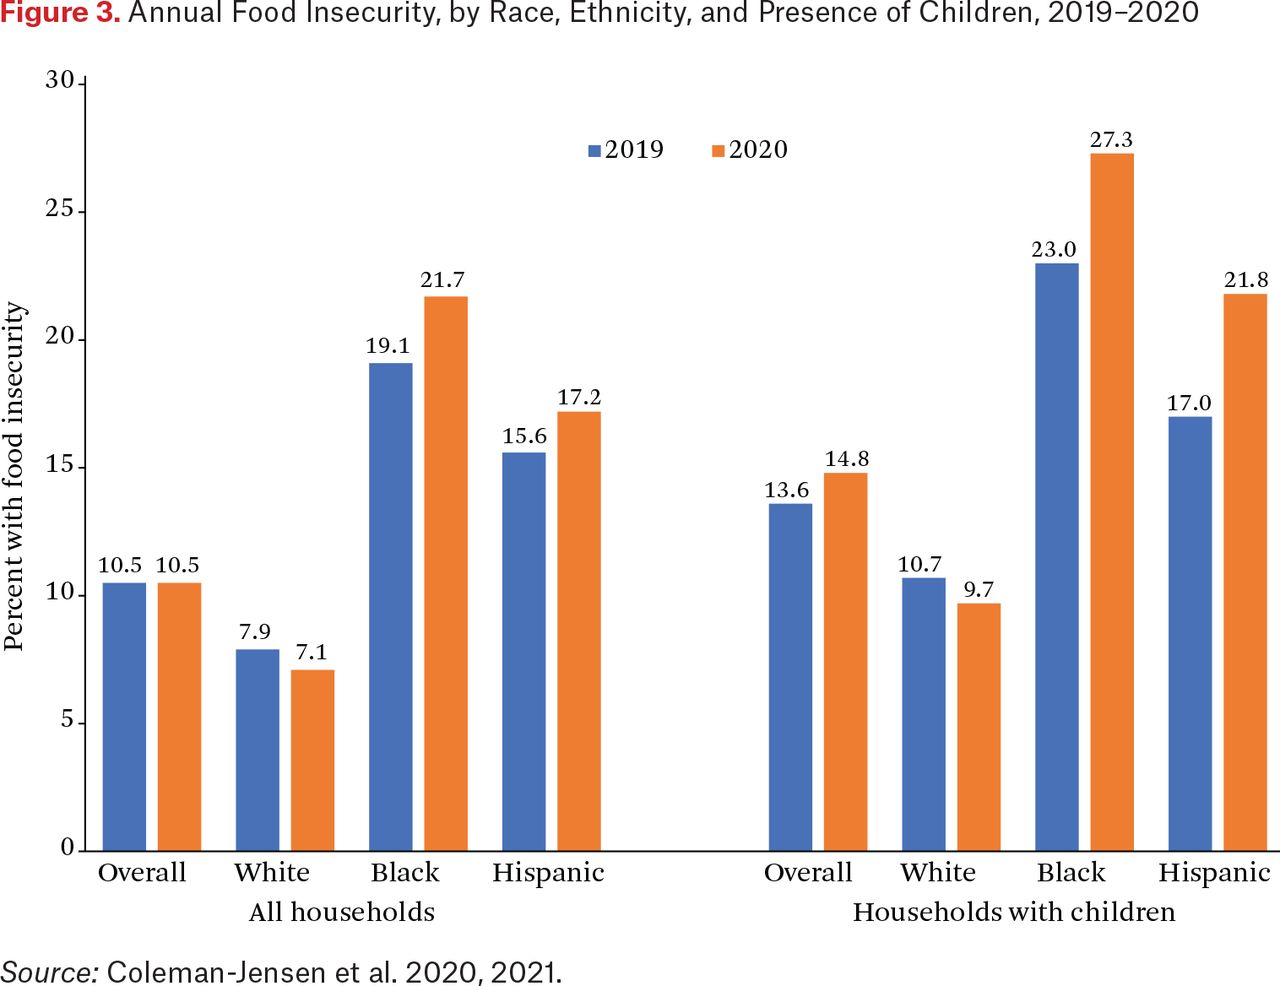
- Figure 3.
Annual Food Insecurity, by Race, Ethnicity, and Presence of Children, 2019–2020
Source: Coleman-Jensen et al. 2020, 2021.
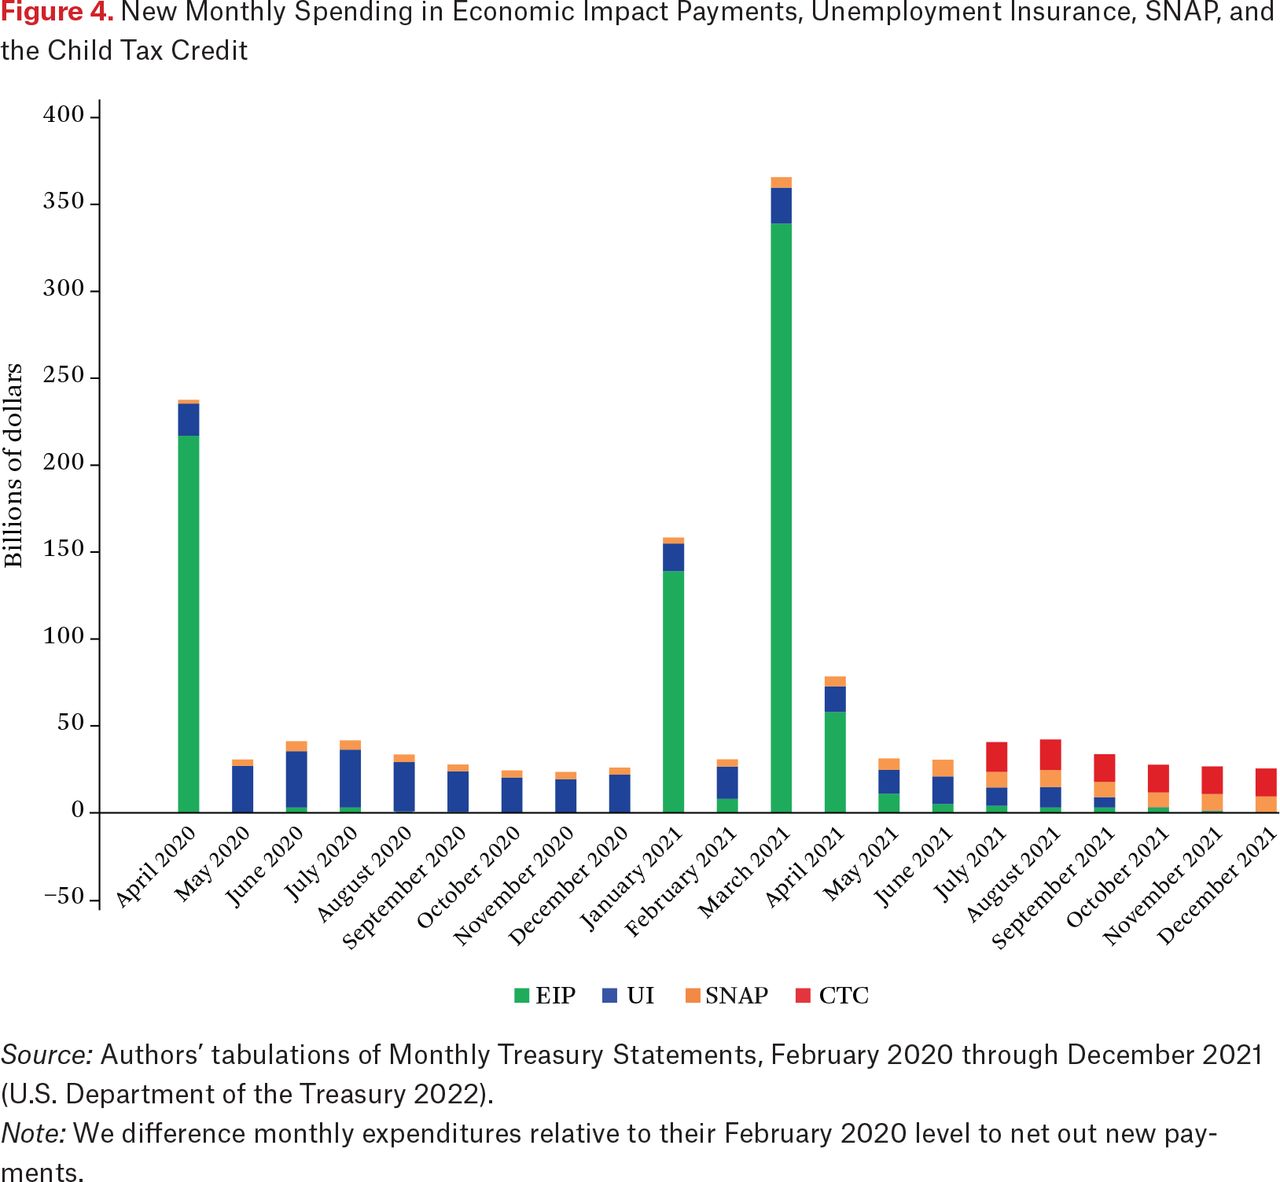
- Figure 4.
New Monthly Spending in Economic Impact Payments, Unemployment Insurance, SNAP, and the Child Tax Credit
Source: Authors’ tabulations of Monthly Treasury Statements, February 2020 through December 2021 (U.S. Department of the Treasury 2022).
Note: We difference monthly expenditures relative to their February 2020 level to net out new payments.
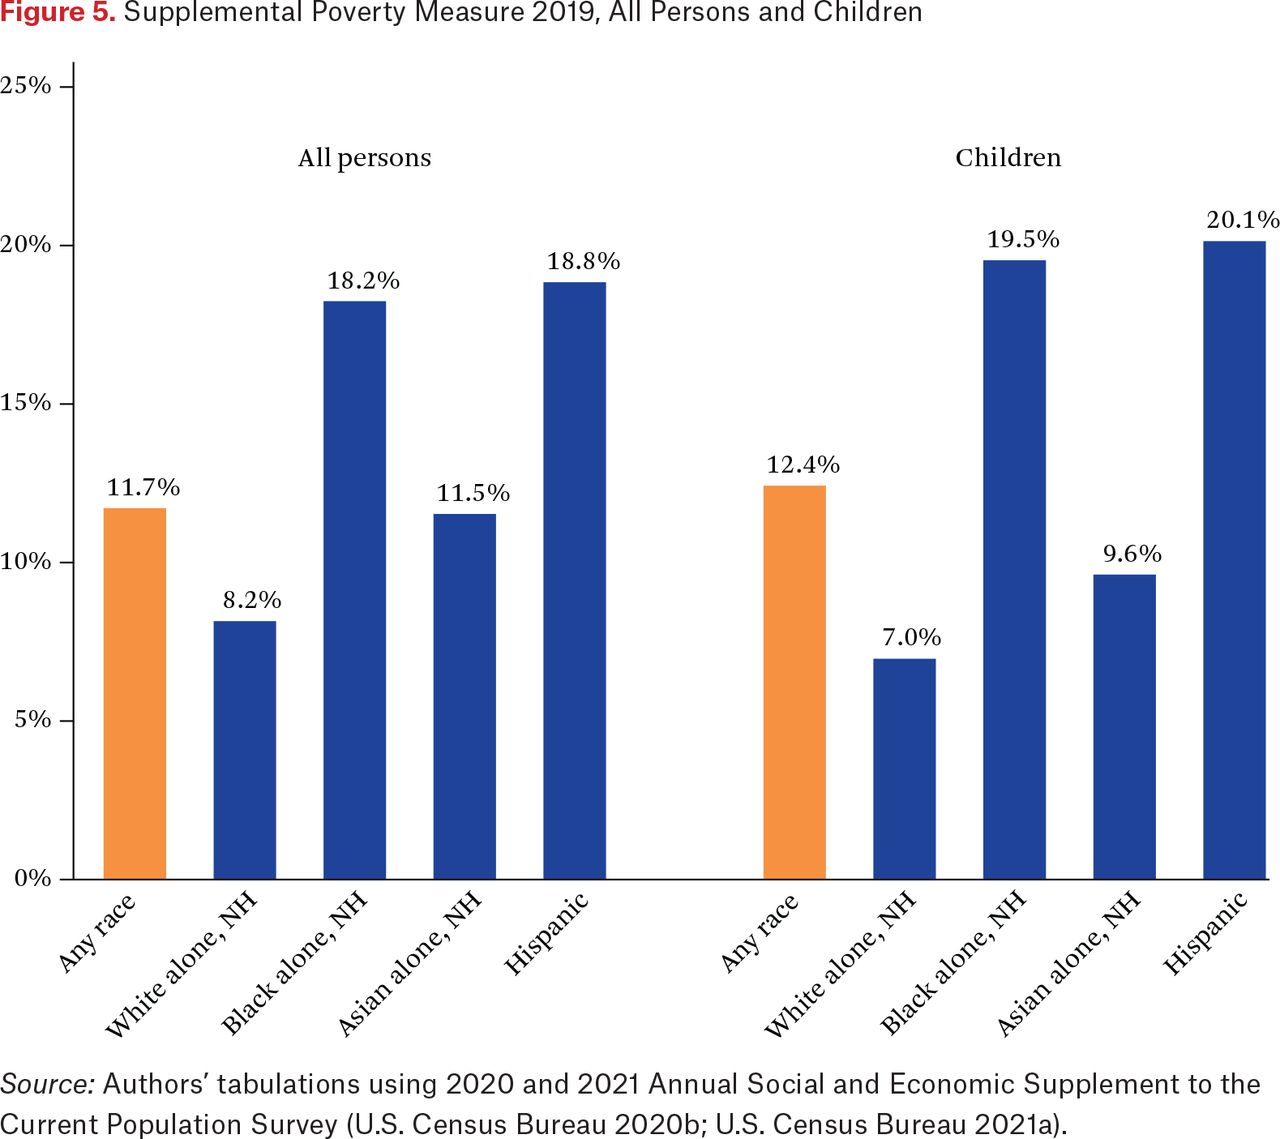
- Figure 5.
Supplemental Poverty Measure 2019, All Persons and Children
Source: Authors’ tabulations using 2020 and 2021 Annual Social and Economic Supplement to the Current Population Survey (U.S. Census Bureau 2020b; U.S. Census Bureau 2021a).
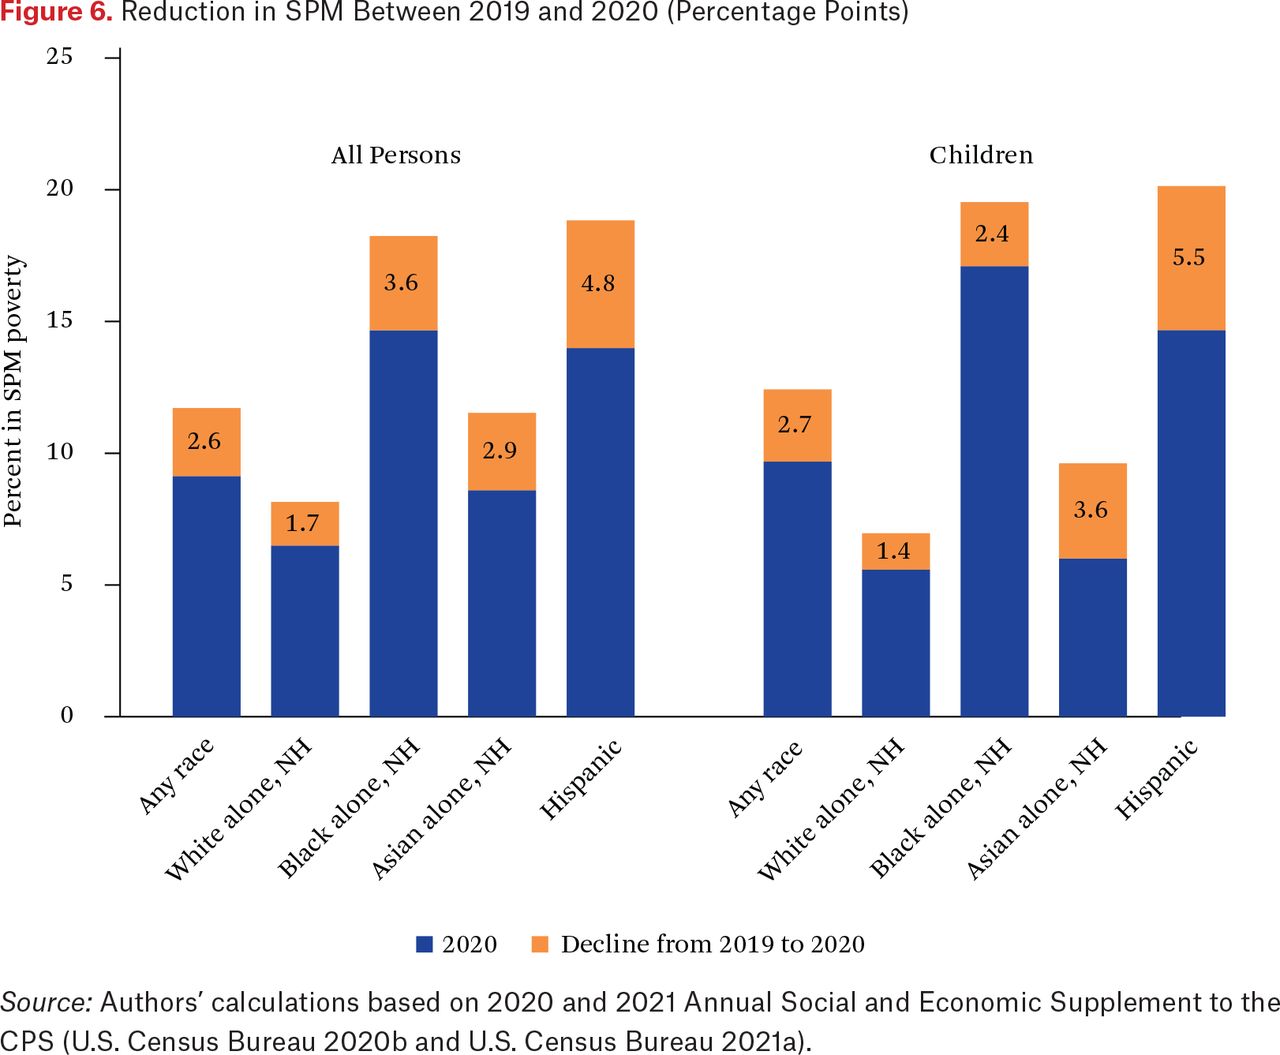
- Figure 6.
Reduction in SPM Between 2019 and 2020 (Percentage Points)
Source: Authors’ calculations based on 2020 and 2021 Annual Social and Economic Supplement to the CPS (U.S. Census Bureau 2020b and U.S. Census Bureau 2021a).
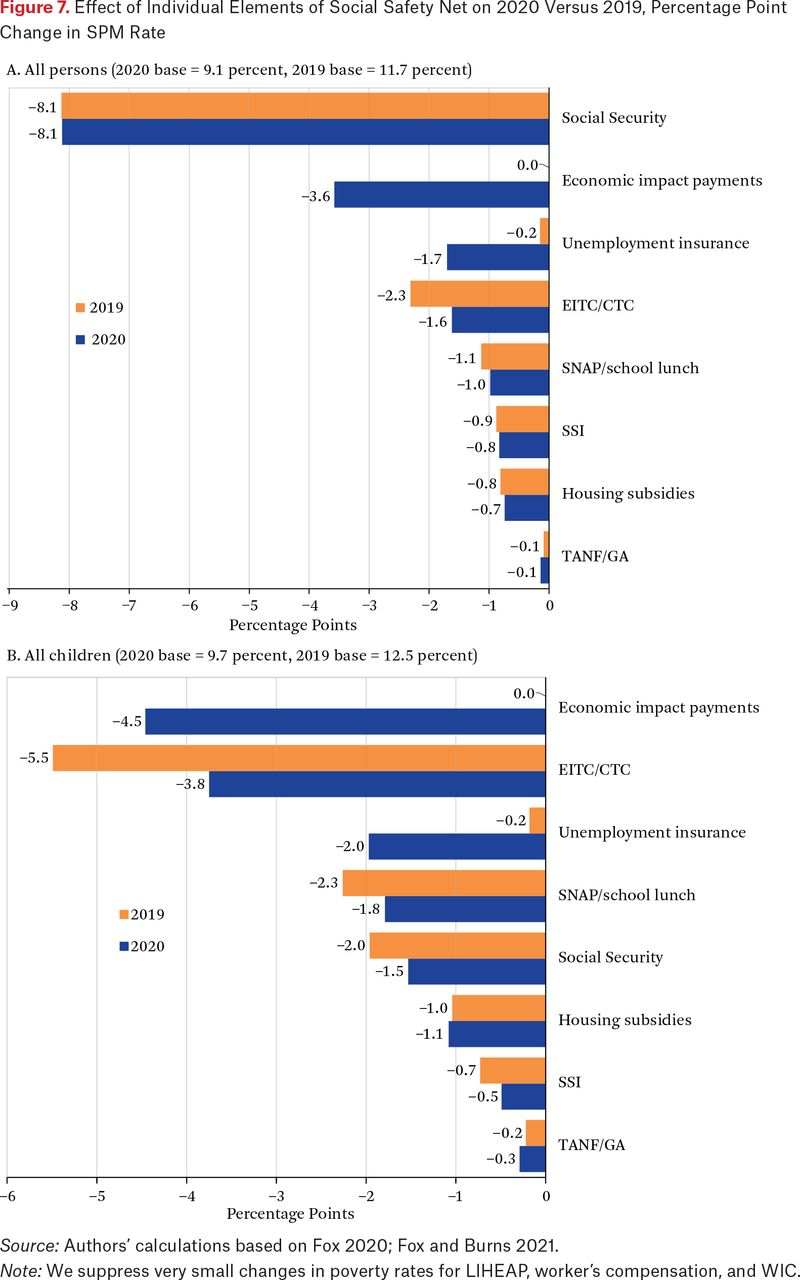
- Figure 7.
Effect of Individual Elements of Social Safety Net on 2020 Versus 2019, Percentage Point Change in SPM Rate
Source: Authors’ calculations based on Fox 2020; Fox and Burns 2021.
Note: We suppress very small changes in poverty rates for LIHEAP, worker’s compensation, and WIC.
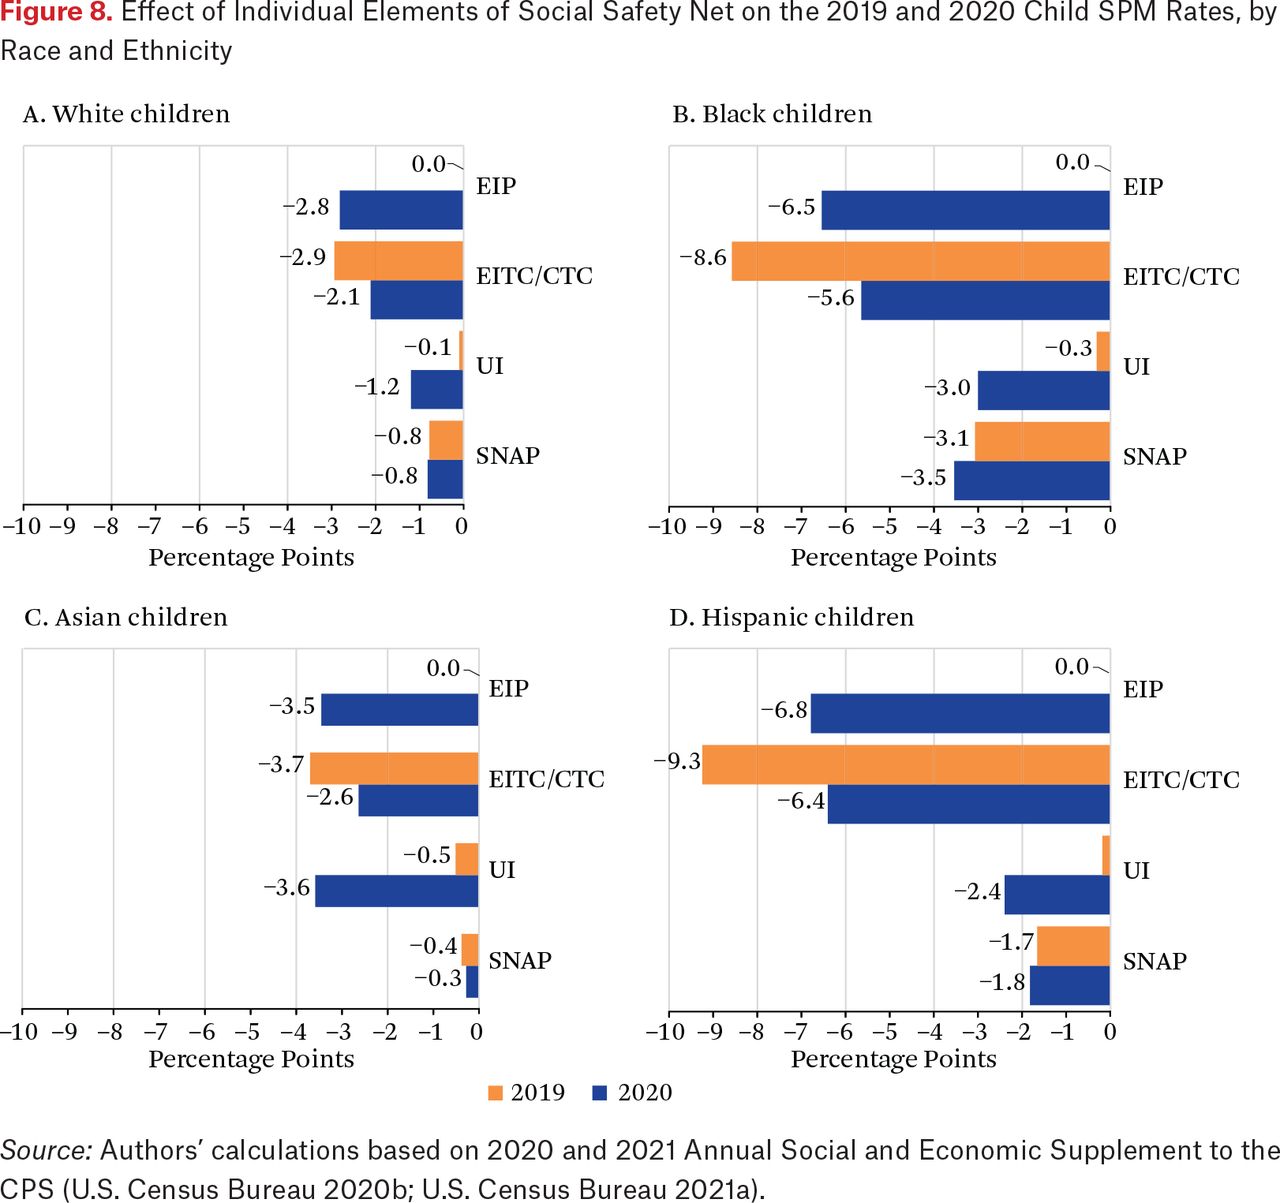
- Figure 8.
Effect of Individual Elements of Social Safety Net on the 2019 and 2020 Child SPM Rates, by Race and Ethnicity
Source: Authors’ calculations based on 2020 and 2021 Annual Social and Economic Supplement to the CPS (U.S. Census Bureau 2020b; U.S. Census Bureau 2021a).
- Figure 9.
Percentage Increase in SNAP Participation and Spending Relative to February 2020, February 2020–July 2021
Source: Authors’ calculations from USDA, Food and Nutrition Service, SNAP National Level Monthly Data (Food and Nutrition Service 2021b).
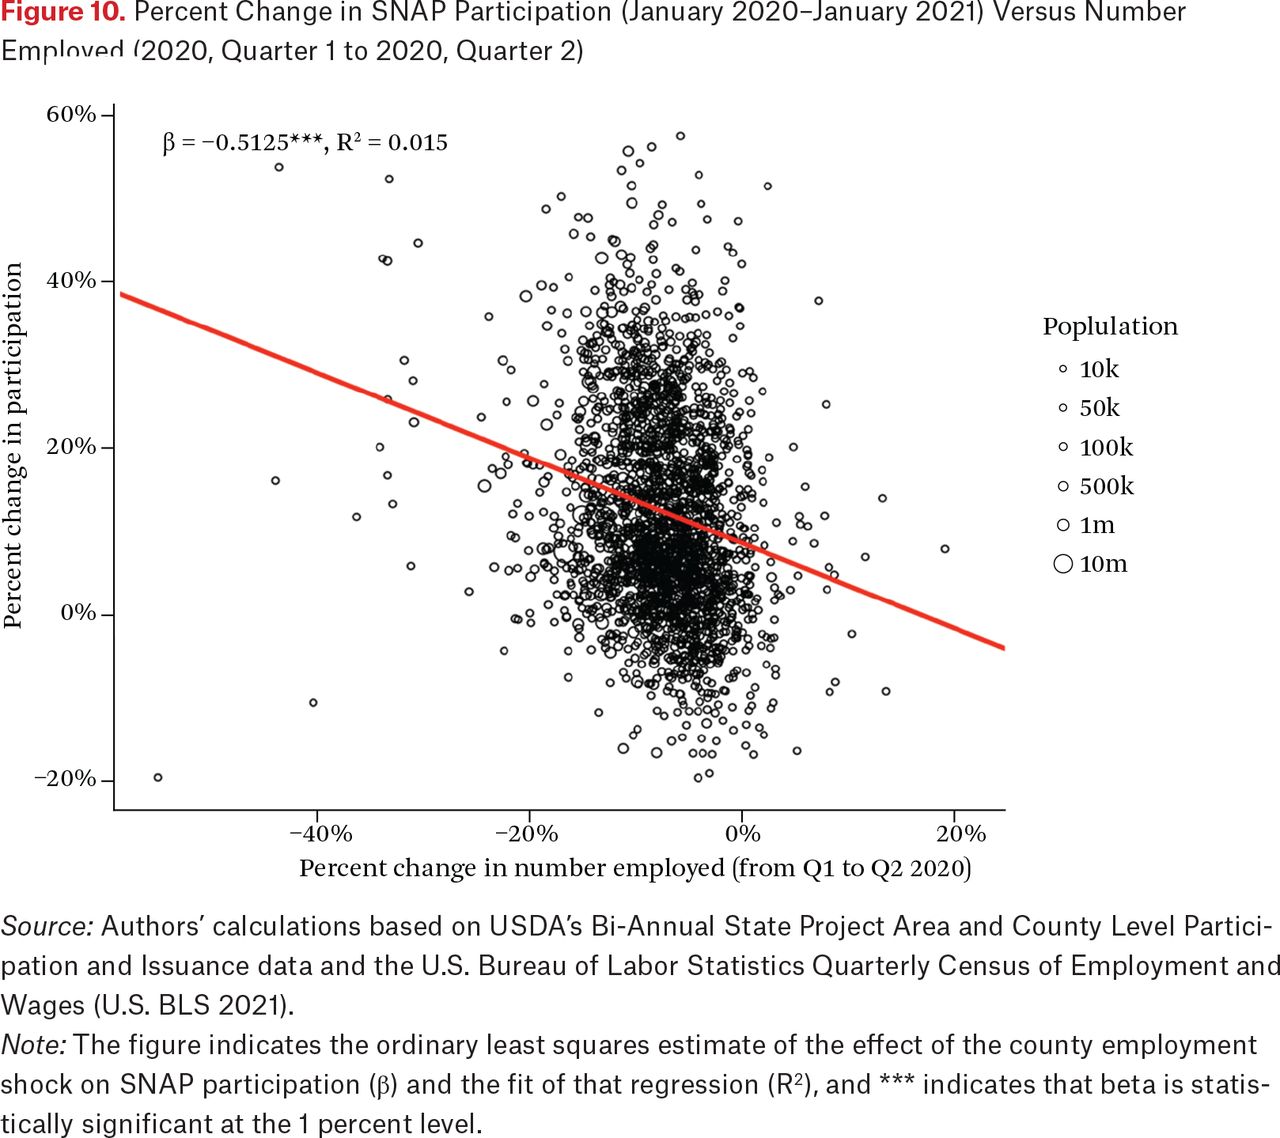
- Figure 10.
Percent Change in SNAP Participation (January 2020–January 2021) Versus Number Employed (2020, Quarter 1 to 2020, Quarter 2)
Source: Authors’ calculations based on USDA’s Bi-Annual State Project Area and County Level Participation and Issuance data and the U.S. Bureau of Labor Statistics Quarterly Census of Employment and Wages (U.S. BLS 2021).
Note: The figure indicates the ordinary least squares estimate of the effect of the county employment shock on SNAP participation (β) and the fit of that regression (R2), and *** indicates that beta is statistically significant at the 1 percent level.
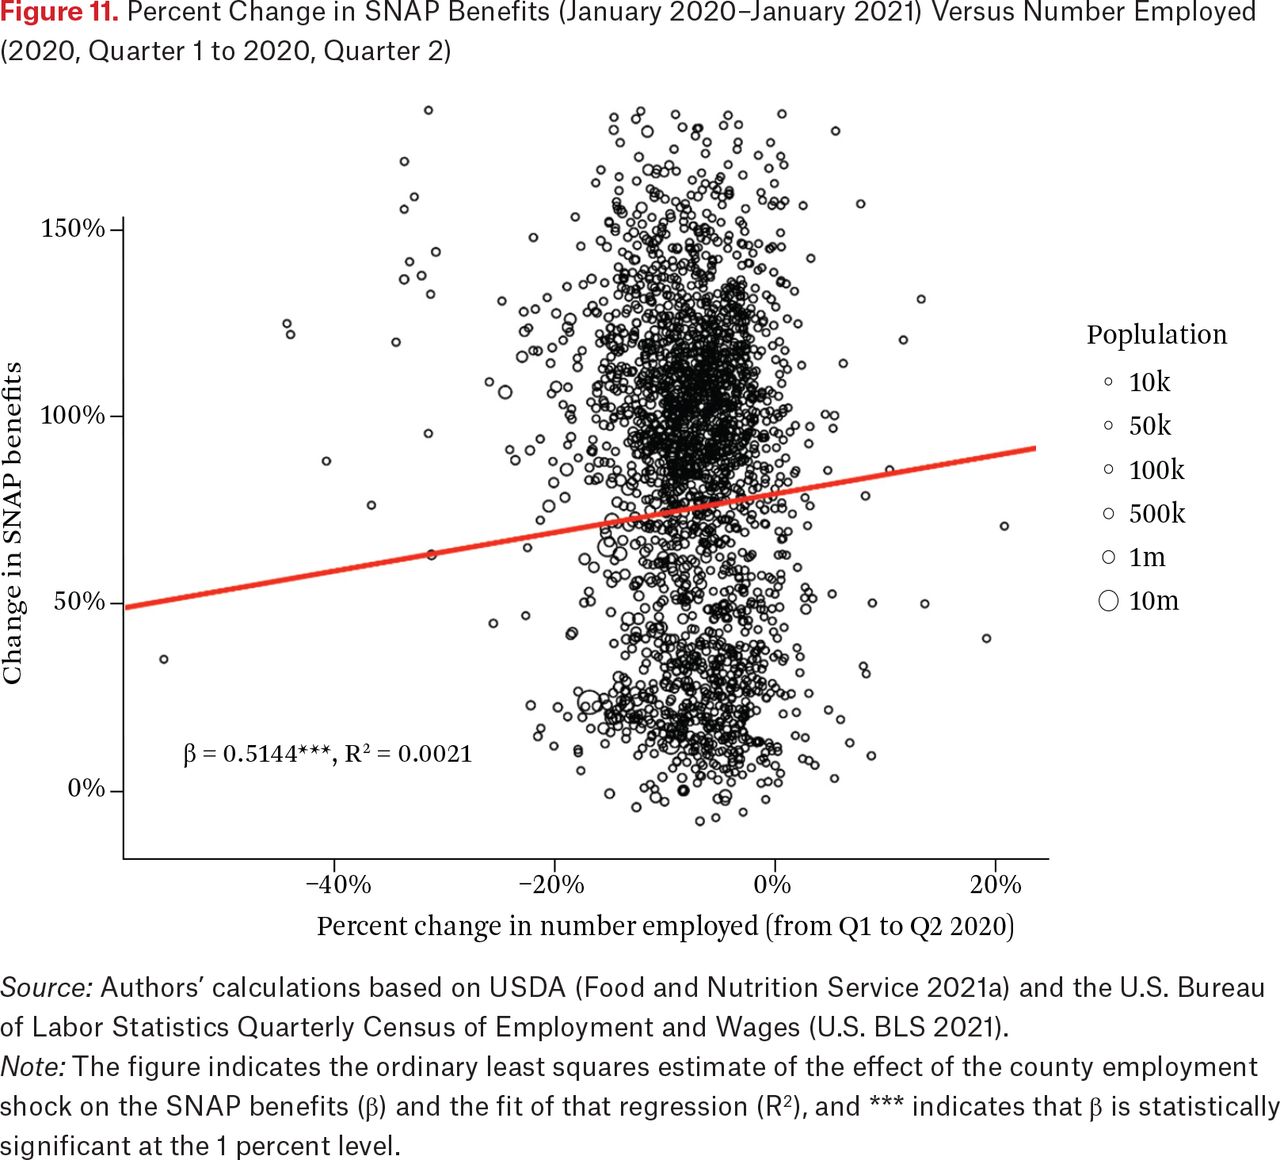
- Figure 11.
Percent Change in SNAP Benefits (January 2020–January 2021) Versus Number Employed (2020, Quarter 1 to 2020, Quarter 2)
Source: Authors’ calculations based on USDA (Food and Nutrition Service 2021a) and the U.S. Bureau of Labor Statistics Quarterly Census of Employment and Wages (U.S. BLS 2021).
Note: The figure indicates the ordinary least squares estimate of the effect of the county employment shock on the SNAP benefits (β) and the fit of that regression (R2), and *** indicates that β is statistically significant at the 1 percent level.
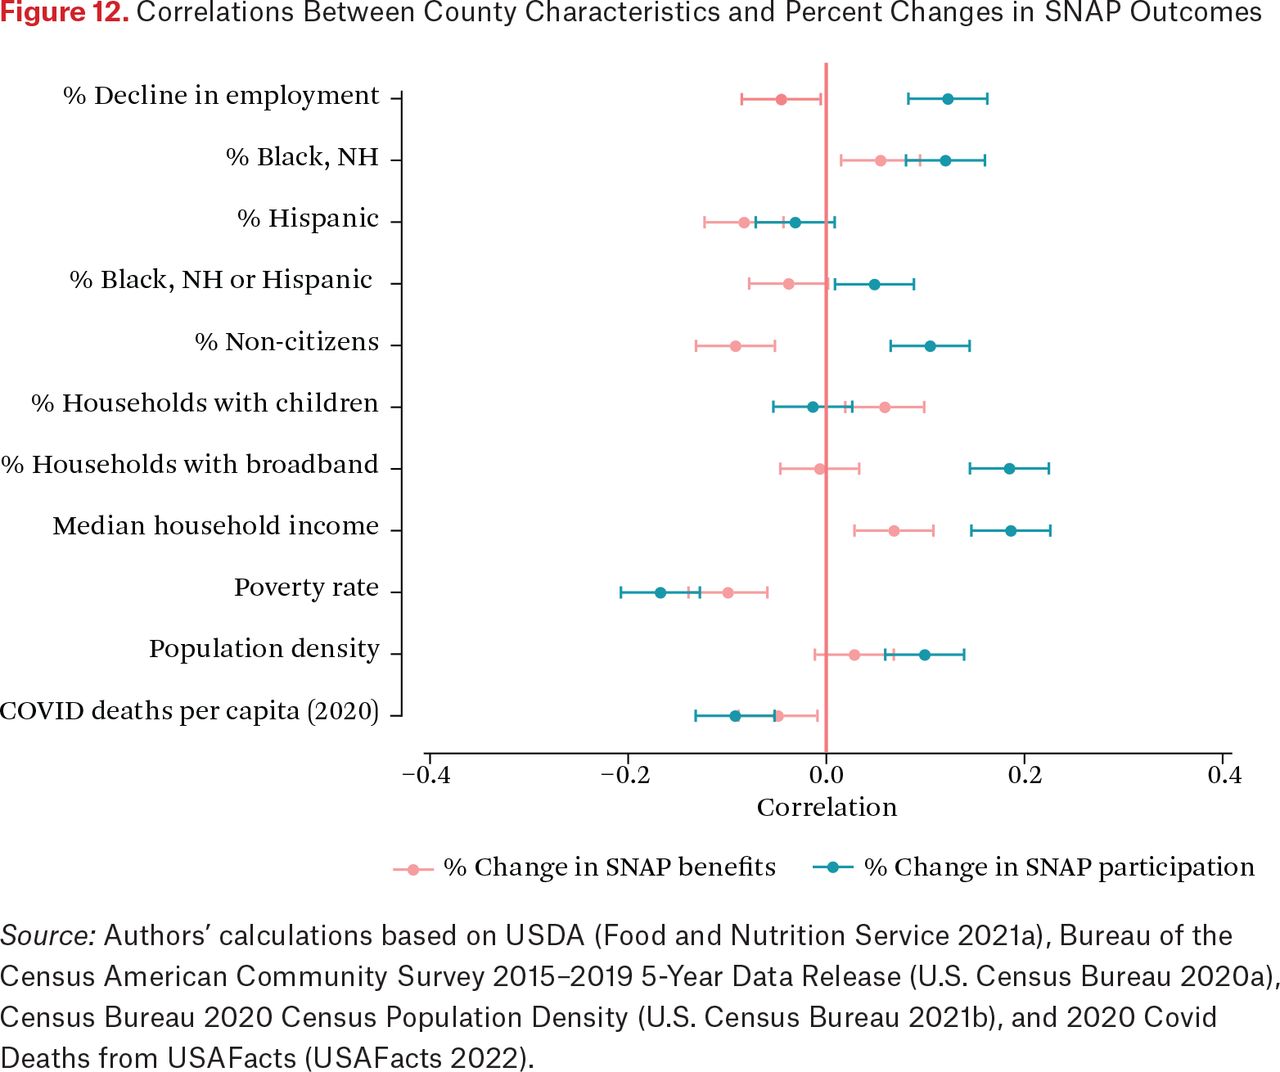
- Figure 12.
Correlations Between County Characteristics and Percent Changes in SNAP Outcomes
Source: Authors’ calculations based on USDA (Food and Nutrition Service 2021a), Bureau of the Census American Community Survey 2015–2019 5-Year Data Release (U.S. Census Bureau 2020a), Census Bureau 2020 Census Population Density (U.S. Census Bureau 2021b), and 2020 Covid Deaths from USAFacts (USAFacts 2022).


Tables
In this issue


Jump to section
Related Articles
Cited By...
- No citing articles found.