
Article Figures & Data
Figures
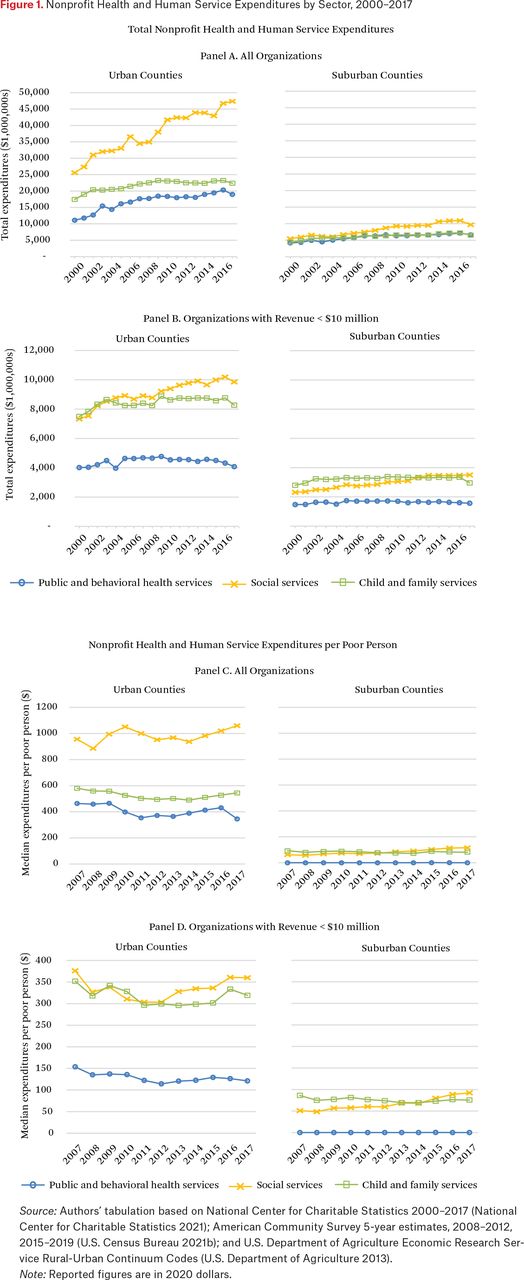
- Figure 1.
Nonprofit Health and Human Service Expenditures by Sector, 2000–2017
Source: Authors’ tabulation based on National Center for Charitable Statistics 2000–2017 (National Center for Charitable Statistics 2021); American Community Survey 5-year estimates, 2008–2012, 2015–2019 (U.S. Census Bureau 2021b); and U.S. Department of Agriculture Economic Research Service Rural-Urban Continuum Codes (U.S. Department of Agriculture 2013).
Note: Reported figures are in 2020 dollars.
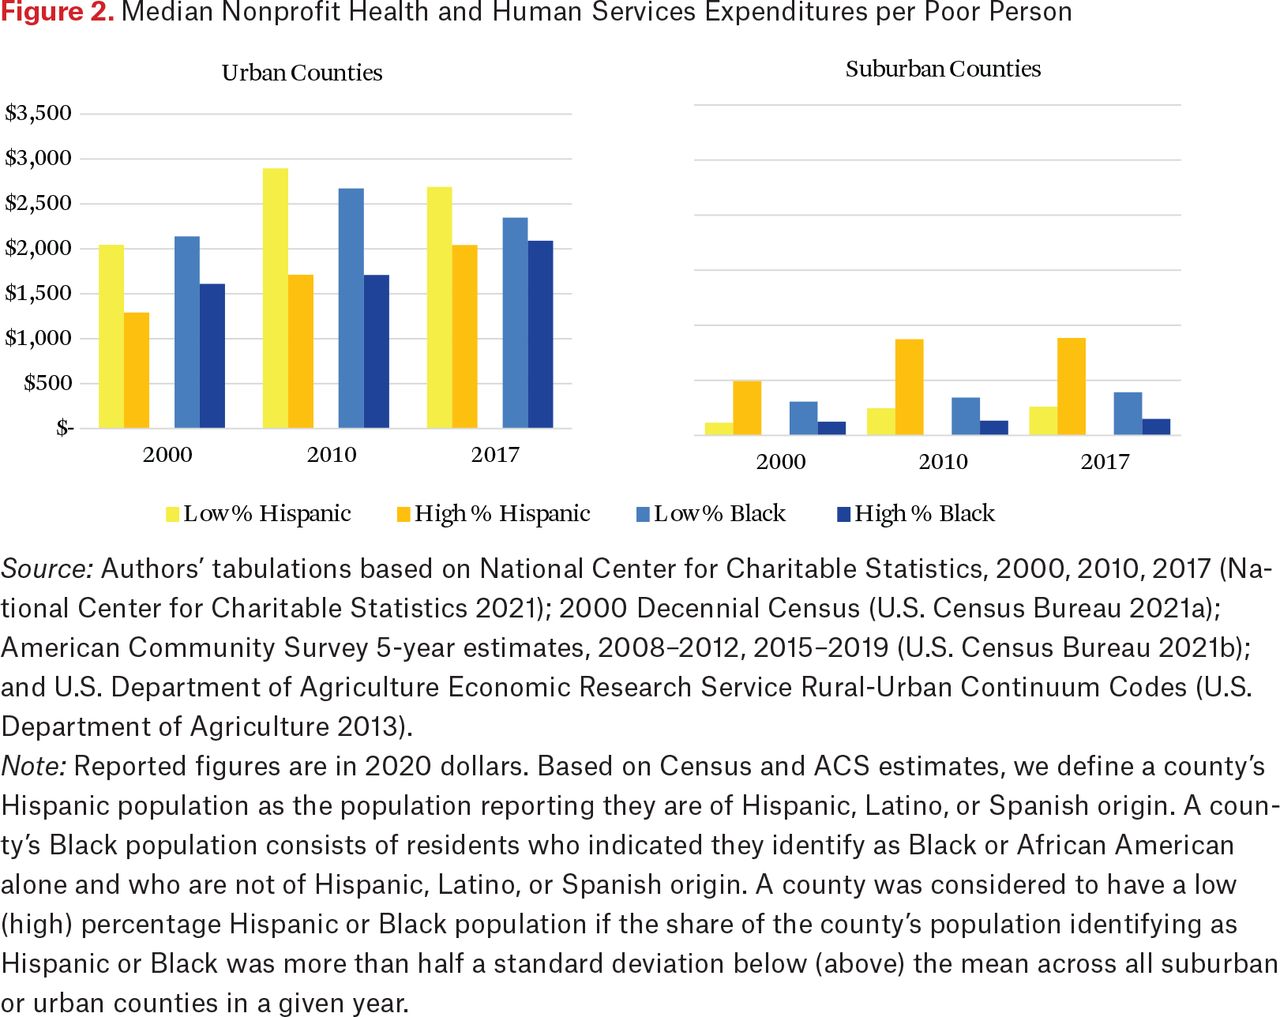
- Figure 2.
Median Nonprofit Health and Human Services Expenditures per Poor Person
Source: Authors’ tabulations based on National Center for Charitable Statistics, 2000, 2010, 2017 (National Center for Charitable Statistics 2021); 2000 Decennial Census (U.S. Census Bureau 2021a); American Community Survey 5-year estimates, 2008–2012, 2015–2019 (U.S. Census Bureau 2021b); and U.S. Department of Agriculture Economic Research Service Rural-Urban Continuum Codes (U.S. Department of Agriculture 2013).
Note: Reported figures are in 2020 dollars. Based on Census and ACS estimates, we define a county’s Hispanic population as the population reporting they are of Hispanic, Latino, or Spanish origin. A county’s Black population consists of residents who indicated they identify as Black or African American alone and who are not of Hispanic, Latino, or Spanish origin. A county was considered to have a low (high) percentage Hispanic or Black population if the share of the county’s population identifying as Hispanic or Black was more than half a standard deviation below (above) the mean across all suburban or urban counties in a given year.
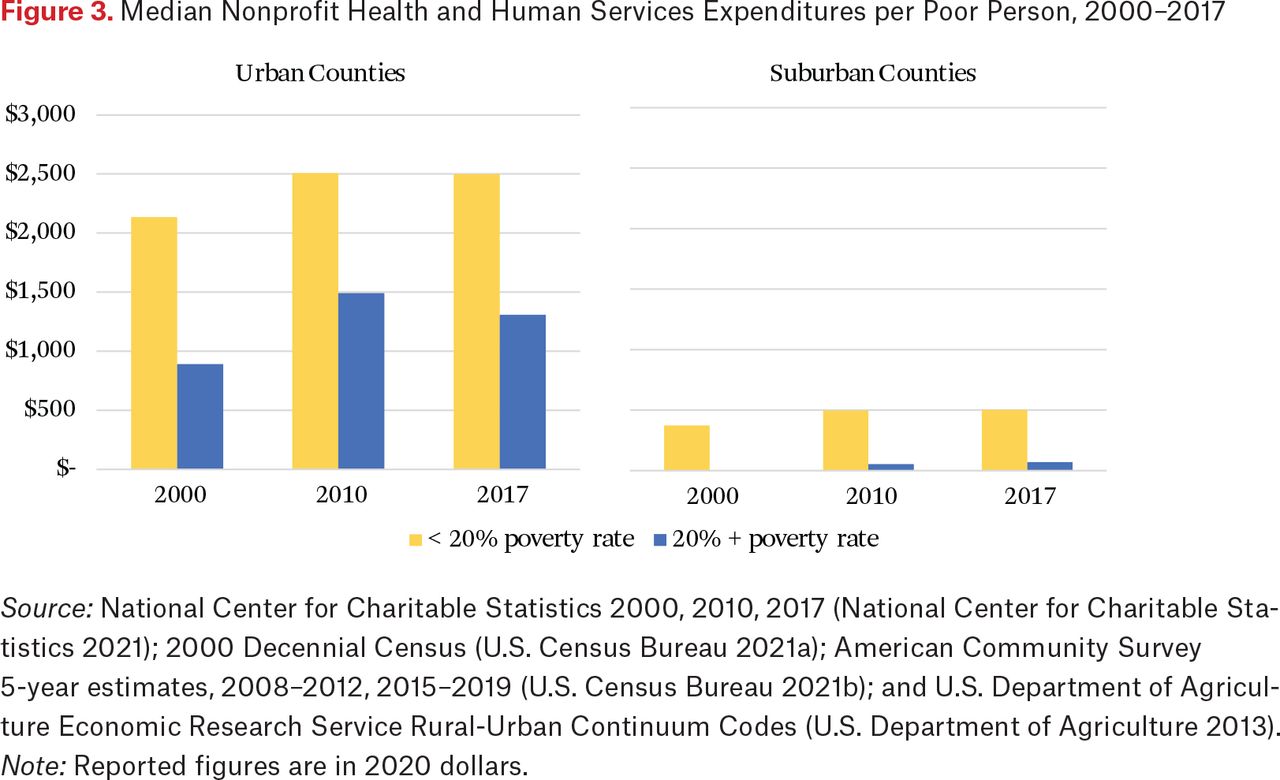
- Figure 3.
Median Nonprofit Health and Human Services Expenditures per Poor Person, 2000–2017
Source: National Center for Charitable Statistics 2000, 2010, 2017 (National Center for Charitable Statistics 2021); 2000 Decennial Census (U.S. Census Bureau 2021a); American Community Survey 5-year estimates, 2008–2012, 2015–2019 (U.S. Census Bureau 2021b); and U.S. Department of Agriculture Economic Research Service Rural-Urban Continuum Codes (U.S. Department of Agriculture 2013).
Note: Reported figures are in 2020 dollars.
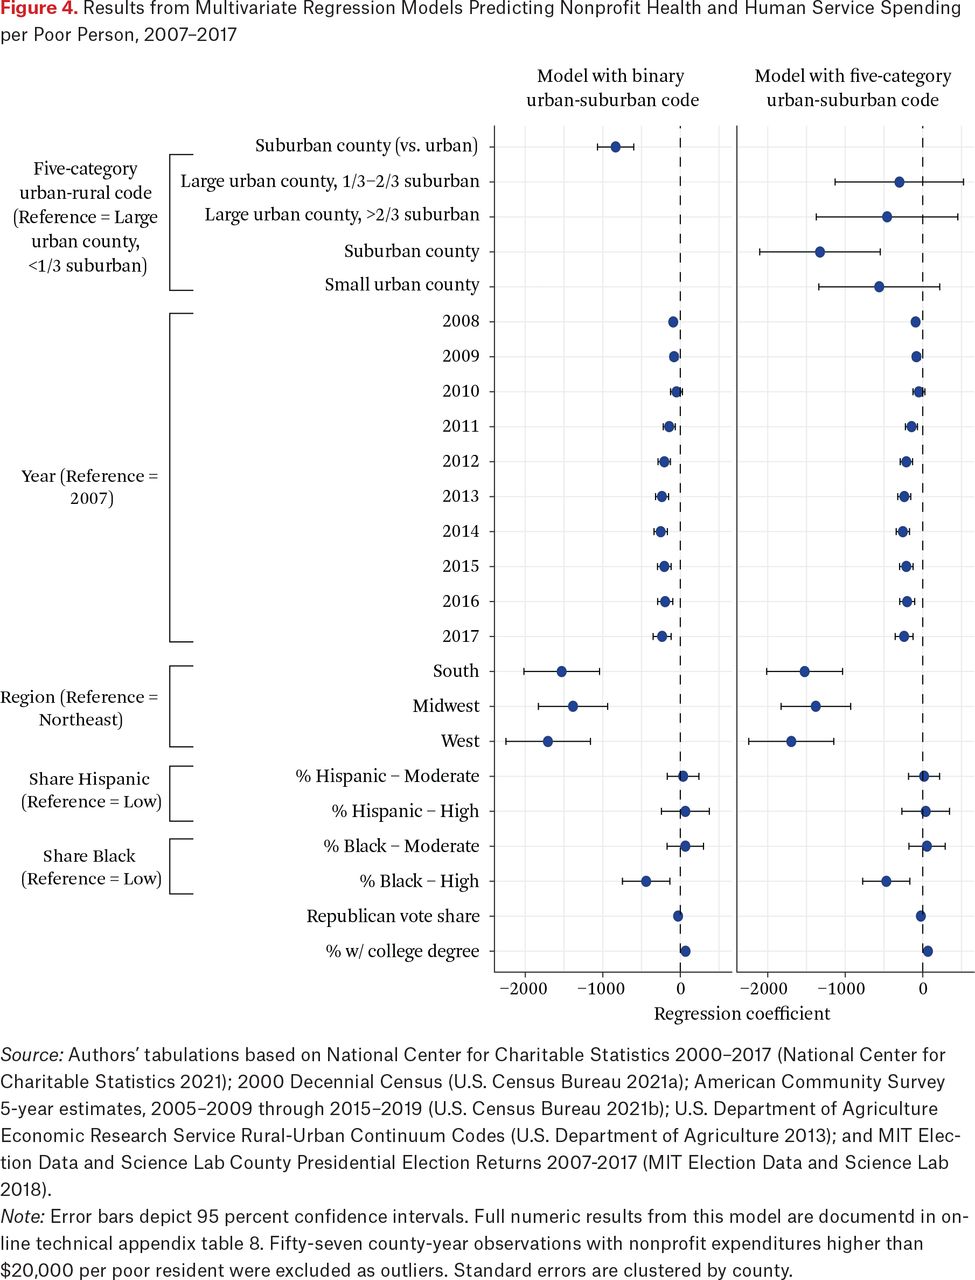
- Figure 4.
Results from Multivariate Regression Models Predicting Nonprofit Health and Human Service Spending per Poor Person, 2007–2017
Source: Authors’ tabulations based on National Center for Charitable Statistics 2000–2017 (National Center for Charitable Statistics 2021); 2000 Decennial Census (U.S. Census Bureau 2021a); American Community Survey 5-year estimates, 2005–2009 through 2015–2019 (U.S. Census Bureau 2021b); U.S. Department of Agriculture Economic Research Service Rural-Urban Continuum Codes (U.S. Department of Agriculture 2013); and MIT Election Data and Science Lab County Presidential Election Returns 2007-2017 (MIT Election Data and Science Lab 2018).
Note: Error bars depict 95 percent confidence intervals. Full numeric results from this model are documentd in online technical appendix table 8. Fifty-seven county-year observations with nonprofit expenditures higher than $20,000 per poor resident were excluded as outliers. Standard errors are clustered by county.
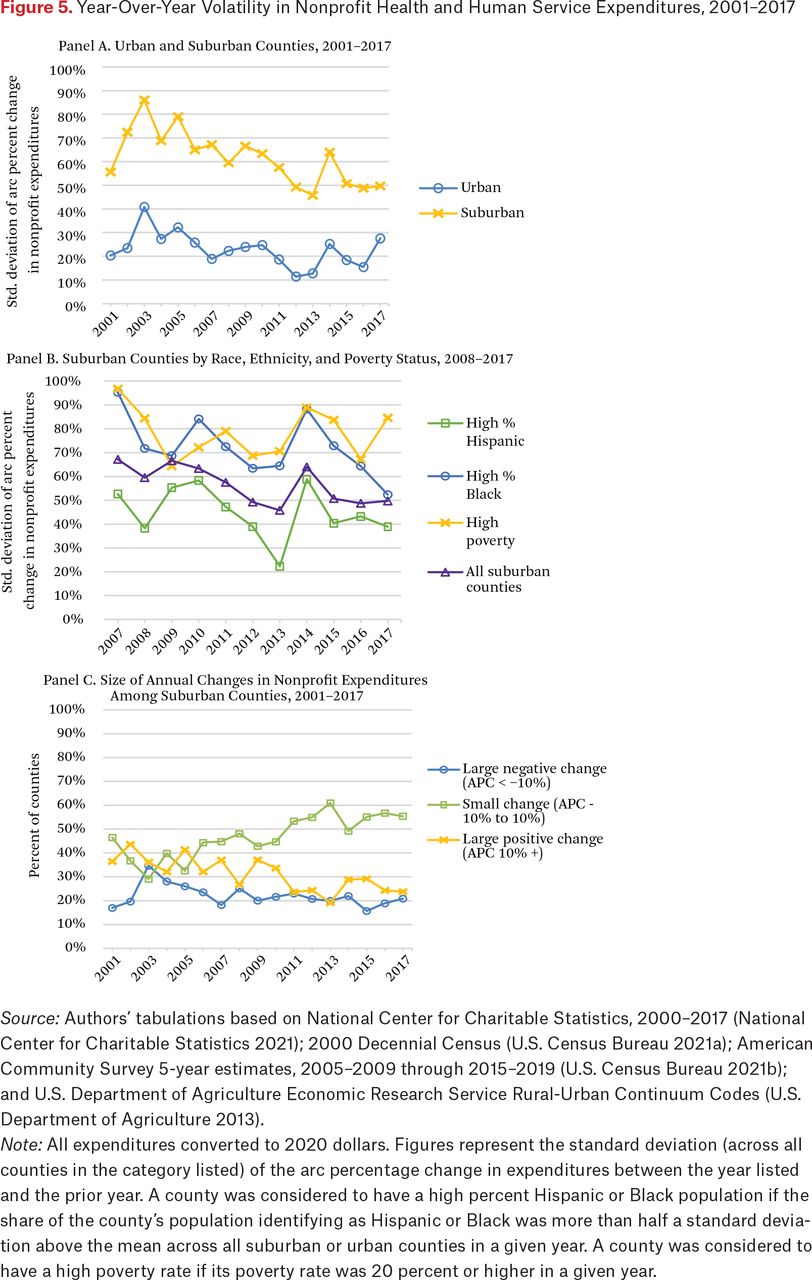
- Figure 5.
Year-Over-Year Volatility in Nonprofit Health and Human Service Expenditures, 2001–2017
Source: Authors’ tabulations based on National Center for Charitable Statistics, 2000–2017 (National Center for Charitable Statistics 2021); 2000 Decennial Census (U.S. Census Bureau 2021a); American Community Survey 5-year estimates, 2005–2009 through 2015–2019 (U.S. Census Bureau 2021b); and U.S. Department of Agriculture Economic Research Service Rural-Urban Continuum Codes (U.S. Department of Agriculture 2013).
Note: All expenditures converted to 2020 dollars. Figures represent the standard deviation (across all counties in the category listed) of the arc percentage change in expenditures between the year listed and the prior year. A county was considered to have a high percent Hispanic or Black population if the share of the county’s population identifying as Hispanic or Black was more than half a standard deviation above the mean across all suburban or urban counties in a given year. A county was considered to have a high poverty rate if its poverty rate was 20 percent or higher in a given year.
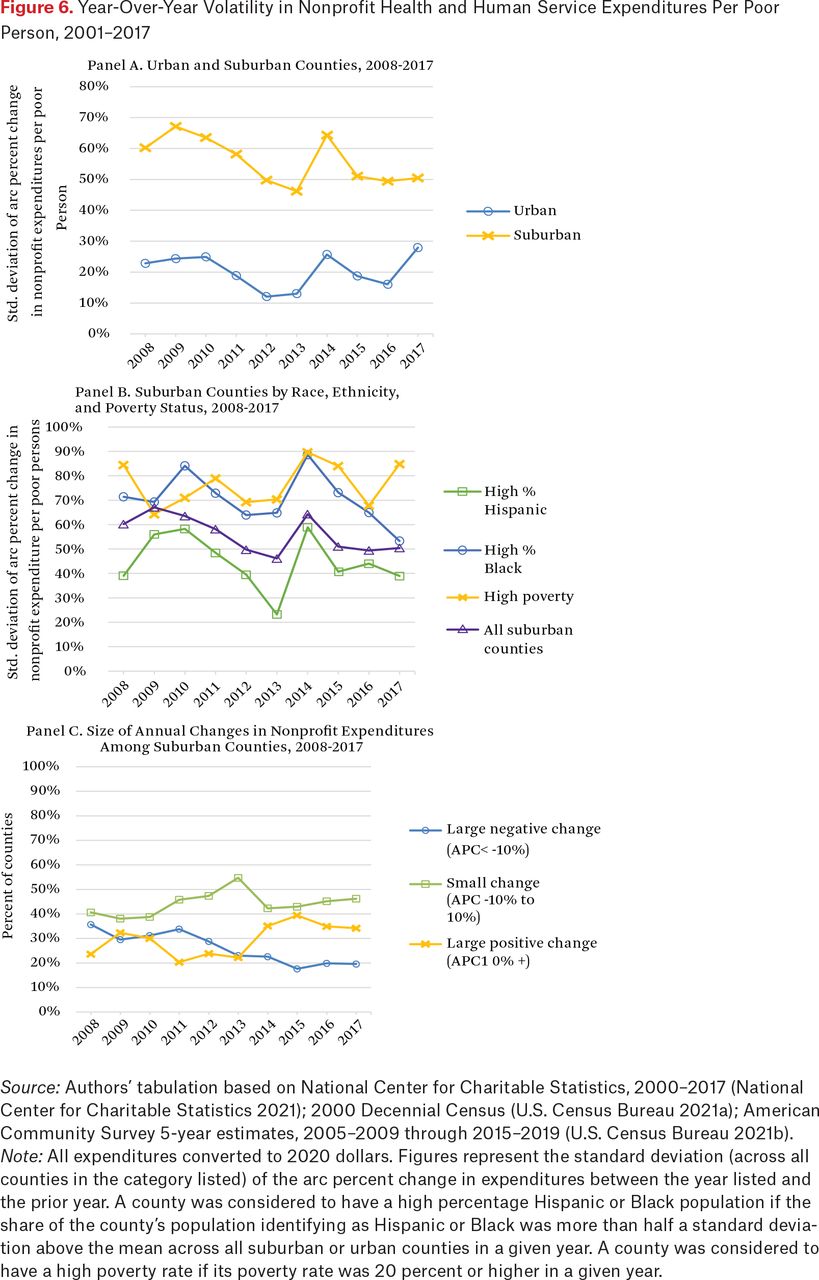
- Figure 6.
Year-Over-Year Volatility in Nonprofit Health and Human Service Expenditures Per Poor Person, 2001–2017
Source: Authors’ tabulation based on National Center for Charitable Statistics, 2000–2017 (National Center for Charitable Statistics 2021); 2000 Decennial Census (U.S. Census Bureau 2021a); American Community Survey 5-year estimates, 2005–2009 through 2015–2019 (U.S. Census Bureau 2021b).
Note: All expenditures converted to 2020 dollars. Figures represent the standard deviation (across all counties in the category listed) of the arc percent change in expenditures between the year listed and the prior year. A county was considered to have a high percentage Hispanic or Black population if the share of the county’s population identifying as Hispanic or Black was more than half a standard deviation above the mean across all suburban or urban counties in a given year. A county was considered to have a high poverty rate if its poverty rate was 20 percent or higher in a given year.
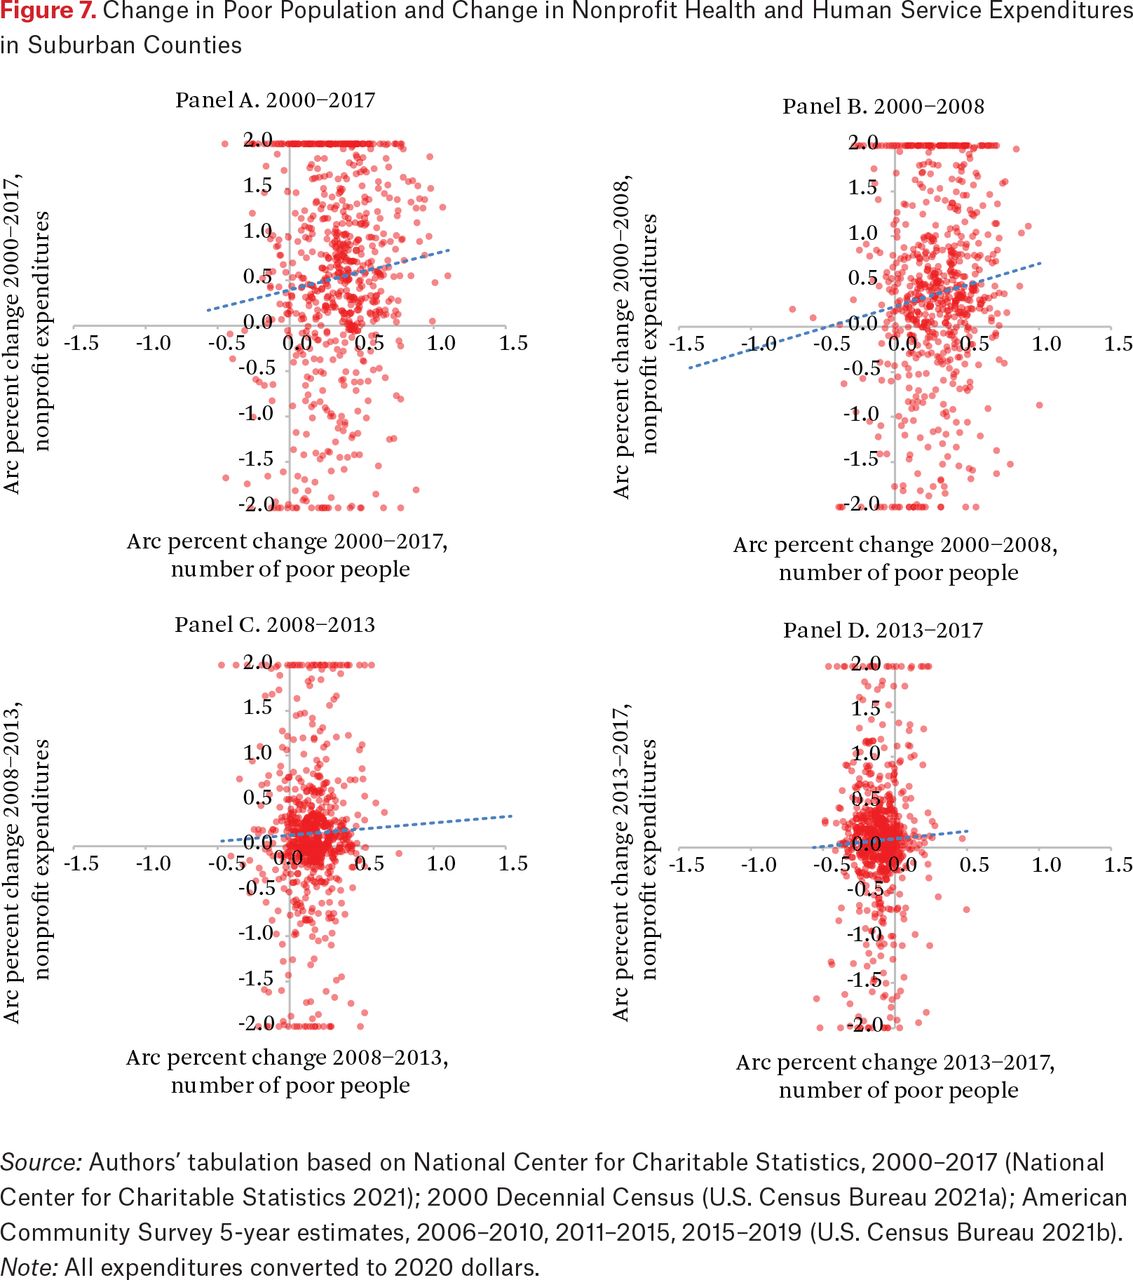
- Figure 7.
Change in Poor Population and Change in Nonprofit Health and Human Service Expenditures in Suburban Counties
Source: Authors’ tabulation based on National Center for Charitable Statistics, 2000–2017 (National Center for Charitable Statistics 2021); 2000 Decennial Census (U.S. Census Bureau 2021a); American Community Survey 5-year estimates, 2006–2010, 2011–2015, 2015–2019 (U.S. Census Bureau 2021b).
Note: All expenditures converted to 2020 dollars.


Tables
Online Appendix
Online Appendix
Files in this Data Supplement:
- Online Appendix - Online Appendix
In this issue


Jump to section
Related Articles
Cited By...
- No citing articles found.