
Article Figures & Data
Figures
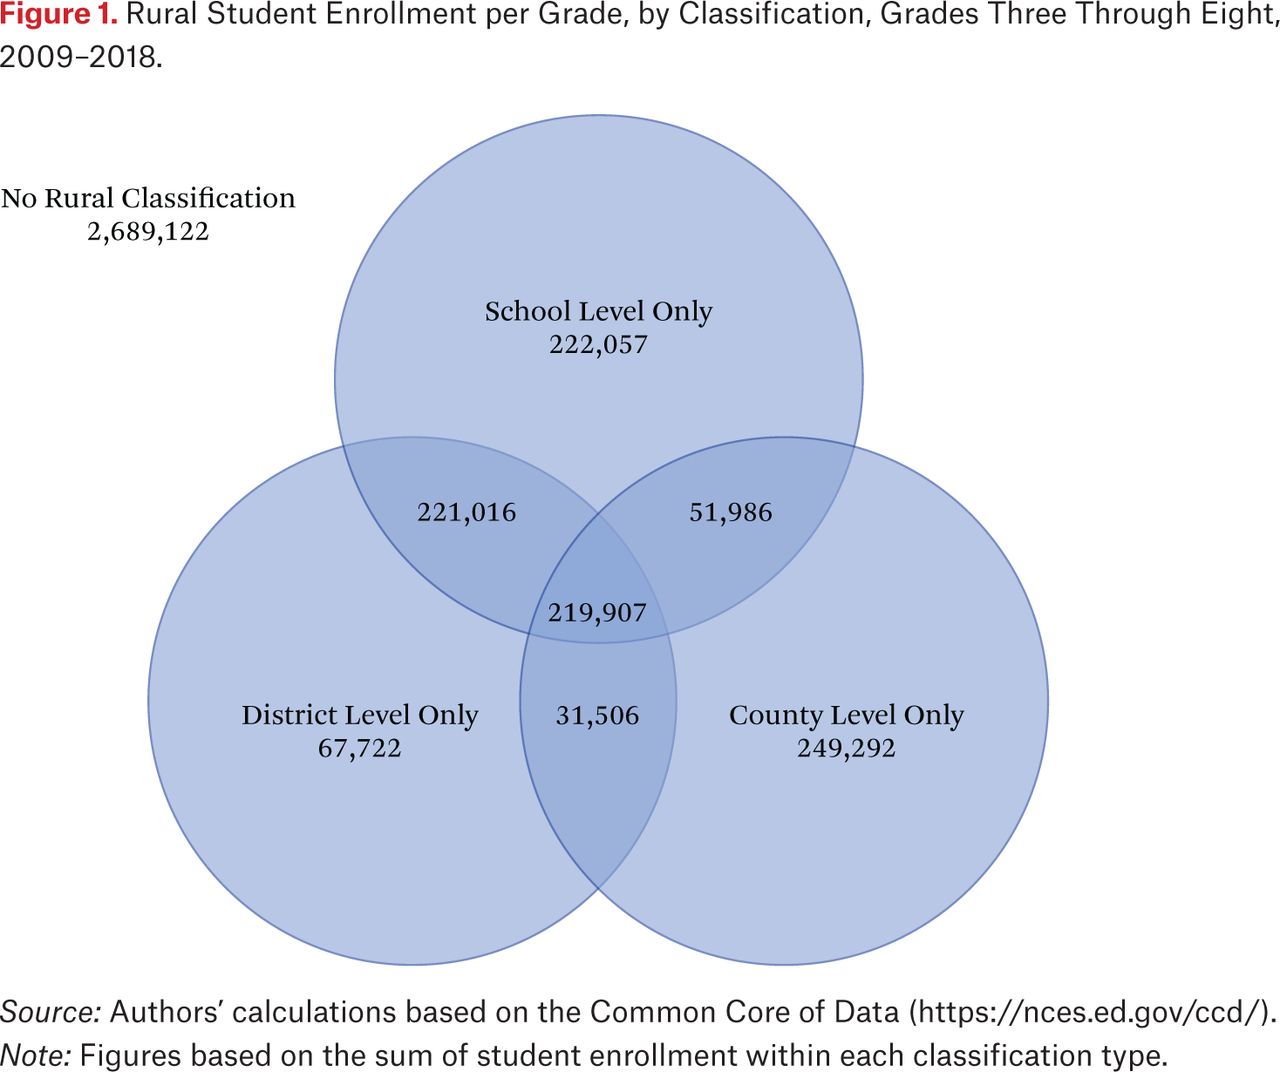
- Figure 1.
Rural Student Enrollment per Grade, by Classification, Grades Three Through Eight, 2009–2018.
Source: Authors’ calculations based on the Common Core of Data (https://nces.ed.gov/ccd/).
Note: Figures based on the sum of student enrollment within each classification type.
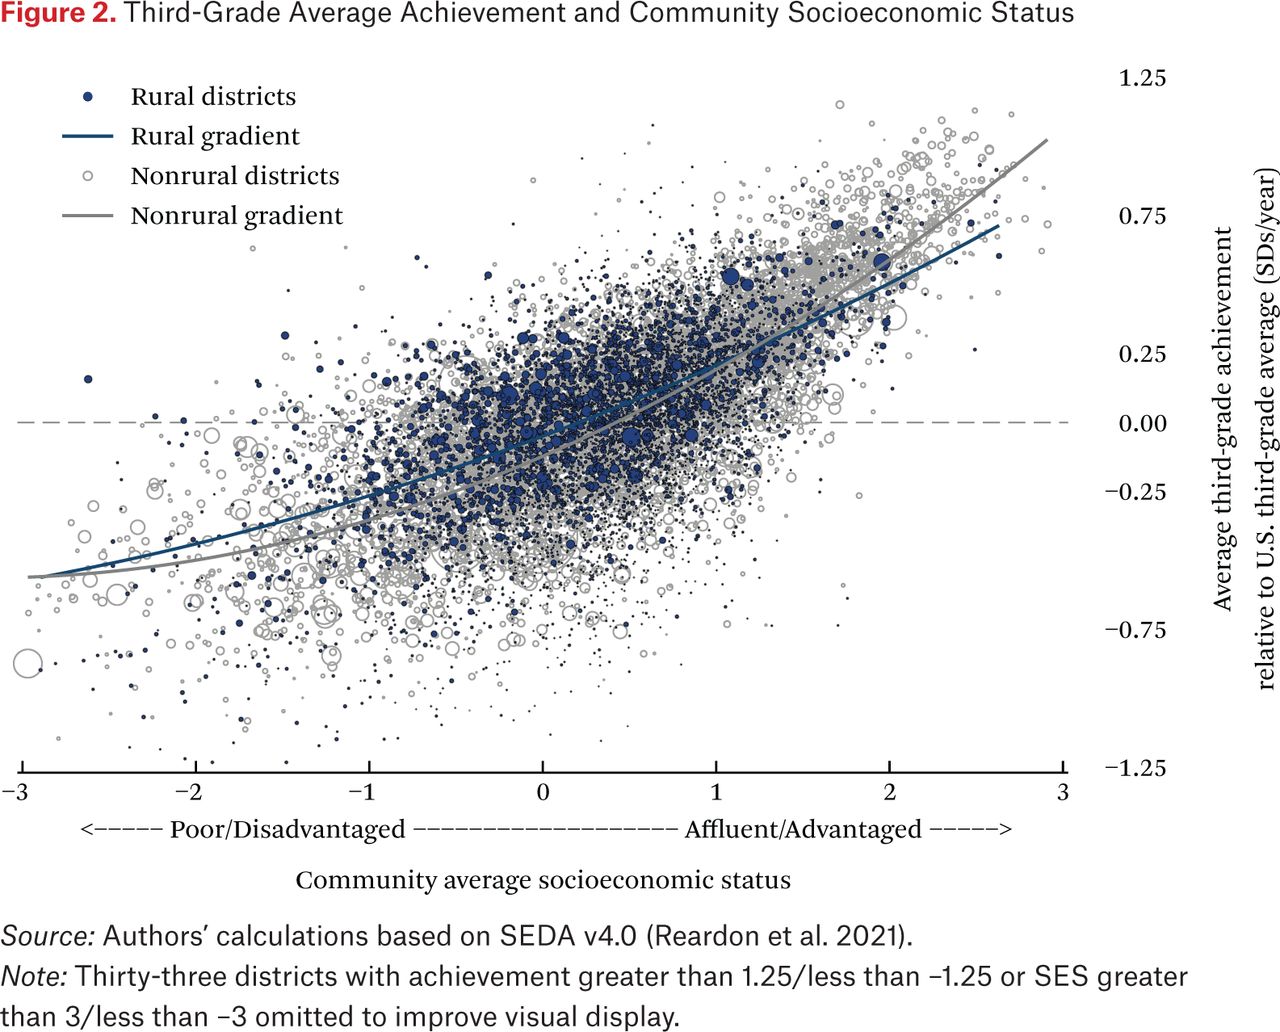
- Figure 2.
Third-Grade Average Achievement and Community Socioeconomic Status
Source: Authors’ calculations based on SEDA v4.0 (Reardon et al. 2021).
Note: Thirty-three districts with achievement greater than 1.25/less than –1.25 or SES greater than 3/less than –3 omitted to improve visual display.
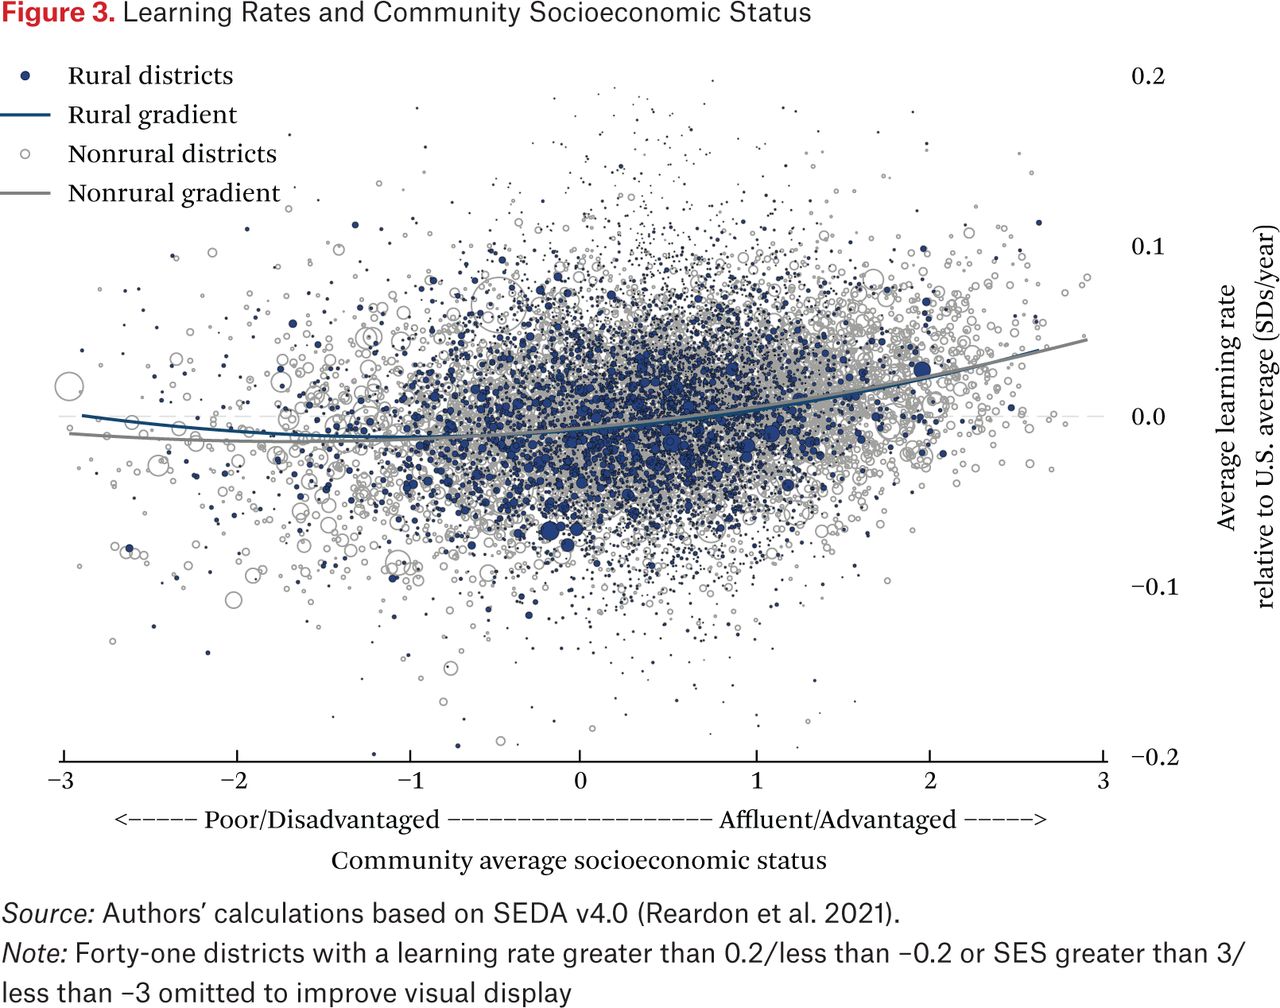
- Figure 3.
Learning Rates and Community Socioeconomic Status
Source: Authors’ calculations based on SEDA v4.0 (Reardon et al. 2021).
Note: Forty-one districts with a learning rate greater than 0.2/less than –0.2 or SES greater than 3/less than –3 omitted to improve visual display
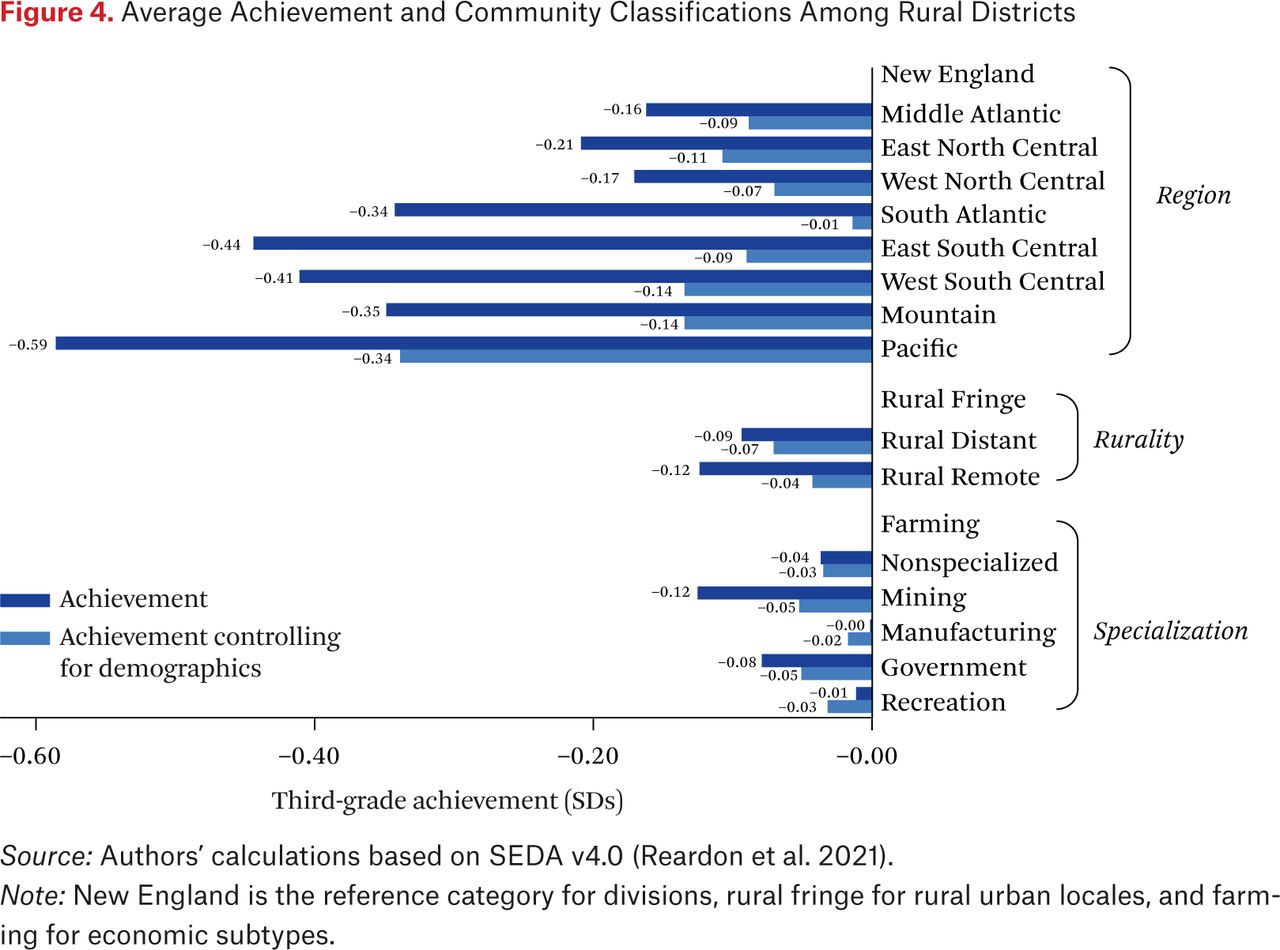
- Figure 4.
Average Achievement and Community Classifications Among Rural Districts
Source: Authors’ calculations based on SEDA v4.0 (Reardon et al. 2021).
Note: New England is the reference category for divisions, rural fringe for rural urban locales, and farming for economic subtypes.
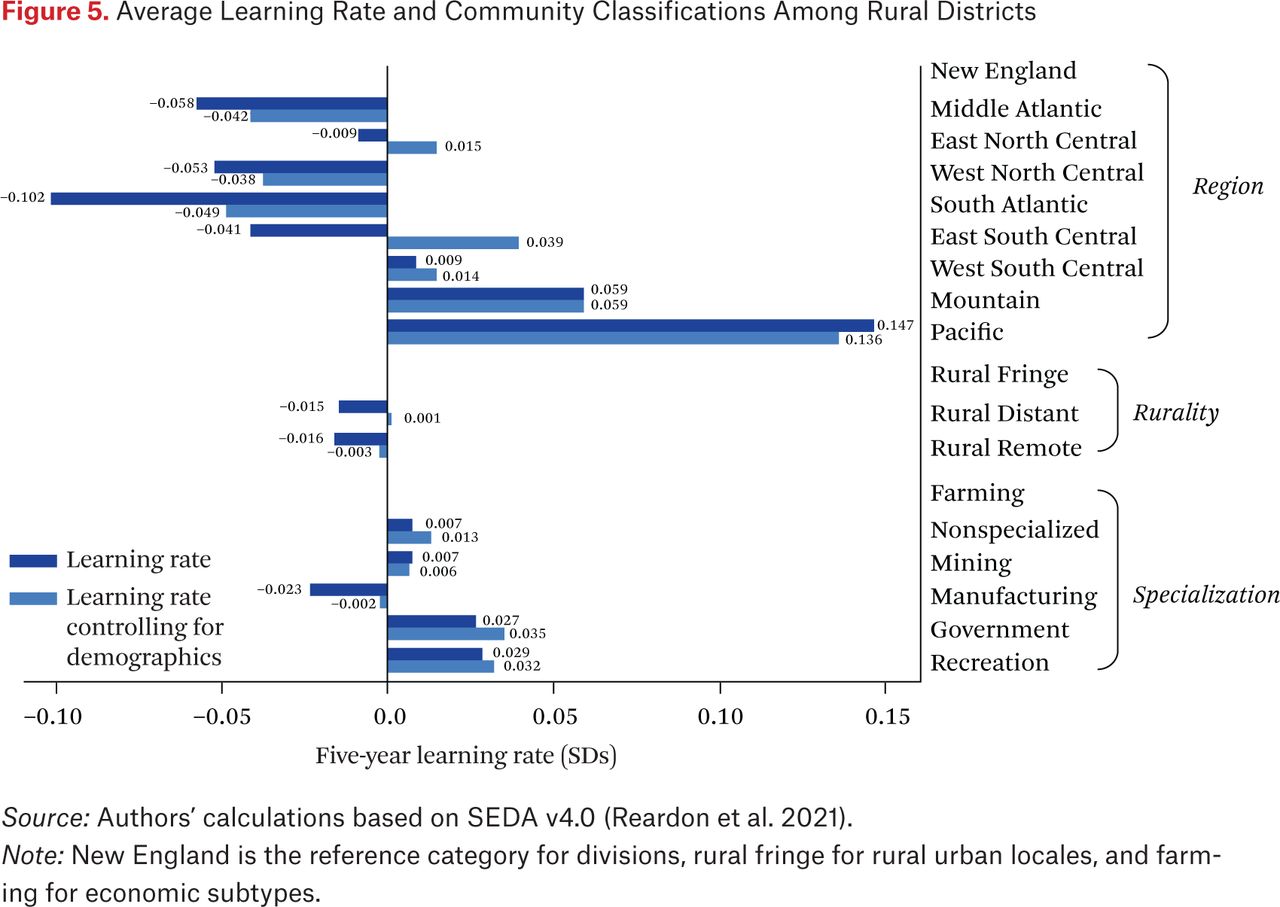
- Figure 5.
Average Learning Rate and Community Classifications Among Rural Districts
Source: Authors’ calculations based on SEDA v4.0 (Reardon et al. 2021).
Note: New England is the reference category for divisions, rural fringe for rural urban locales, and farming for economic subtypes.
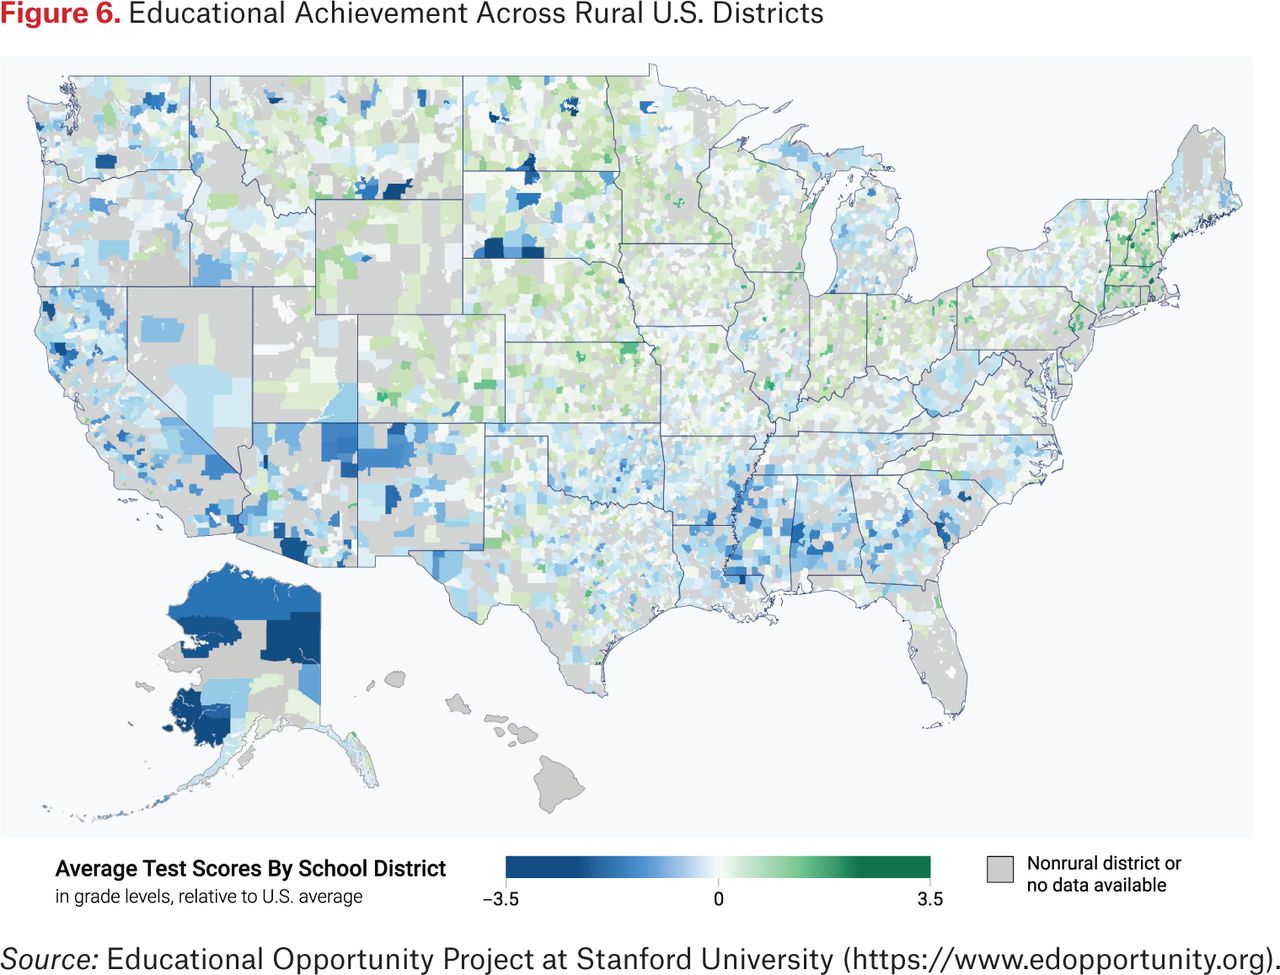
- Figure 6.
Educational Achievement Across Rural U.S. Districts
Source: Educational Opportunity Project at Stanford University (https://www.edopportunity.org).
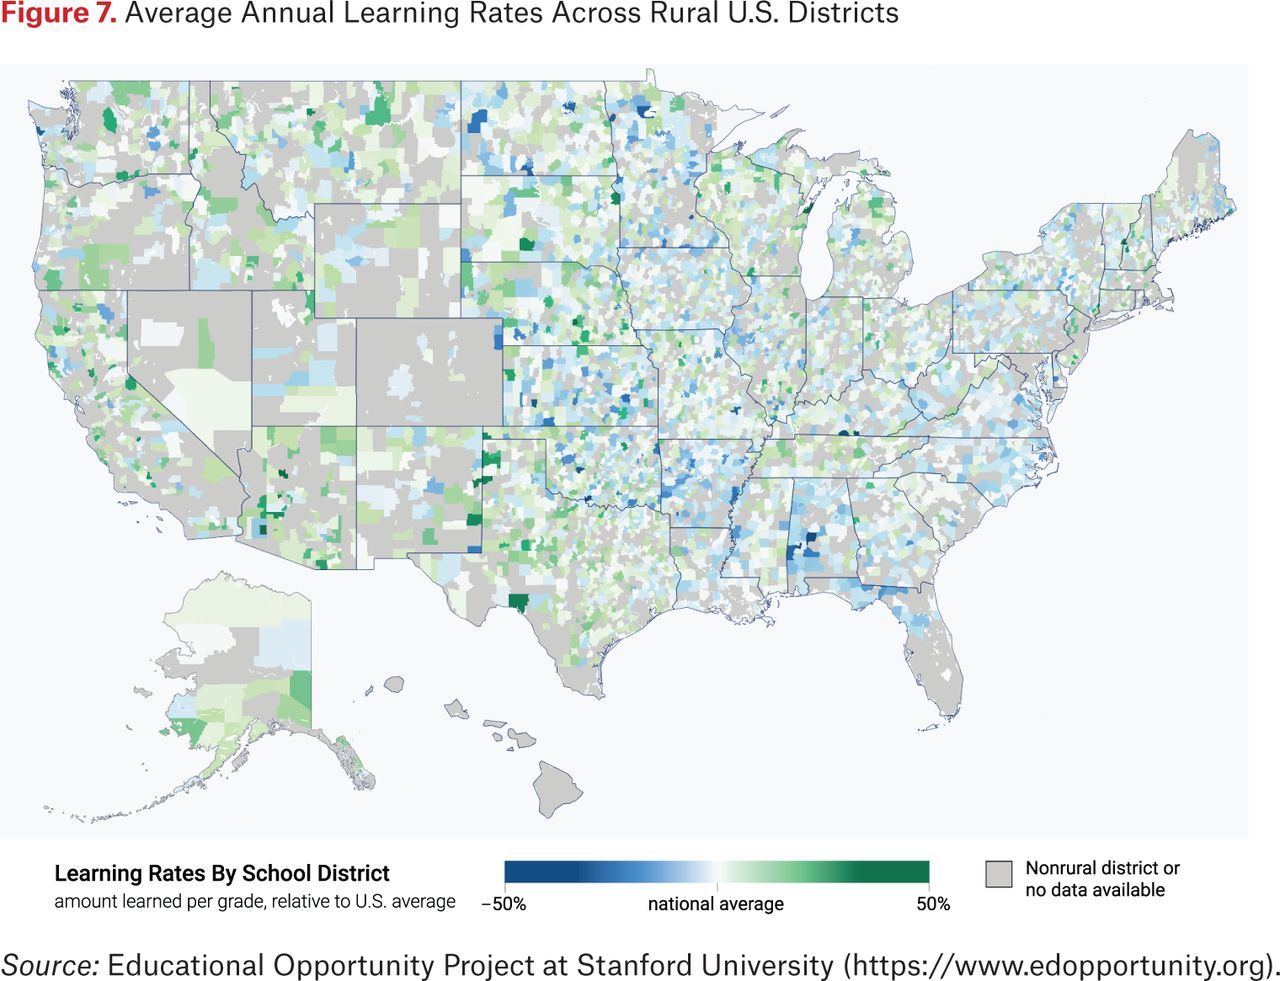
- Figure 7.
Average Annual Learning Rates Across Rural U.S. Districts
Source: Educational Opportunity Project at Stanford University (https://www.edopportunity.org).
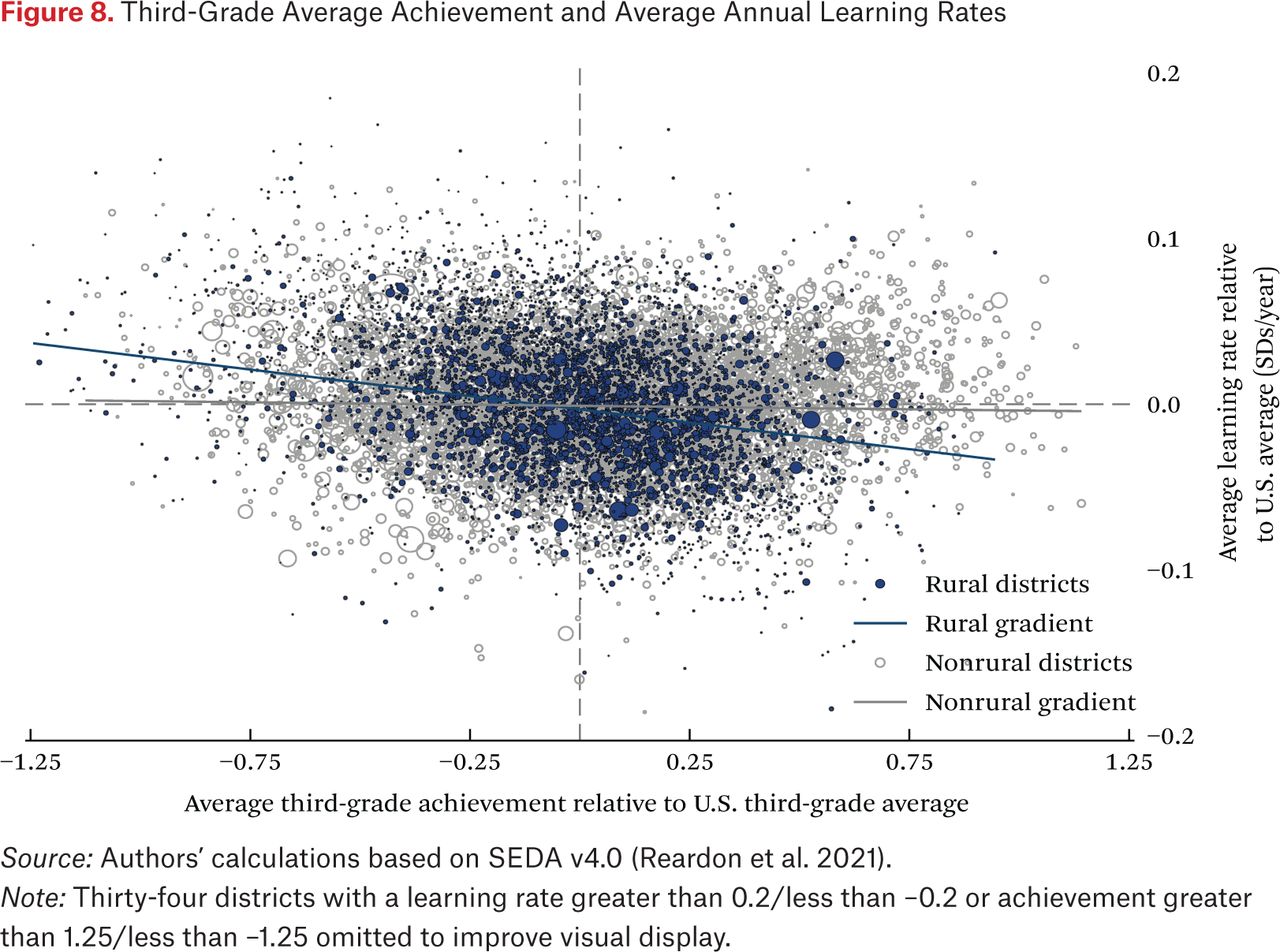
- Figure 8.
Third-Grade Average Achievement and Average Annual Learning Rates
Source: Authors’ calculations based on SEDA v4.0 (Reardon et al. 2021).
Note: Thirty-four districts with a learning rate greater than 0.2/less than –0.2 or achievement greater than 1.25/less than –1.25 omitted to improve visual display.
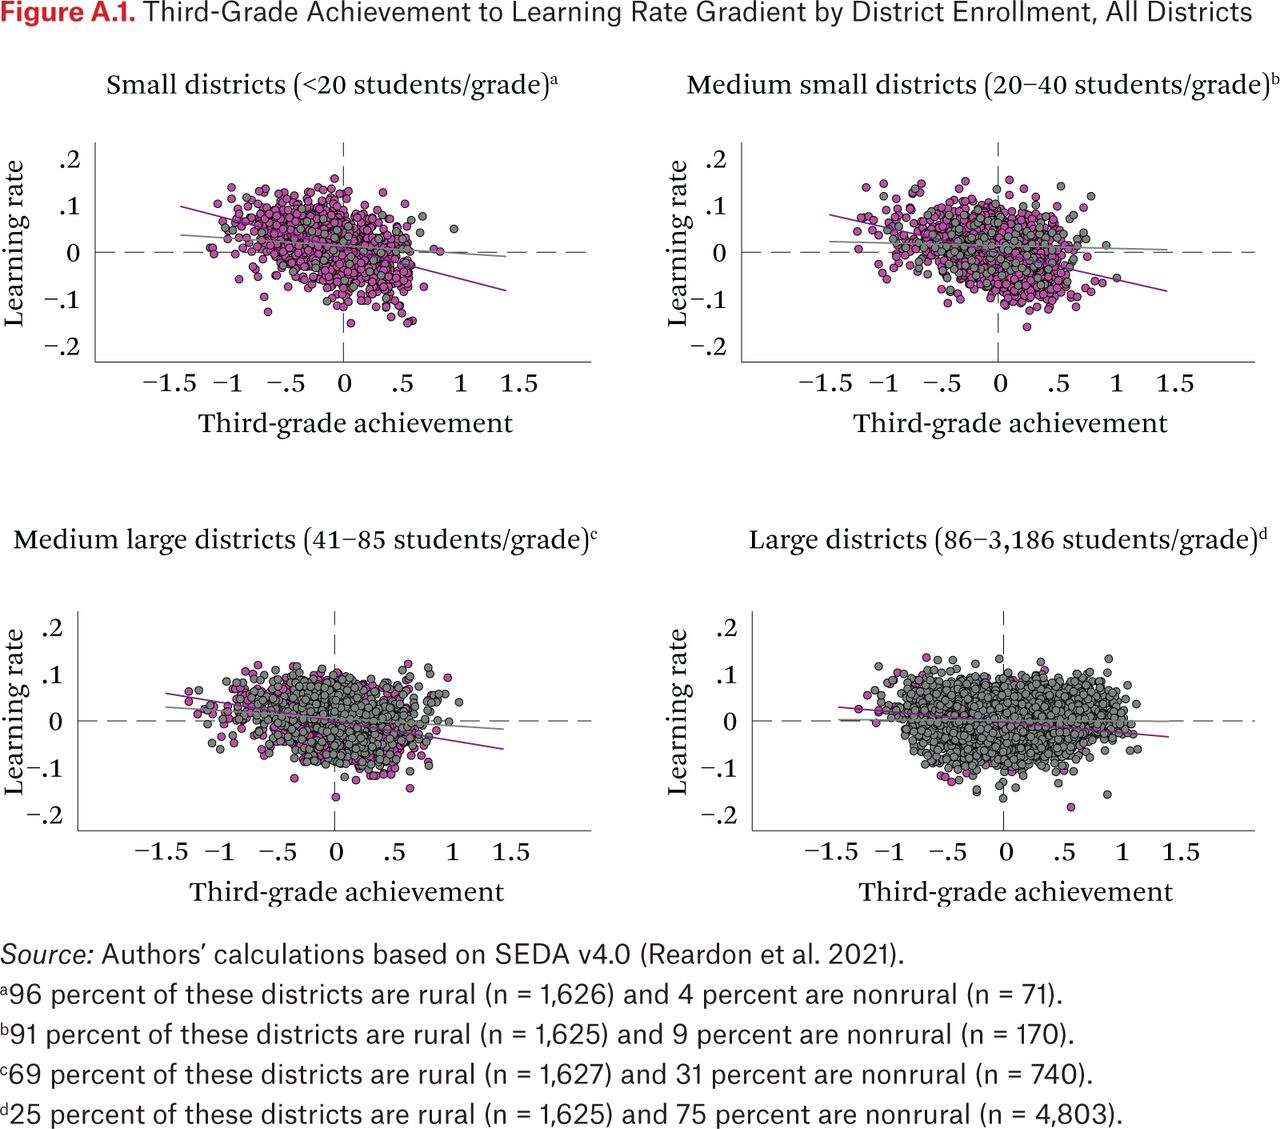
- Figure A.1.
Third-Grade Achievement to Learning Rate Gradient by District Enrollment, All Districts
Source: Authors’ calculations based on SEDA v4.0 (Reardon et al. 2021).
a96 percent of these districts are rural (n = 1,626) and 4 percent are nonrural (n = 71).
b91 percent of these districts are rural (n = 1,625) and 9 percent are nonrural (n = 170).
c69 percent of these districts are rural (n = 1,627) and 31 percent are nonrural (n = 740).
d25 percent of these districts are rural (n = 1,625) and 75 percent are nonrural (n = 4,803).
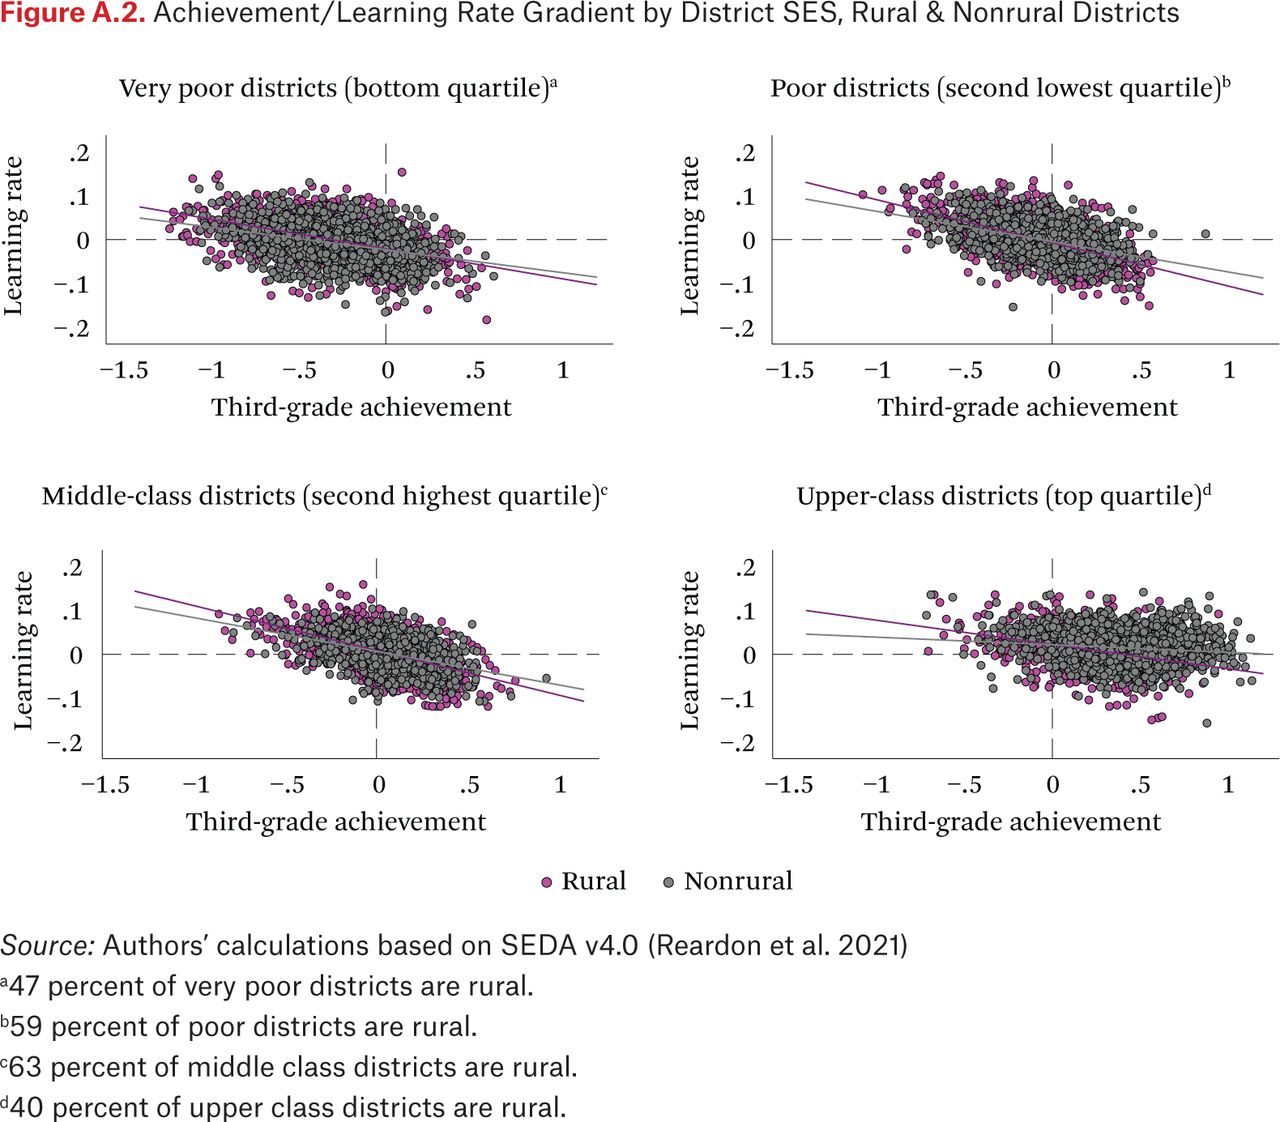
- Figure A.2.
Achievement/Learning Rate Gradient by District SES, Rural & Nonrural Districts
Source: Authors’ calculations based on SEDA v4.0 (Reardon et al. 2021)
a47 percent of very poor districts are rural.
b59 percent of poor districts are rural.
c63 percent of middle class districts are rural.
d40 percent of upper class districts are rural.


Tables

In this issue


Jump to section
Related Articles
Cited By...
- No citing articles found.