
Article Figures & Data
Figures
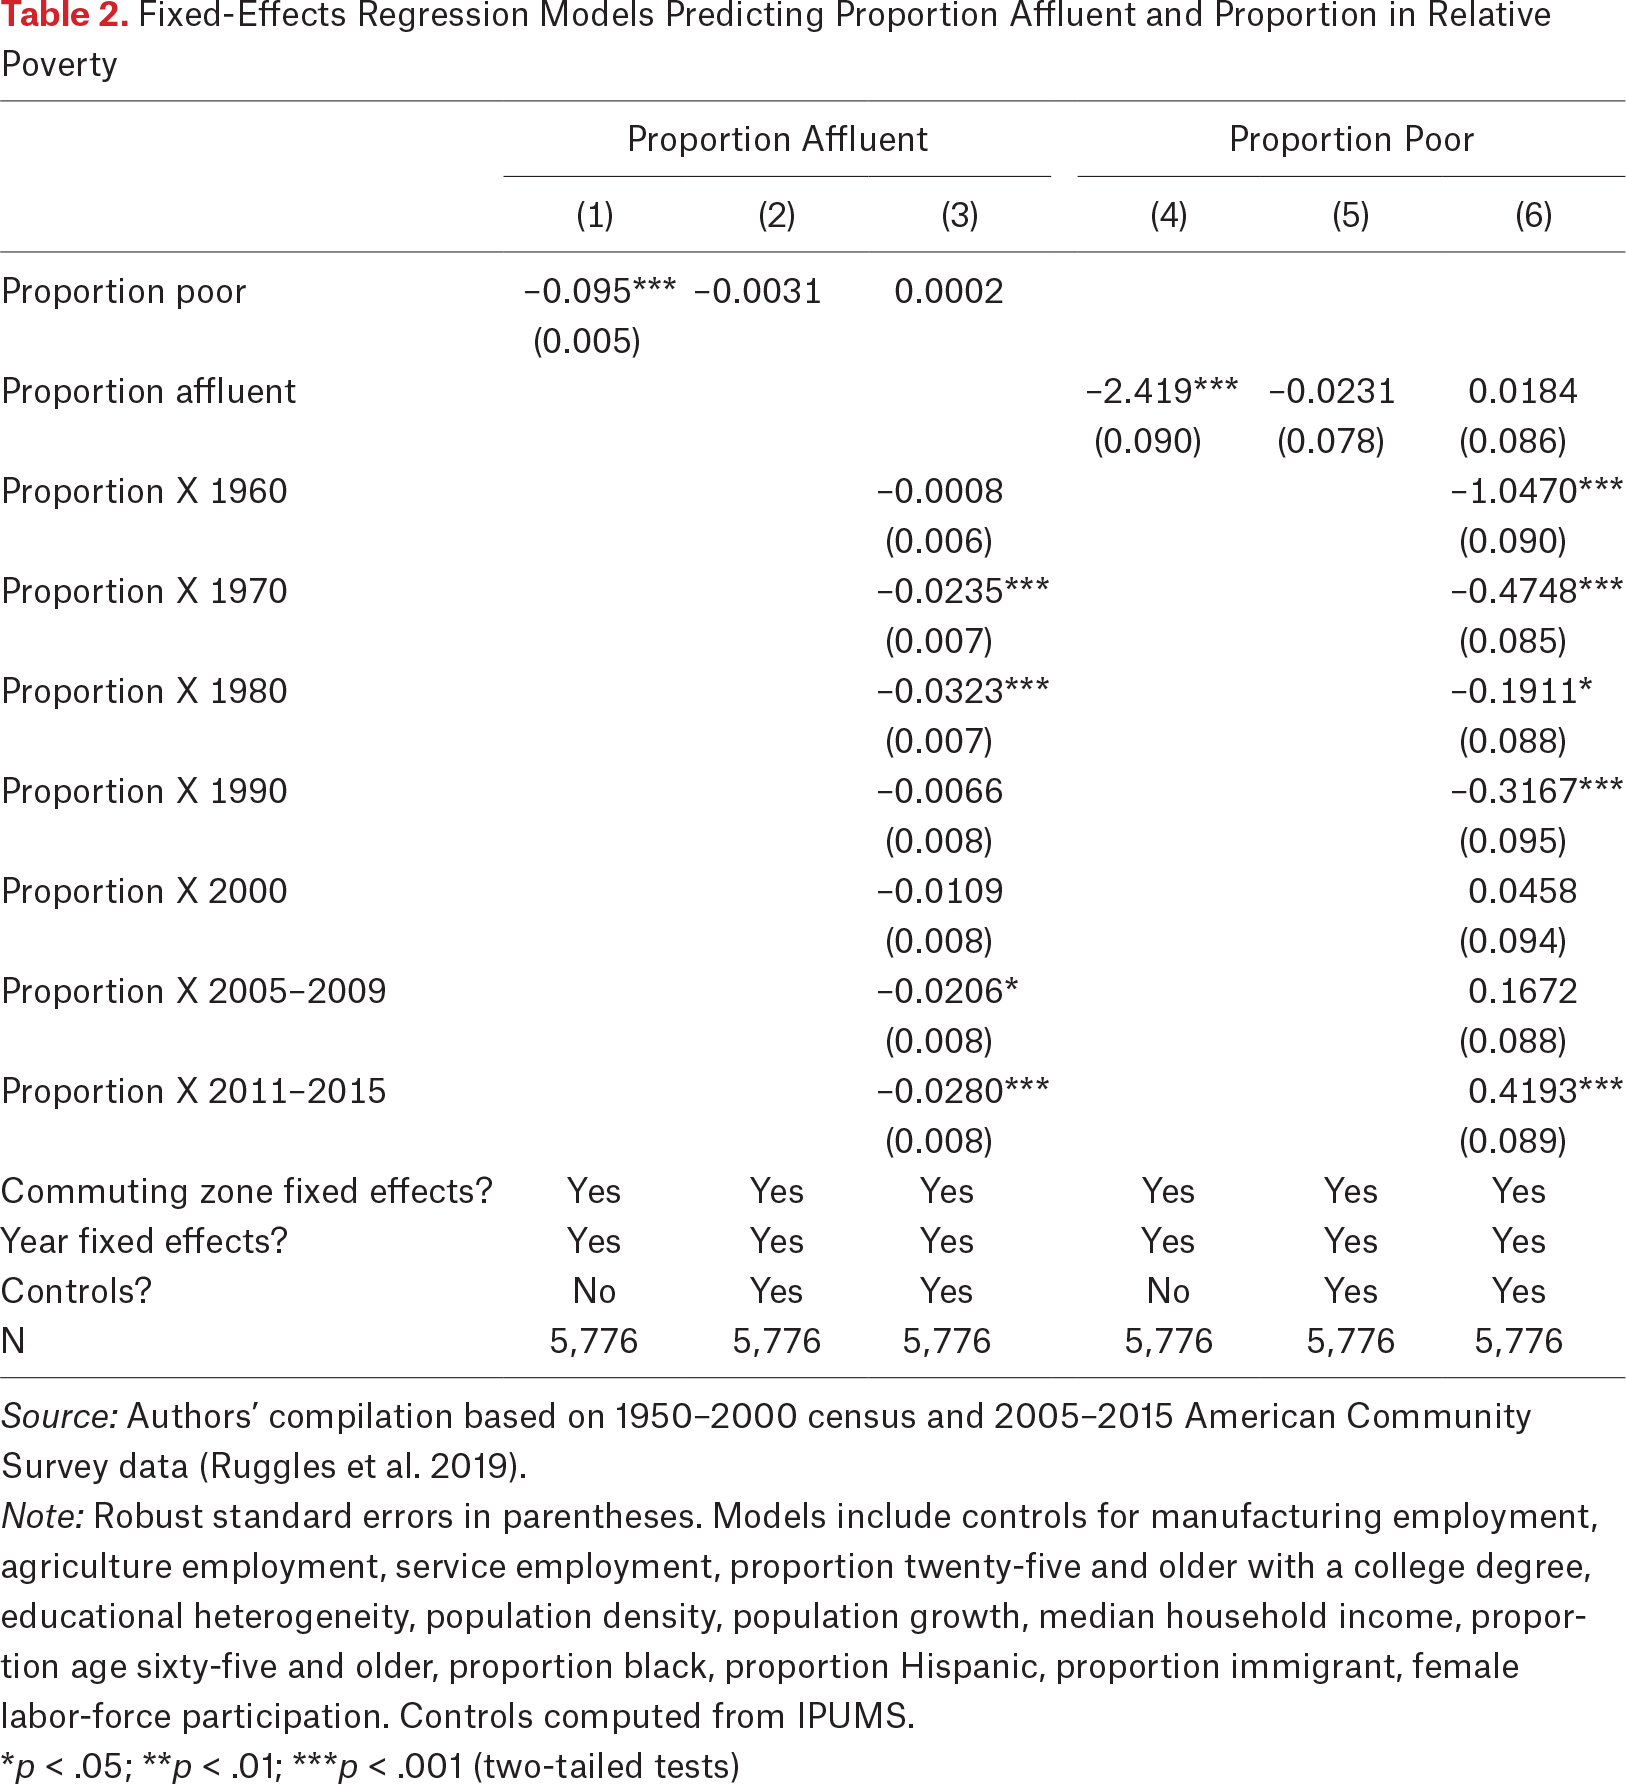
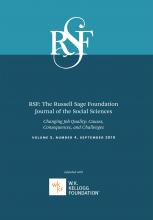
- Figure 1.
Relationship Between Percentage of Affluent and Poor Households
Source: Authors’ compilation based on 1950–2000 census and 2005–2015 American Community Survey data (Ruggles et al. 2019).
Note: A total of 722 commuting zones. Percent affluent computed as the number of households at or above the nation-level 95th household income percentile over the total number of households in a commuting zone. Percent relative poverty is the number of households in a commuting zone at or below half the nation-level median household income. Markers are weighted by the number of households in a commuting zone. For ease of interpretation, in figures we label years 2005–2009 as “2005” and 2011–2015 as “2010.”
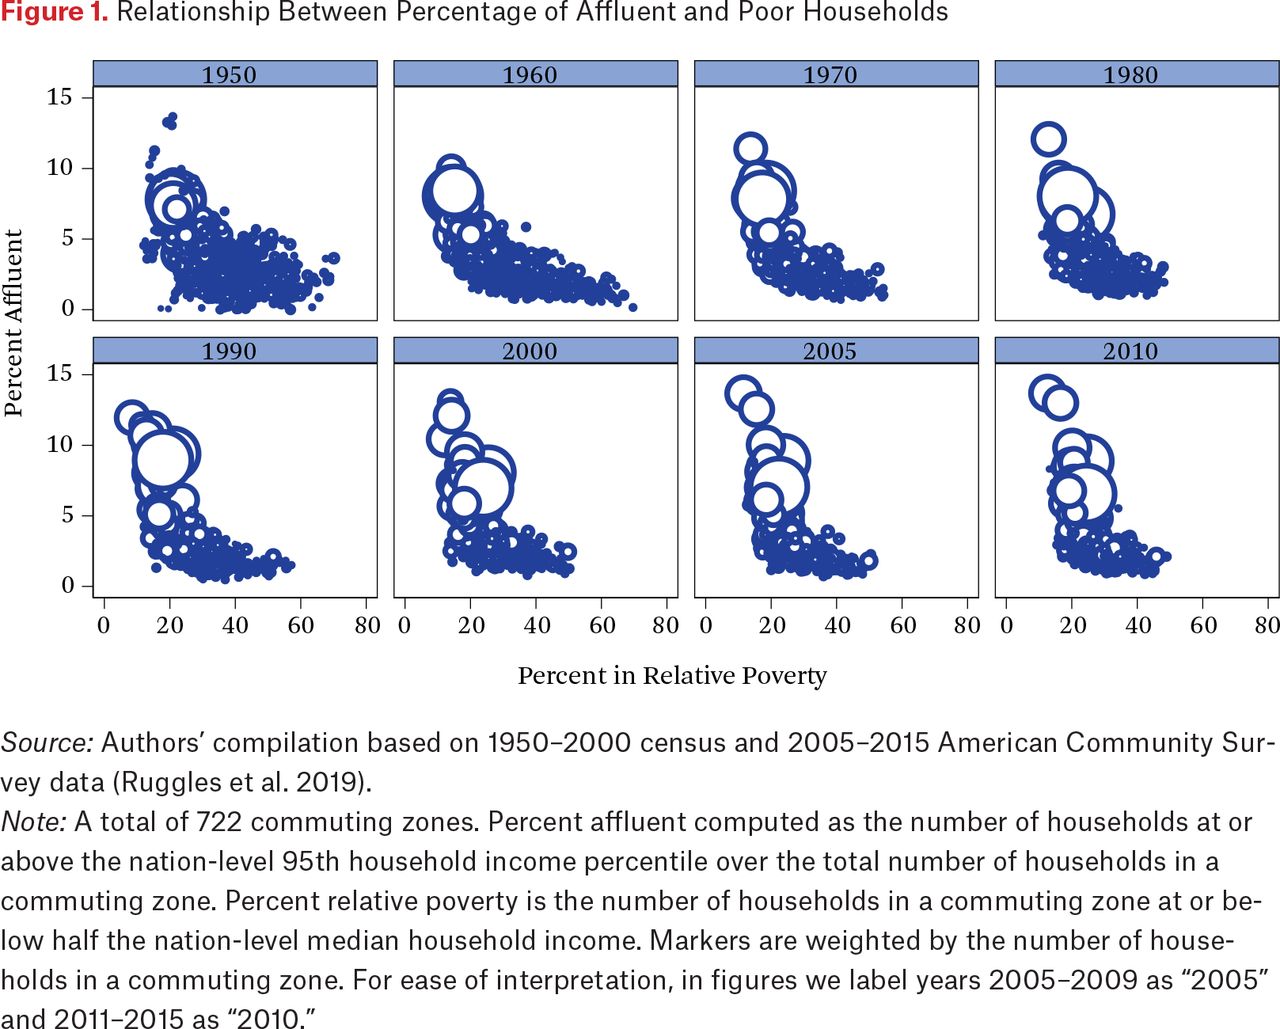
- Figure 2.
Relative Change in Segregation of Affluent, Poor, and In-Between Households
Source: Authors’ compilation based on 1950–2000 census and 2005–2015 American Community Survey data (Ruggles et al. 2019).
Note: A total of 722 commuting zones. Segregation measures computed from household counts at the commuting zone level and estimated separately by year. All segregation measures normalized to equal 1 in 1950 to ease interpretation. Affluent refers to households at or above the nation-level 95th household income percentile. Poor refers to households at or below half the nation-level household median income. Middle refers to all other households. Substantively similar results used when comparing income deciles and ventiles.
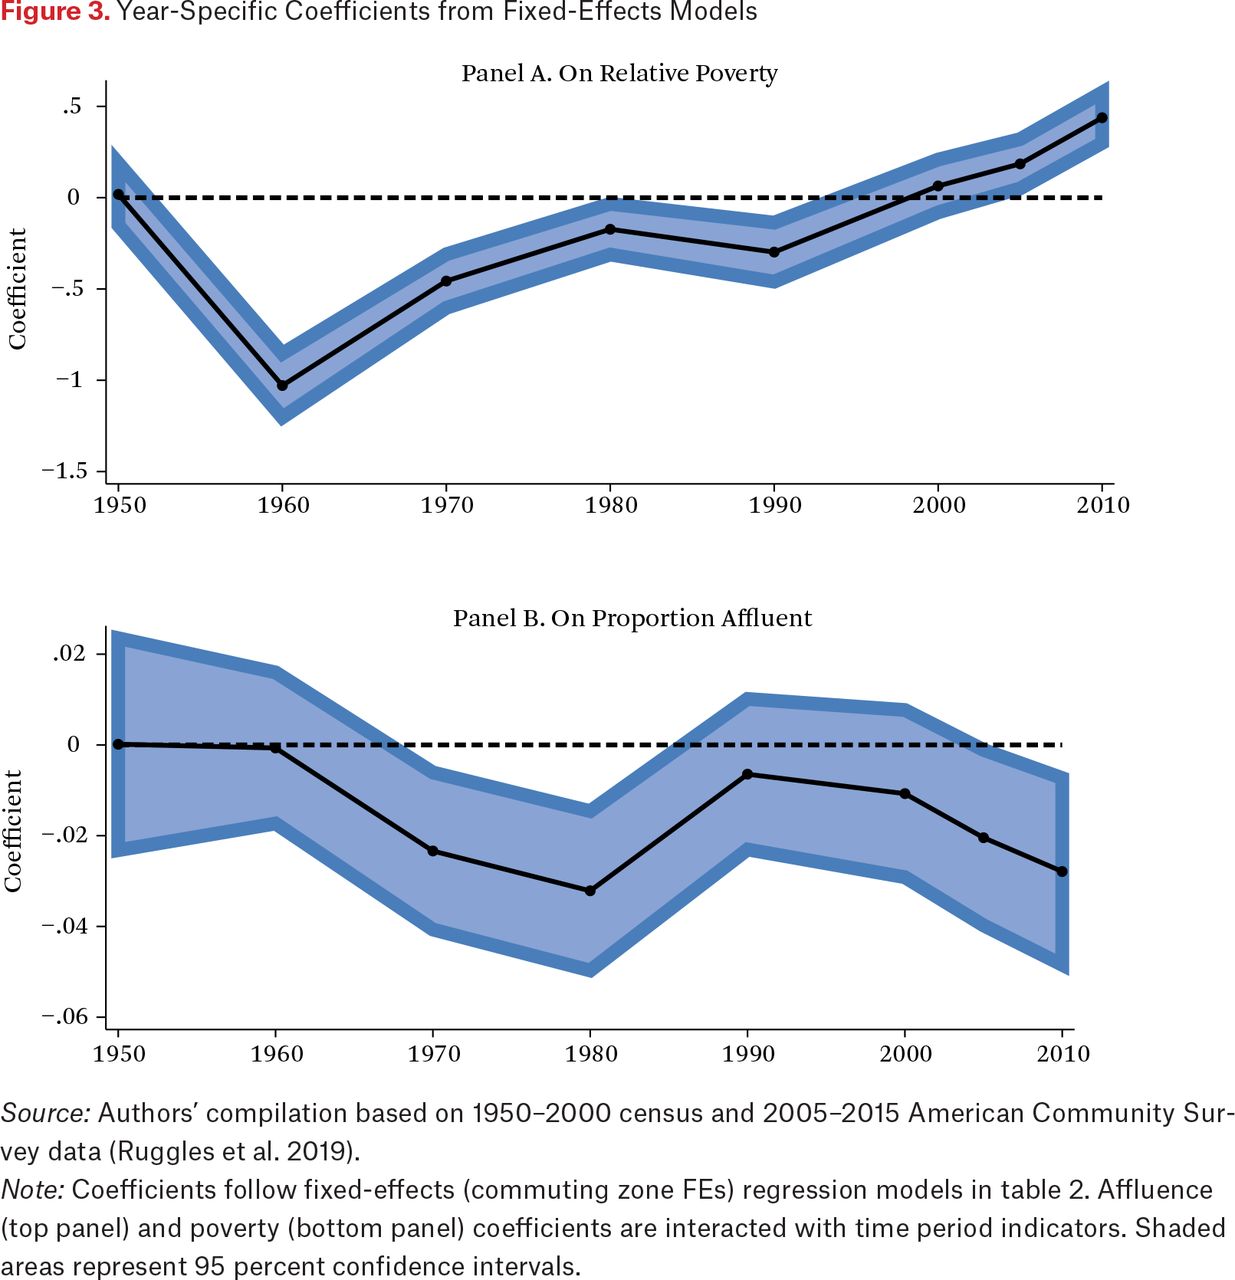
- Figure 3.
Year-Specific Coefficients from Fixed-Effects Models
Source: Authors’ compilation based on 1950–2000 census and 2005–2015 American Community Survey data (Ruggles et al. 2019).
Note: Coefficients follow fixed-effects (commuting zone FEs) regression models in table 2. Affluence (top panel) and poverty (bottom panel) coefficients are interacted with time period indicators. Shaded areas represent 95 percent confidence intervals.
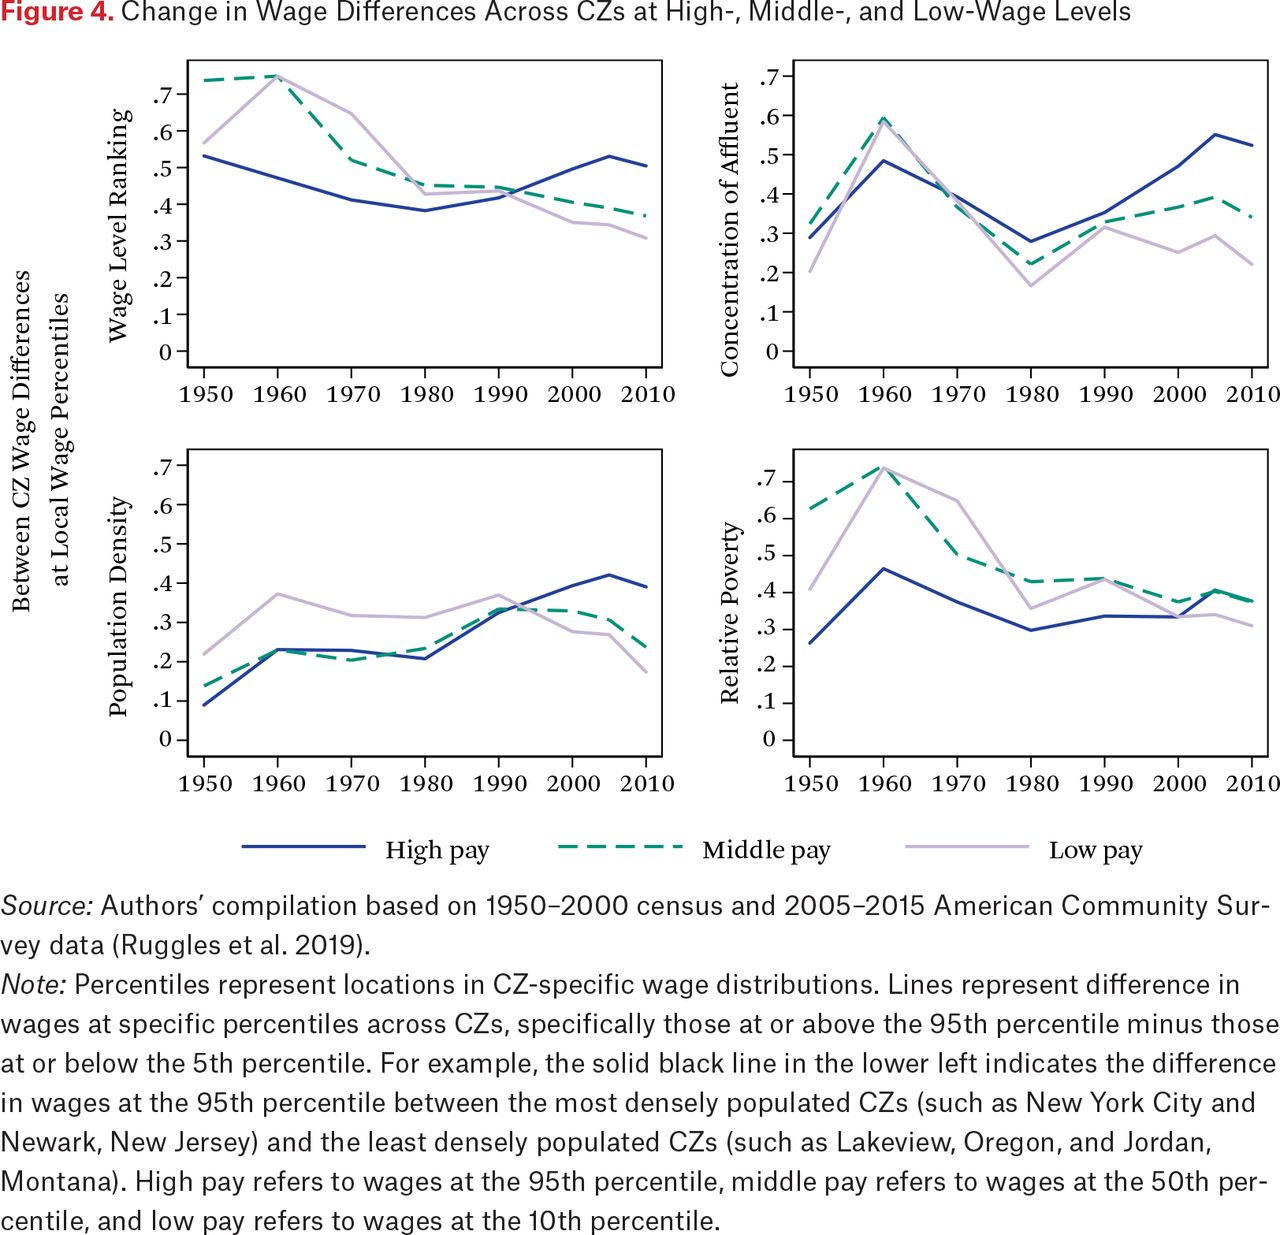
- Figure 4.
Change in Wage Differences Across CZs at High-, Middle-, and Low-Wage Levels
Source: Authors’ compilation based on 1950–2000 census and 2005–2015 American Community Survey data (Ruggles et al. 2019).
Note: Percentiles represent locations in CZ-specific wage distributions. Lines represent difference in wages at specific percentiles across CZs, specifically those at or above the 95th percentile minus those at or below the 5th percentile. For example, the solid black line in the lower left indicates the difference in wages at the 95th percentile between the most densely populated CZs (such as New York City and Newark, New Jersey) and the least densely populated CZs (such as Lakeview, Oregon, and Jordan, Montana). High pay refers to wages at the 95th percentile, middle pay refers to wages at the 50th percentile, and low pay refers to wages at the 10th percentile.
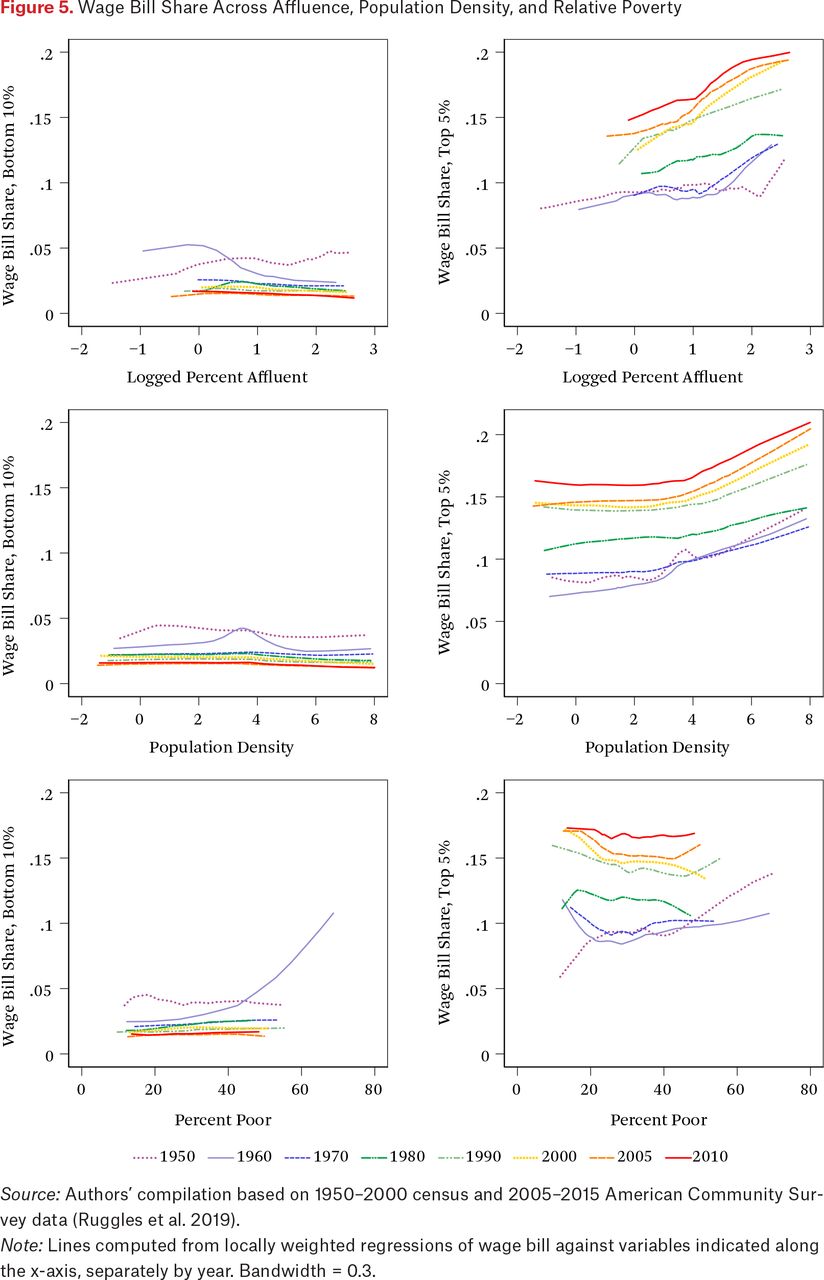
- Figure 5.
Wage Bill Share Across Affluence, Population Density, and Relative Poverty
Source: Authors’ compilation based on 1950–2000 census and 2005–2015 American Community Survey data (Ruggles et al. 2019).
Note: Lines computed from locally weighted regressions of wage bill against variables indicated along the x-axis, separately by year. Bandwidth = 0.3.
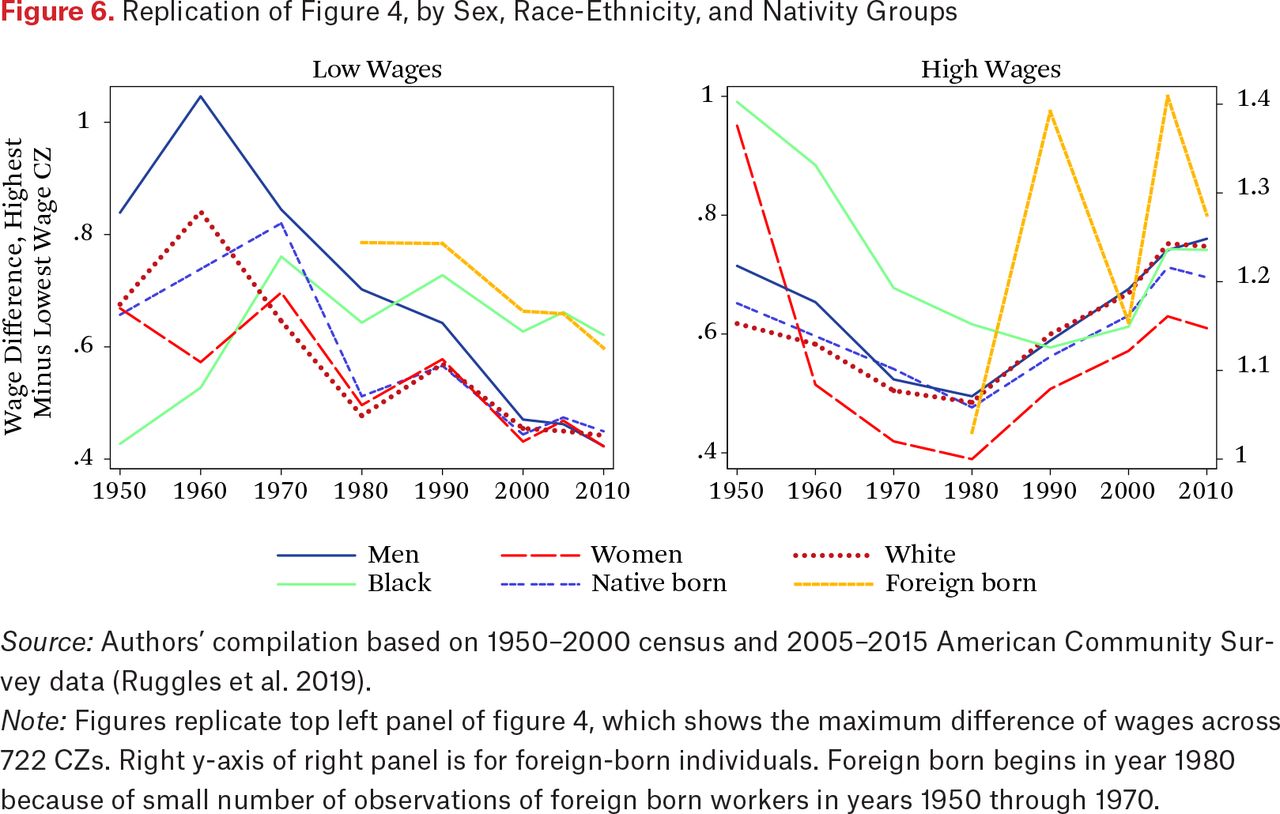
- Figure 6.
Replication of Figure 4, by Sex, Race-Ethnicity, and Nativity Groups
Source: Authors’ compilation based on 1950–2000 census and 2005–2015 American Community Survey data (Ruggles et al. 2019).
Note: Figures replicate top left panel of figure 4, which shows the maximum difference of wages across 722 CZs. Right y-axis of right panel is for foreign-born individuals. Foreign born begins in year 1980 because of small number of observations of foreign born workers in years 1950 through 1970.
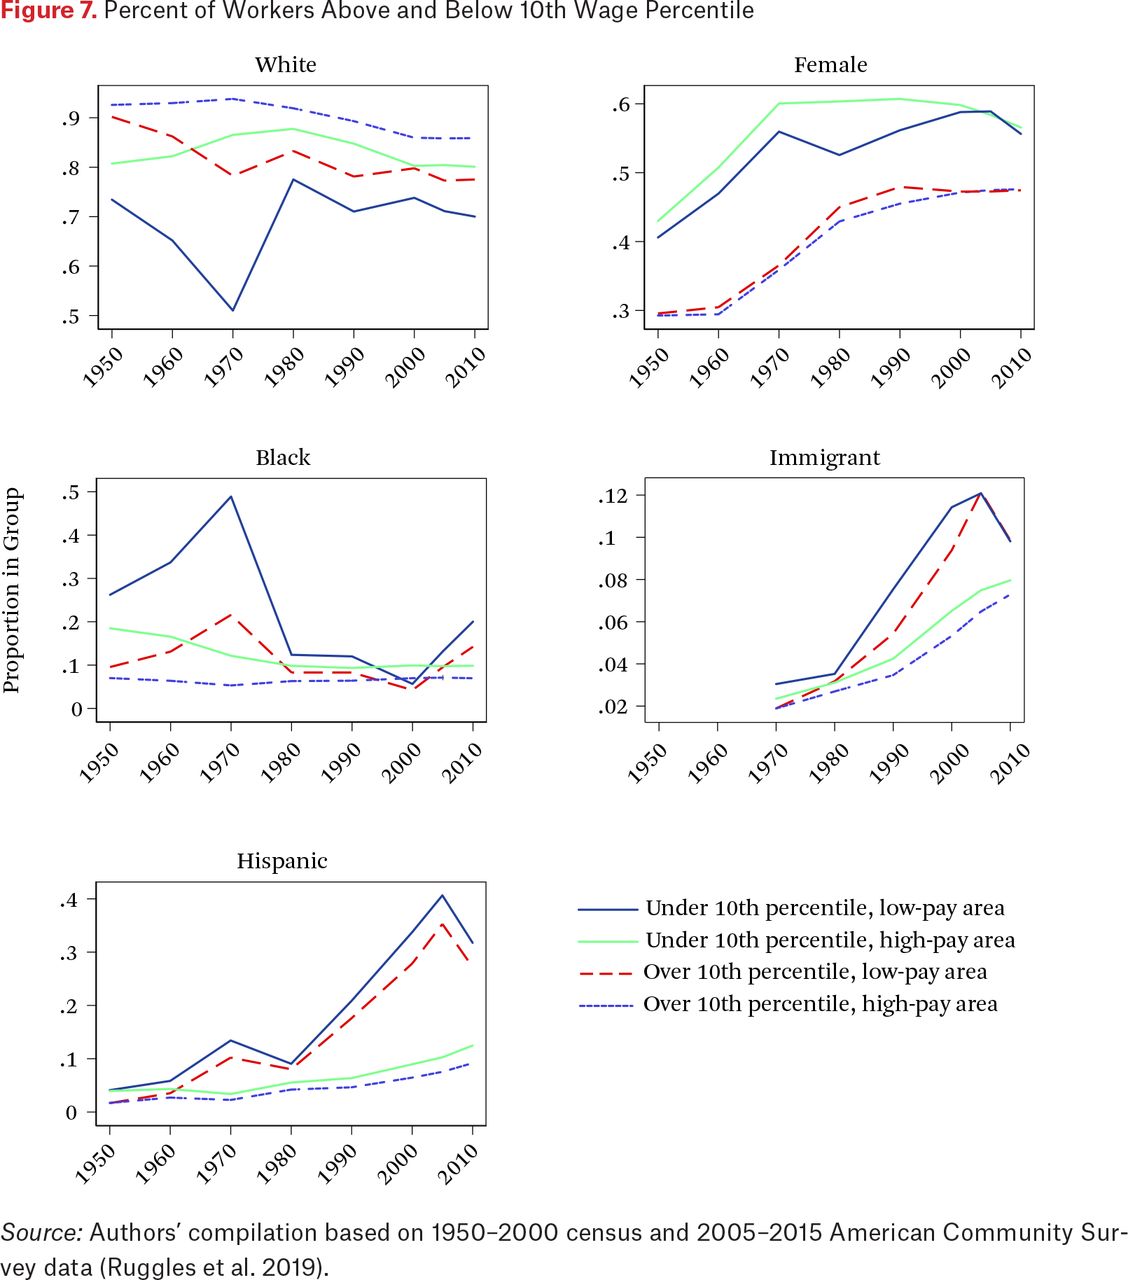
- Figure 7.
Percent of Workers Above and Below 10th Wage Percentile
Source: Authors’ compilation based on 1950–2000 census and 2005–2015 American Community Survey data (Ruggles et al. 2019).
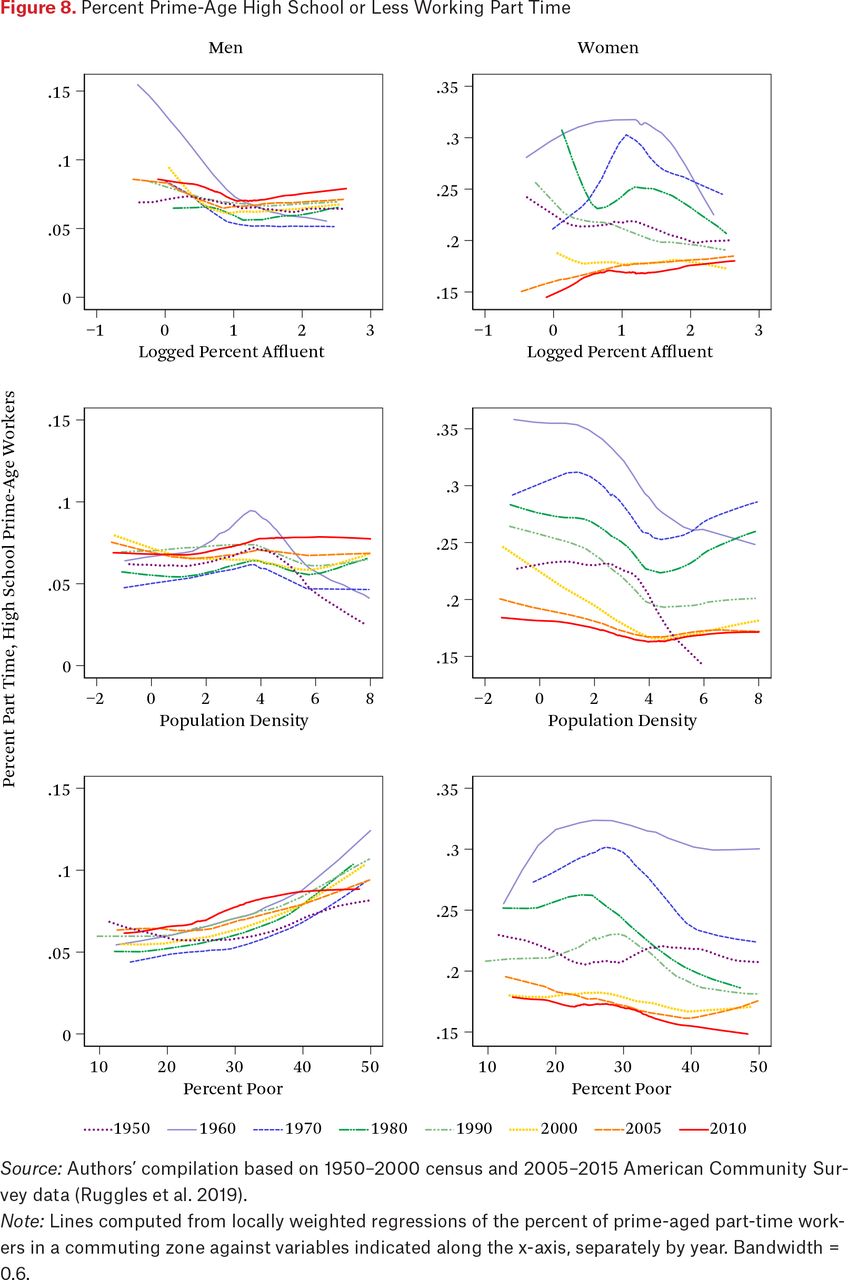
- Figure 8.
Percent Prime-Age High School or Less Working Part Time
Source: Authors’ compilation based on 1950–2000 census and 2005–2015 American Community Survey data (Ruggles et al. 2019).
Note: Lines computed from locally weighted regressions of the percent of prime-aged part-time workers in a commuting zone against variables indicated along the x-axis, separately by year. Bandwidth = 0.6.


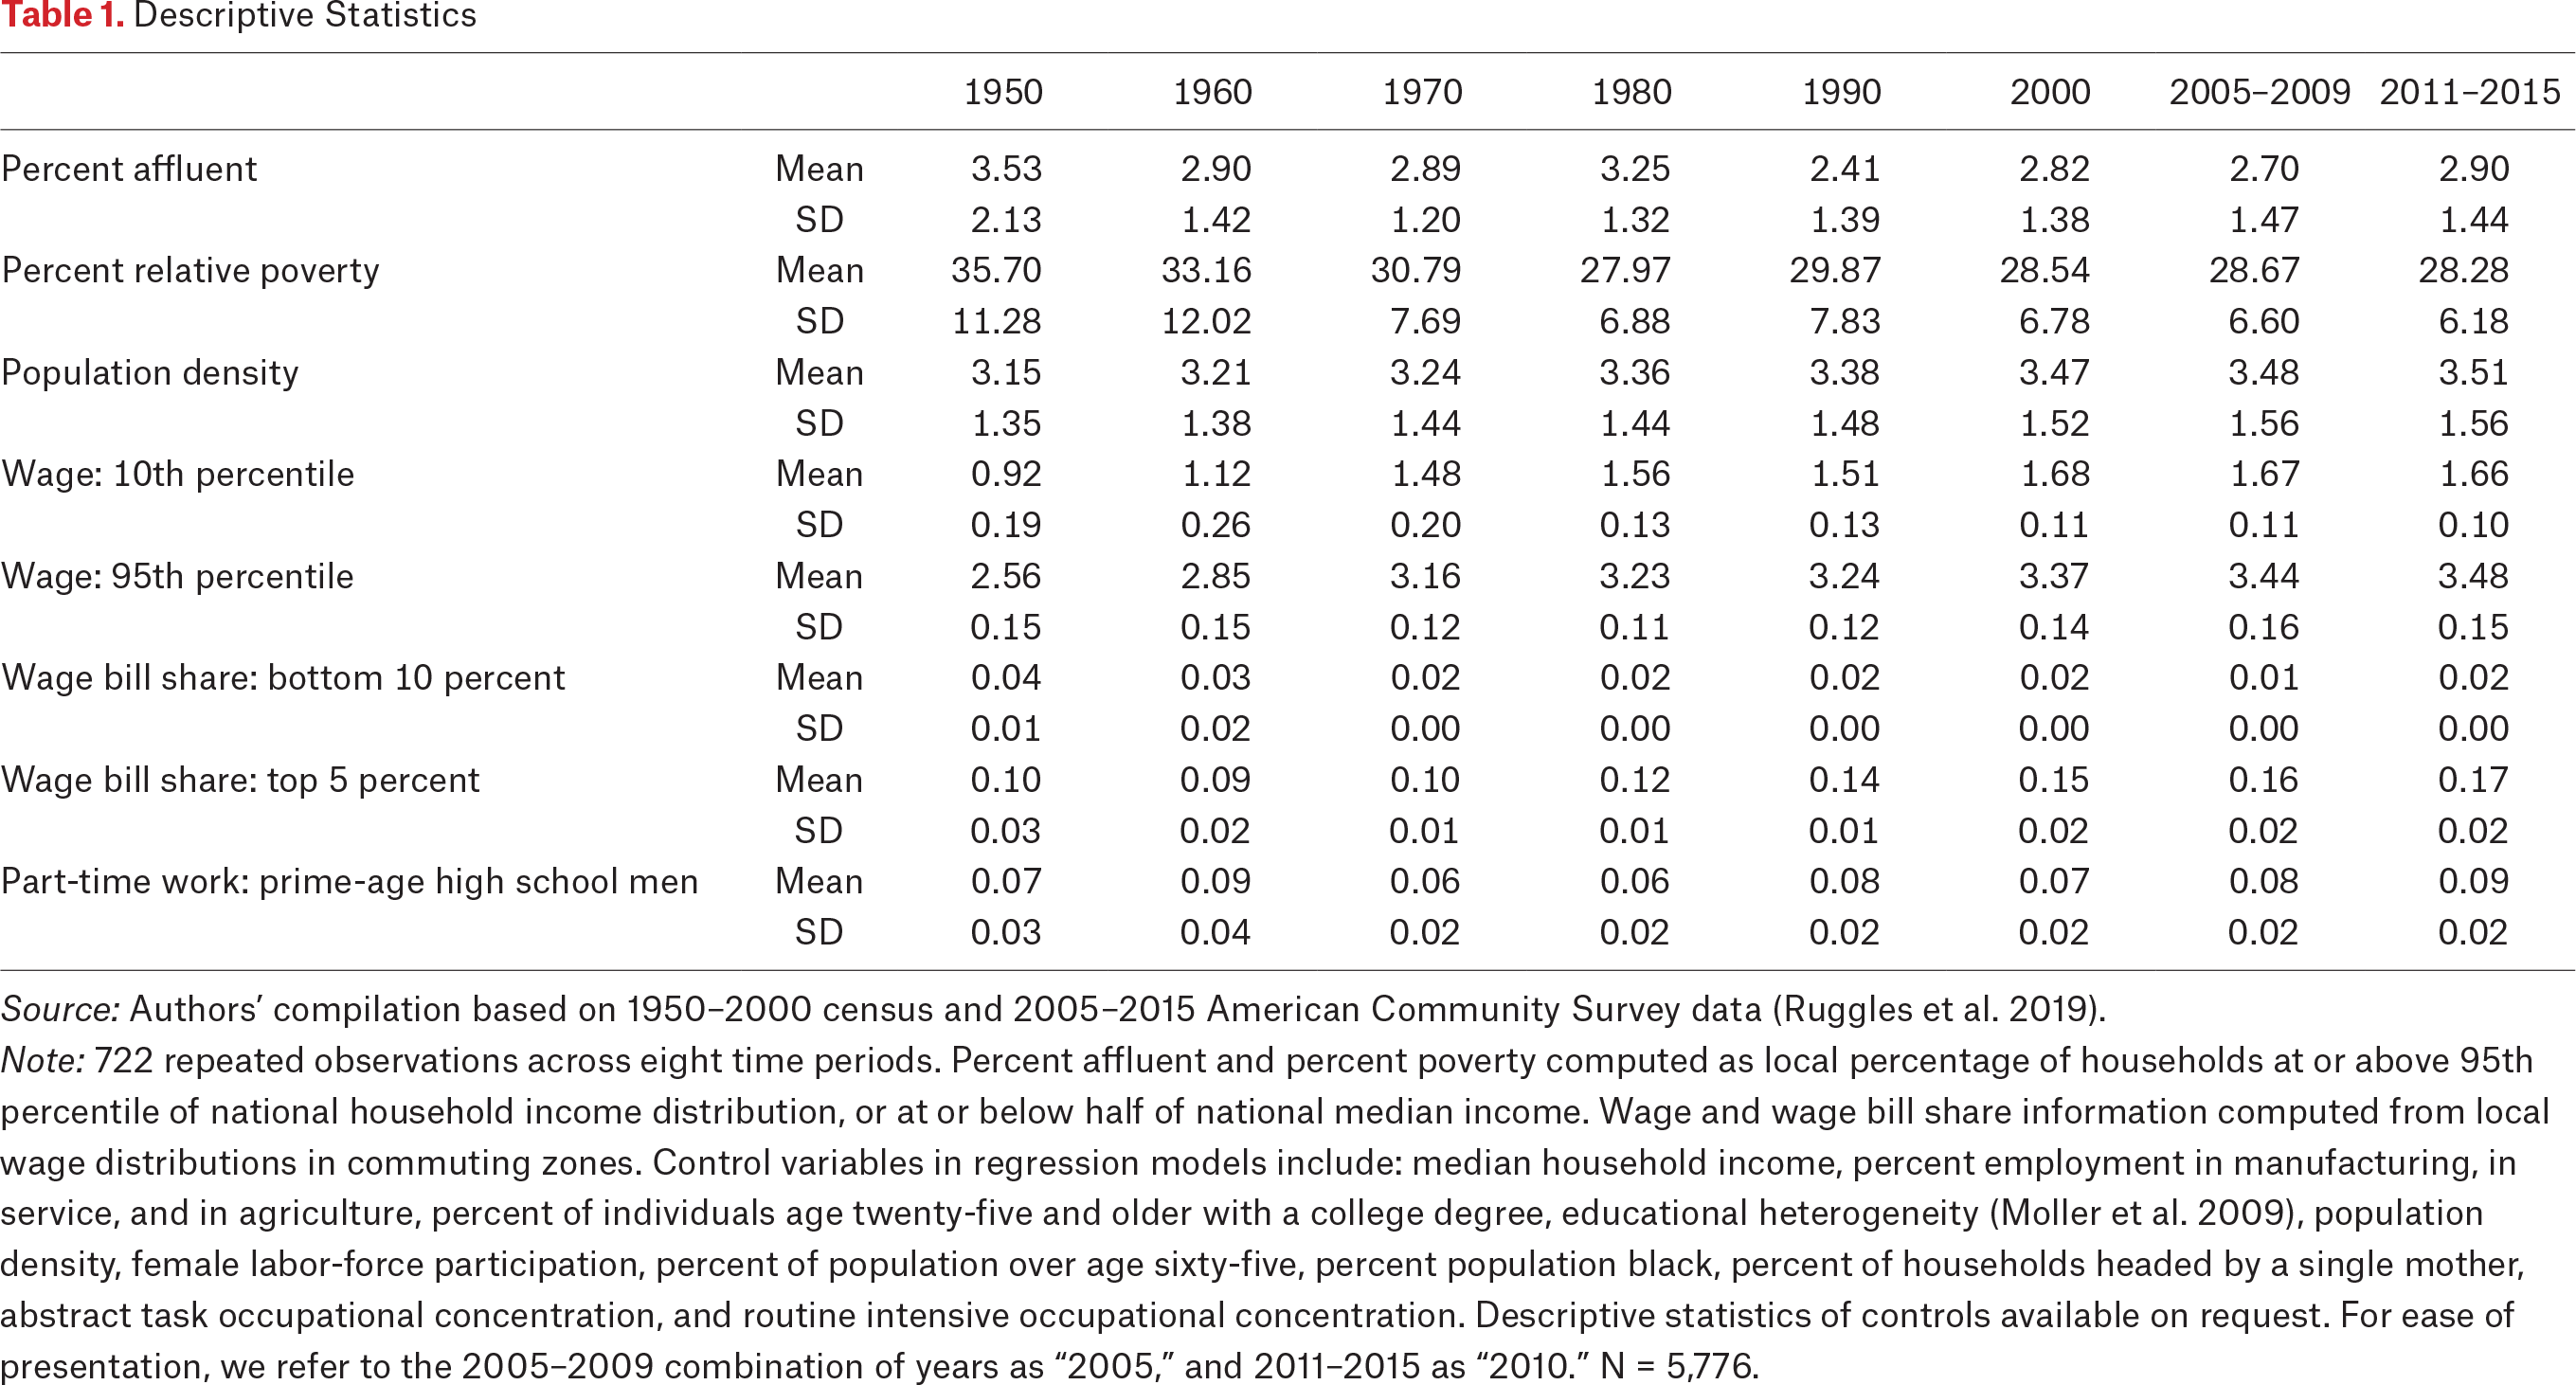
Tables
In this issue


Jump to section
Related Articles
Cited By...
- No citing articles found.