
Article Figures & Data
Figures
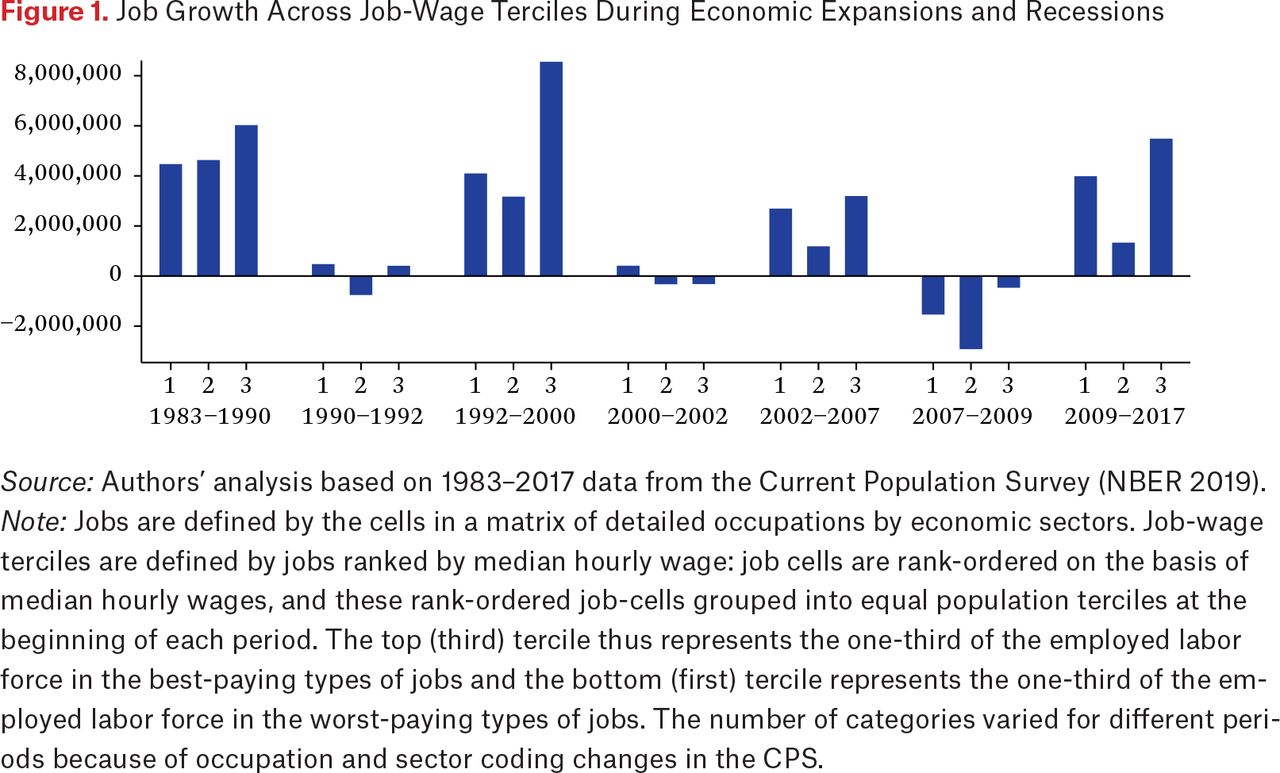
- Figure 1.
Job Growth Across Job-Wage Terciles During Economic Expansions and Recessions
Source: Authors’ analysis based on 1983–2017 data from the Current Population Survey (NBER 2019).
Note: Jobs are defined by the cells in a matrix of detailed occupations by economic sectors. Job-wage terciles are defined by jobs ranked by median hourly wage: job cells are rank-ordered on the basis of median hourly wages, and these rank-ordered job-cells grouped into equal population terciles at the beginning of each period. The top (third) tercile thus represents the one-third of the employed labor force in the best-paying types of jobs and the bottom (first) tercile represents the one-third of the employed labor force in the worst-paying types of jobs. The number of categories varied for different periods because of occupation and sector coding changes in the CPS.
- Figure 2.
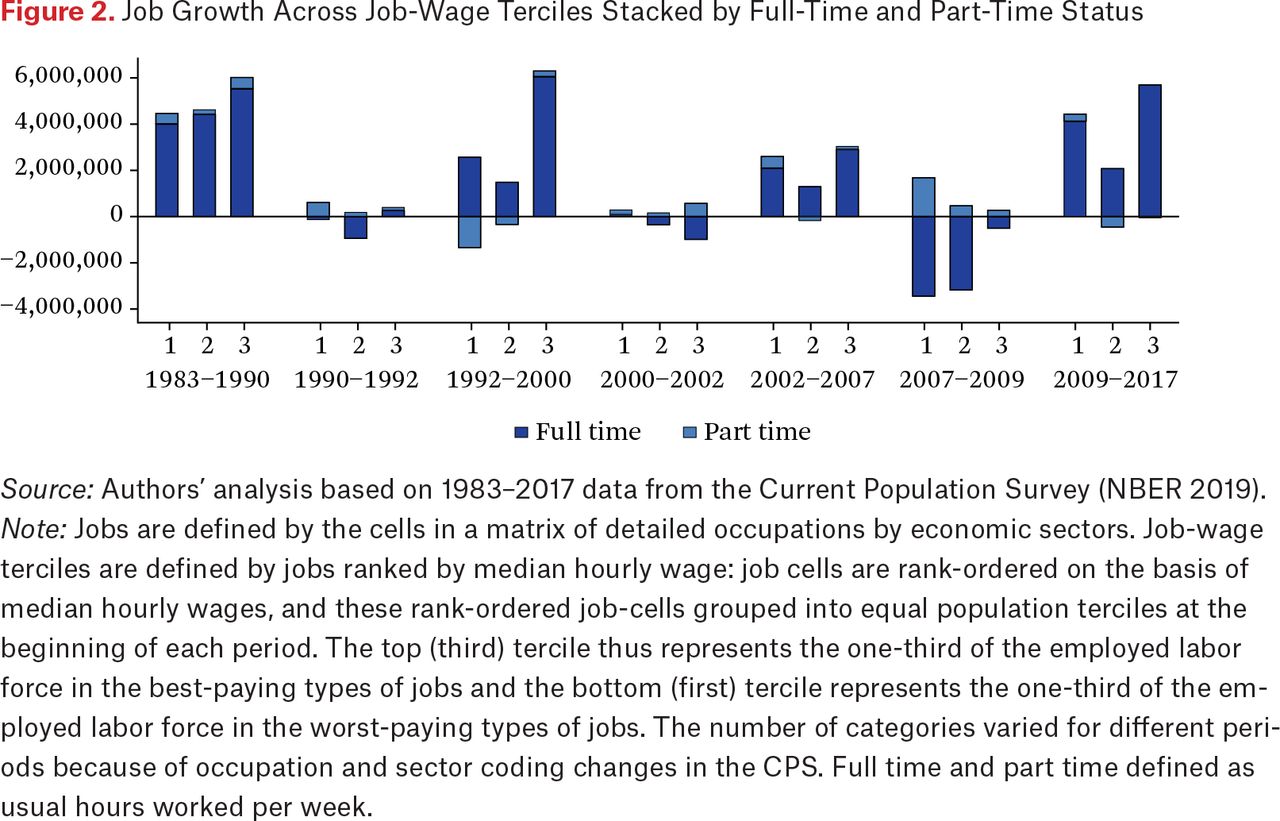
Job Growth Across Job-Wage Terciles Stacked by Full-Time and Part-Time Status
Source: Authors’ analysis based on 1983–2017 data from the Current Population Survey (NBER 2019).
Note: Jobs are defined by the cells in a matrix of detailed occupations by economic sectors. Job-wage terciles are defined by jobs ranked by median hourly wage: job cells are rank-ordered on the basis of median hourly wages, and these rank-ordered job-cells grouped into equal population terciles at the beginning of each period. The top (third) tercile thus represents the one-third of the employed labor force in the best-paying types of jobs and the bottom (first) tercile represents the one-third of the employed labor force in the worst-paying types of jobs. The number of categories varied for different periods because of occupation and sector coding changes in the CPS. Full time and part time defined as usual hours worked per week.
- Figure 3.
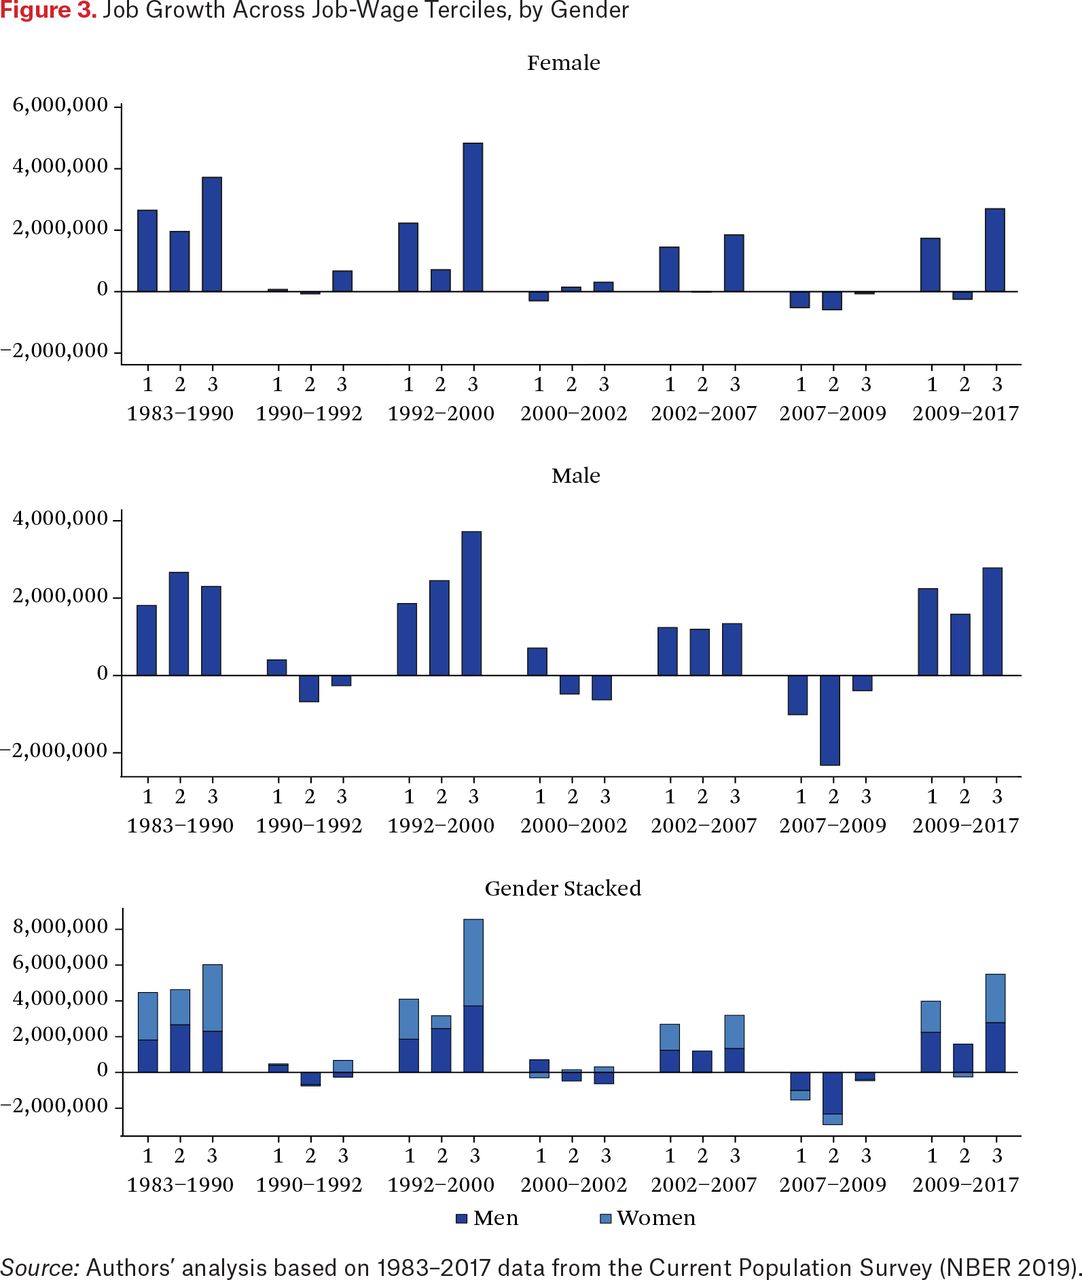
Job Growth Across Job-Wage Terciles, by Gender
Source: Authors’ analysis based on 1983–2017 data from the Current Population Survey (NBER 2019).
- Figure 4.
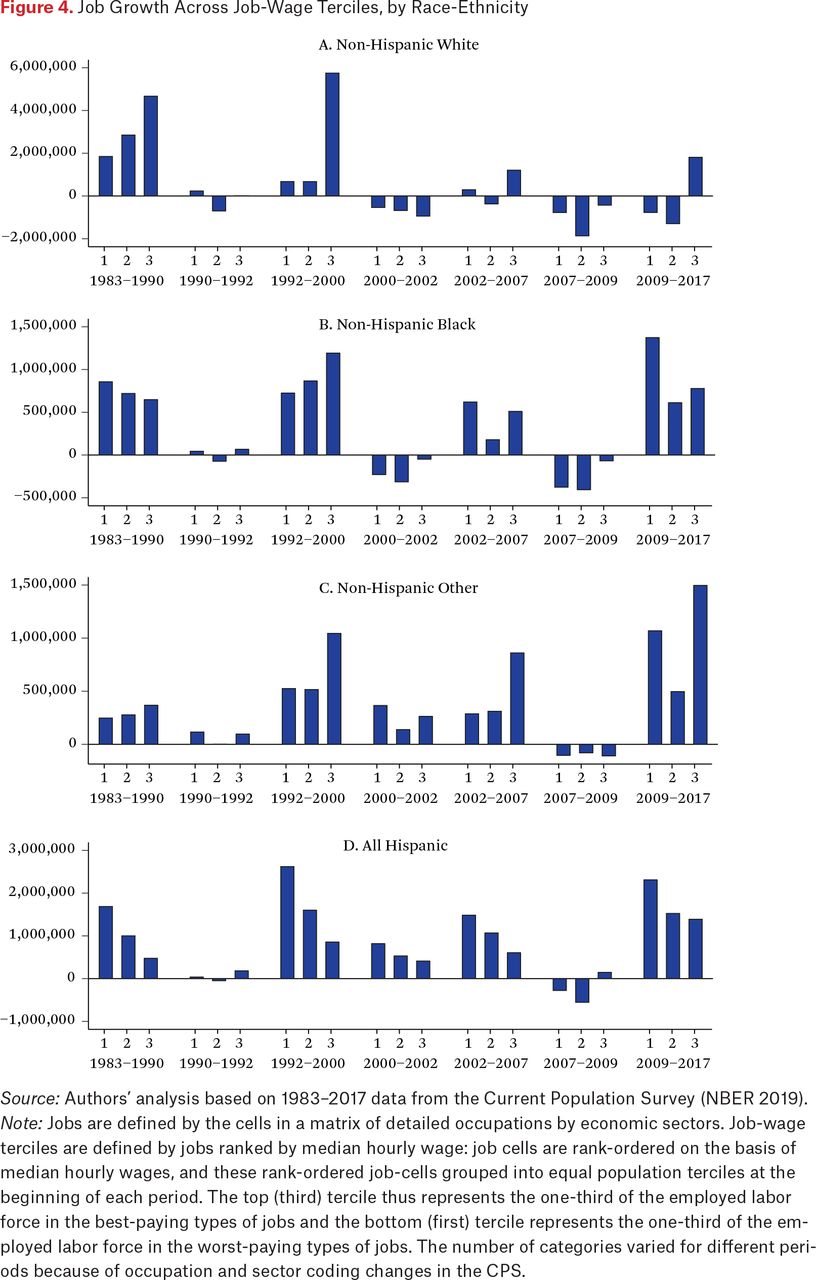
Job Growth Across Job-Wage Terciles, by Race-Ethnicity
Source: Authors’ analysis based on 1983–2017 data from the Current Population Survey (NBER 2019).
Note: Jobs are defined by the cells in a matrix of detailed occupations by economic sectors. Job-wage terciles are defined by jobs ranked by median hourly wage: job cells are rank-ordered on the basis of median hourly wages, and these rank-ordered job-cells grouped into equal population terciles at the beginning of each period. The top (third) tercile thus represents the one-third of the employed labor force in the best-paying types of jobs and the bottom (first) tercile represents the one-third of the employed labor force in the worst-paying types of jobs. The number of categories varied for different periods because of occupation and sector coding changes in the CPS.
- Figure 5.
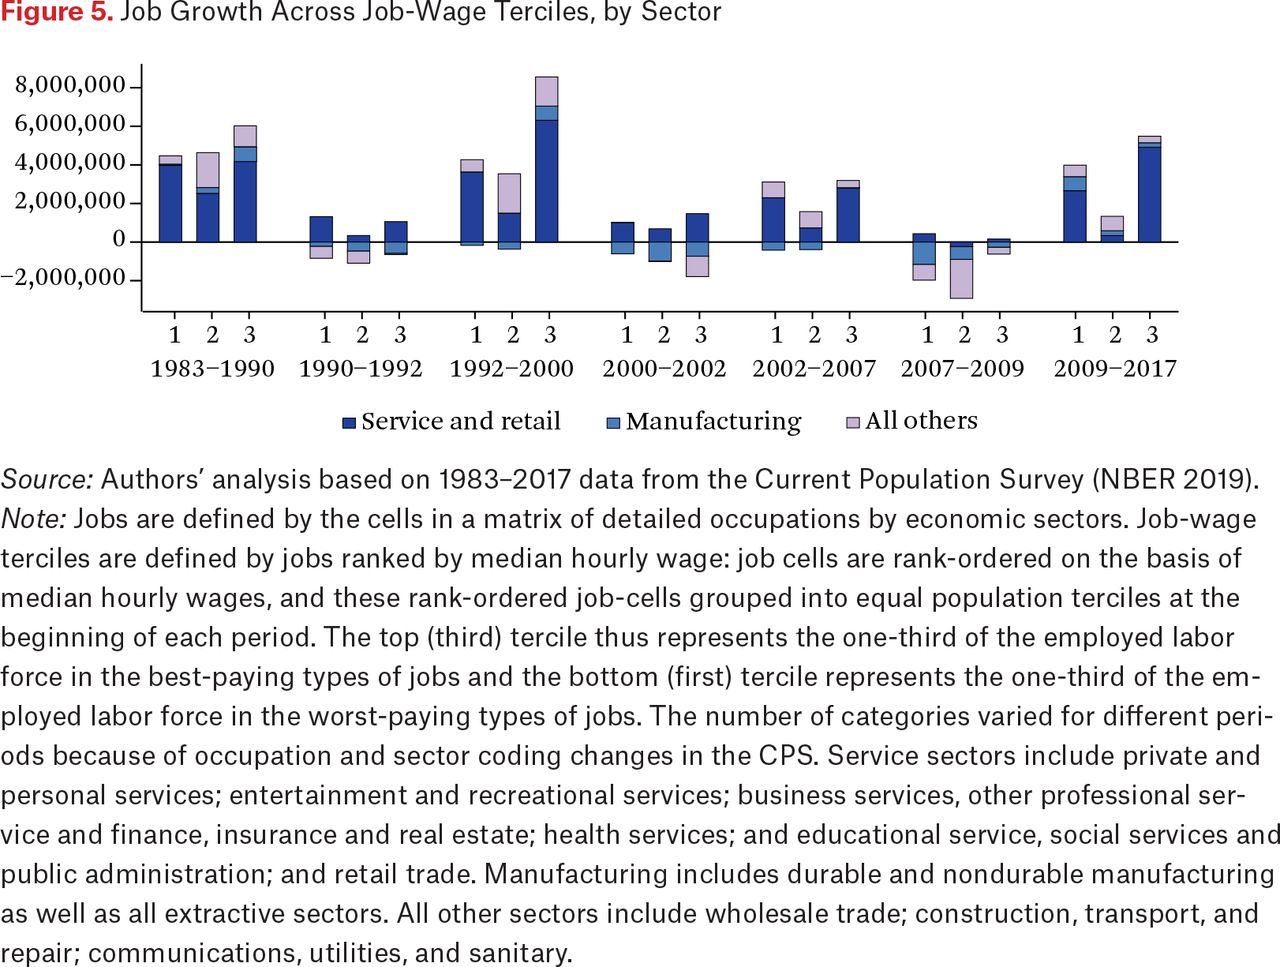
Job Growth Across Job-Wage Terciles, by Sector
Source: Authors’ analysis based on 1983–2017 data from the Current Population Survey (NBER 2019).
Note: Jobs are defined by the cells in a matrix of detailed occupations by economic sectors. Job-wage terciles are defined by jobs ranked by median hourly wage: job cells are rank-ordered on the basis of median hourly wages, and these rank-ordered job-cells grouped into equal population terciles at the beginning of each period. The top (third) tercile thus represents the one-third of the employed labor force in the best-paying types of jobs and the bottom (first) tercile represents the one-third of the employed labor force in the worst-paying types of jobs. The number of categories varied for different periods because of occupation and sector coding changes in the CPS. Service sectors include private and personal services; entertainment and recreational services; business services, other professional service and finance, insurance and real estate; health services; and educational service, social services and public administration; and retail trade. Manufacturing includes durable and nondurable manufacturing as well as all extractive sectors. All other sectors include wholesale trade; construction, transport, and repair; communications, utilities, and sanitary.
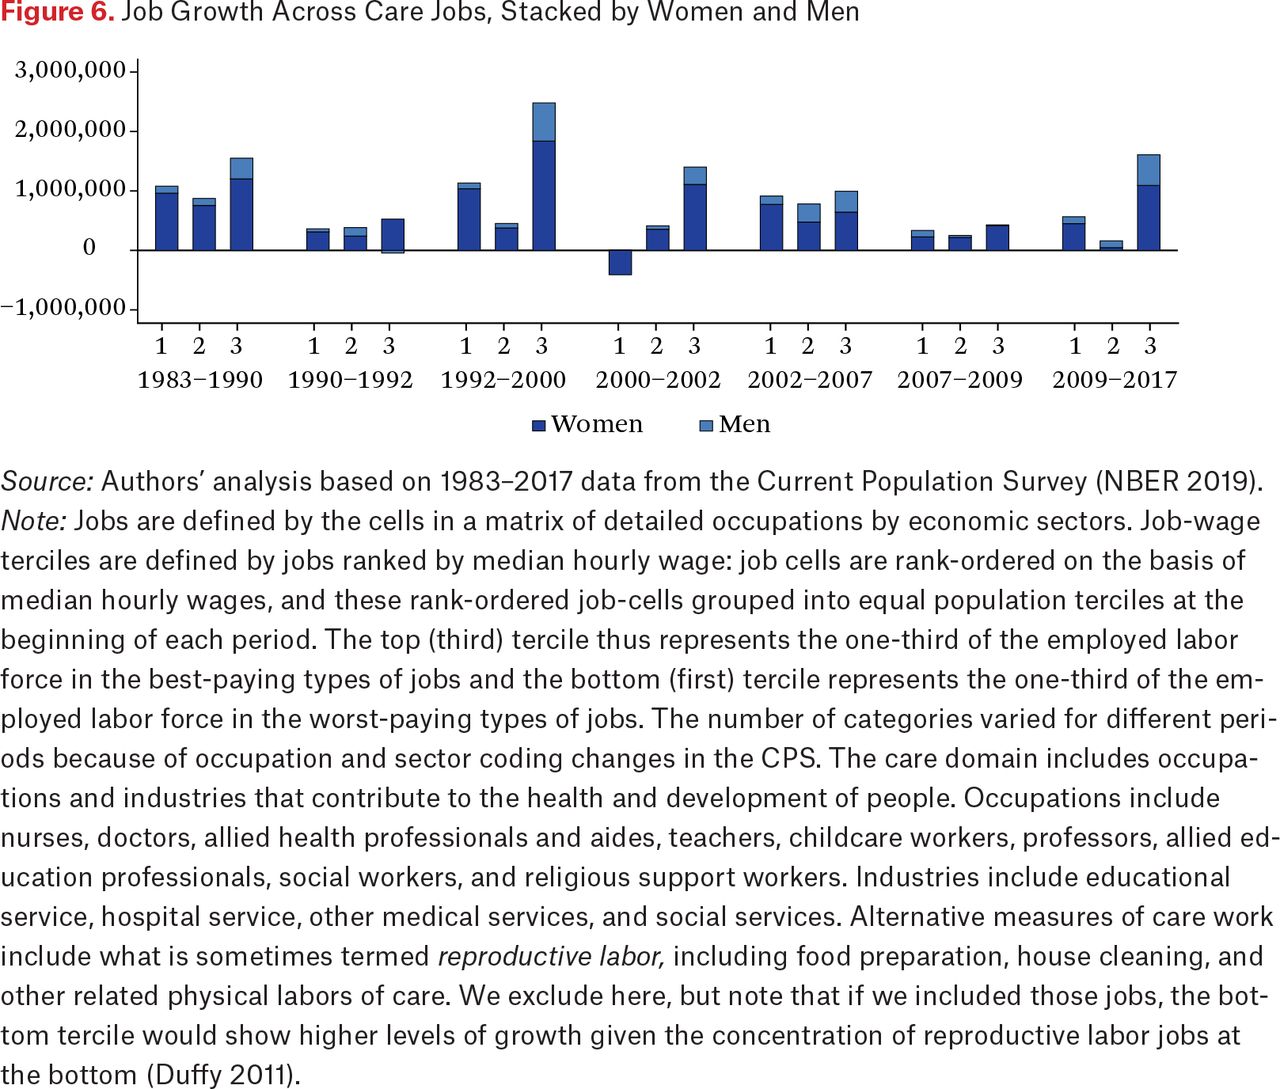
- Figure 6.
Job Growth Across Care Jobs, Stacked by Women and Men
Source: Authors’ analysis based on 1983–2017 data from the Current Population Survey (NBER 2019).
Note: Jobs are defined by the cells in a matrix of detailed occupations by economic sectors. Job-wage terciles are defined by jobs ranked by median hourly wage: job cells are rank-ordered on the basis of median hourly wages, and these rank-ordered job-cells grouped into equal population terciles at the beginning of each period. The top (third) tercile thus represents the one-third of the employed labor force in the best-paying types of jobs and the bottom (first) tercile represents the one-third of the employed labor force in the worst-paying types of jobs. The number of categories varied for different periods because of occupation and sector coding changes in the CPS. The care domain includes occupations and industries that contribute to the health and development of people. Occupations include nurses, doctors, allied health professionals and aides, teachers, childcare workers, professors, allied education professionals, social workers, and religious support workers. Industries include educational service, hospital service, other medical services, and social services. Alternative measures of care work include what is sometimes termed reproductive labor, including food preparation, house cleaning, and other related physical labors of care. We exclude here, but note that if we included those jobs, the bottom tercile would show higher levels of growth given the concentration of reproductive labor jobs at the bottom (Duffy 2011).


Tables
In this issue


Jump to section
Related Articles
Cited By...
- No citing articles found.