
Abstract
Using the 2000 Census and 2005–2019 American Community Surveys, we examine the propensity of older adults to live with children. We show that seniors from disadvantaged subgroups are more likely to live in multi- or skip-generational arrangements. Contextual factors associated with more multigenerational living include a less generous safety net and high housing costs. Skip-generational living is associated with high female incarceration rates. Conditional on demographic characteristics and these contextual factors, seniors in multigenerational living arrangements are less likely to be in poverty and those in skip-generational arrangements more likely. Overall, the findings are consistent with the possibility that multigenerational arrangements help families address resource needs, whereas skip-generational arrangements heighten the risk of poverty or reflect crises that do so.
The U.S. population is older than it has ever been, with the share of adults older than age sixty-five approaching 20 percent of the population, and one for every three adults ages eighteen to sixty-four (Vespa, Medina, and Armstrong 2020). Thanks largely to the Social Security program, the over sixty-five age group has experienced lower rates of poverty than younger age groups since about 1980 (Engelhardt and Gruber 2006; Haveman et al. 2015; Marchand and Smeeding 2016). However, the overall poverty rate among the over sixty-five population of roughly 9 percent masks considerable heterogeneity, with rates of poverty substantially higher for unmarried individuals, women, and households that include children (Li and Dalaker 2021). Moreover, rates of reported material hardship among seniors exceed rates of poverty (Levy 2015).
Living arrangements involving children have been shown to strongly predict disadvantage among seniors. Among older adults, having children under age eighteen in the home is predictive both of being in the lowest income quartile preretirement (Mitchell, Clark, and Lusardi 2021) and of having higher levels of food insecurity (Butcher et al. 2023). Families with multigenerational or skip-generational living arrangements are more economically vulnerable than similar families without grandchildren (Seltzer and Yahirun 2014; Pilkauskas and Dunifon 2016; Ziliak and Gundersen 2016; Dunifon 2018), with potentially large differences between multigenerational and skip-generational households (Dunifon, Ziol-Guest, and Kopko 2014).1
Although researchers have studied the phenomenon of coresidence from the perspective of children (see Dunifon, Ziol-Guest, and Kopko 2014; Pilkauskas, Amorim, and Dunifon 2020), less is known about the various forms of coresidence viewed from the perspective of the older adult, where multigenerational living arrangements are the more common focus (Ruggles 2015). It is important to understand which seniors are living with children in the United States today, what factors are contributing to these living arrangements, and what drives the association between living with children and economic disadvantage. In particular, is the case that seniors who are more likely to be economically disadvantaged are also more likely to live with children, or that living with children is predictive of disadvantage even accounting for known correlates of economic hardship? Additionally, how does the relationship between living with children and disadvantage depend on the form that coresidence takes?
In this article, we use data from the 2000 Census and the 2005–2019 American Community Surveys (ACS) in an investigation of living arrangements of older adults living with children. We examine several types of household structure: multigenerational, skip-generational, and own or other child. We begin by documenting the levels and trends in older adults living with children over the first two decades of the twenty-first century. We find significant differences in both the prevalence and the trends of older Americans living with children across groups in the population. In particular, non-Hispanic White seniors have low rates of coresidence with children that have risen slightly since 2010; non-Hispanic Black, Hispanic, and non-Hispanic Asian seniors have seen declines from considerably higher base rates. Differences are substantial by other demographic characteristics as well, such as foreign-born status, gender, marital status, and education. These differences are evident even in a multiple regression framework when we examine the associations conditional on a number of demographic factors.
We also use a measure of predicted disadvantage to show how living arrangements for seniors vary based on the economic resources they are likely to have at their disposal, when the prediction is based on income in the preretirement working years (fifty to sixty-one) and is a function of a rich set of demographics and state of residence. We find that living arrangements involving children are generally more likely among economically vulnerable seniors.
We then focus on multi- and skip-generational households, and investigate the association between a set of contextual economic and policy variables and these living arrangements in a regression framework, again controlling for an extensive set of demographic characteristics. We also examine whether and how these associations differ for seniors with different levels of predicted resources. Based on research on children living with seniors that considers the correlates of such living arrangements (Gleeson et al. 2009; Dunifon, Ziol-Guest, and Kopko 2014) we consider four groups of economic and policy variables: measures of economic opportunity for workers, measures of safety net generosity, measures of housing affordability, and measures of drug mortality and incarceration. To the best of our knowledge, these variables have not been considered simultaneously in models examining living arrangements among seniors.
We hypothesize that some of these factors will have associations with both the propensity to live in multigenerational and the propensity to live in skip-generational households, while other factors are likely to be more important for one or the other. Greater economic opportunity for workers and greater safety net generosity are both likely to improve the ability of the middle generation to live independently of their parents and to reduce the need for children to live with grandparents.2 In contrast, we hypothesize that housing affordability is likely to have a greater impact on multigenerational living, given that families may respond to higher housing costs by sharing housing. Finally, drug mortality and rising female incarceration rates have been shown to be important correlates of skip-generational living arrangements (Fuller-Thomson, Minkler, and Driver 1997; Johnson and Waldfogel 2002; Hayslip and Kaminski 2005; Minkler and Fuller-Thomson 2005; Park 2006; Gleeson et al. 2009; Pittman 2015; Buckles, Evans, and Lieber 2023).
We find that multigenerational living arrangements are more common when rental costs are higher. Multigenerational living arrangements are less common when safety net policies are more generous, and this relationship is limited to the bottom quartile of the predicted income distribution. In contrast, skip-generational arrangements are less common when rental costs are higher. They are also more common in states and years with higher rates of female incarceration, this relationship being limited to seniors in the bottom of the predicted income distribution. We find no evidence of a correlation between drug mortality and either multigenerational or skip-generational living arrangements.
Finally, we analyze the relationship between living arrangements and economic hardship, accounting for demographic characteristics and economic and policy factors. We find that seniors living in multigenerational arrangements are less likely to be poor than would be predicted based on observable demographic characteristics. Specifically, controlling for the same economic and policy variables previously examined in the analysis of living arrangements as well as a rich set of demographic characteristics, we find that seniors living in multigenerational arrangements are on average 4 percentage points less likely to be in poverty than their counterparts without children in the household. The magnitude of the relationship is larger among seniors predicted to have fewer economic resources in retirement. In contrast, we find that seniors living in skip-generational arrangements are 11 percentage points more likely to be in poverty than their counterparts without children in the household, even after controlling for a detailed set of demographic, economic, and policy variables. Again, the relationship is larger at the bottom of the predicted income distribution.
Our findings highlight heterogeneity in senior outcomes by type of living arrangement and have important implications for public policy. Policies directed at working-age adults may have important spillovers to senior populations due to coresident living arrangements, and policymakers could do more to reduce barriers to safety net program participation among the most vulnerable skip-generation families.
DATA
Our analysis is based on the 2000 Census (5-Percent Public Use Microdata Sample) and the 2005–2019 American Community Surveys (Public Use Microdata Samples).3 These surveys offer rich demographic information for a large, nationally representative sample of individuals living in the United States and their households. The primary sample of interest is older adults ages sixty-five and up living in households, that is, excluding those living in institutions or other group quarters.4
We identify whether these seniors live with any child under age eighteen; for each child, we identify how they are related to the older person using variables that describe the individual’s relationship to the household head and other reported family relationship variables. We focus on social rather than legal relationships such that both married and unmarried partners are treated as having the same relationship status to other members of the household as their partner.
The senior living arrangements are defined into mutually exclusive groups as follows:
Multigenerational. The focal senior lives with their adoptive, step, or biological grandchild under eighteen or the grandchild of their partner, and with their own adult child or that of their partner. This living arrangement most often arises when the adult child of the senior is the parent of the grandchild, but we also define as multigenerational living arrangements those in which the middle generation adult is not the parent of the child. For example, if a child is living with her aunt and grandmother but not her own parent, we would consider the grandmother to be living in a multigenerational household.
Skip-generational. The focal senior lives with their adoptive, step, or biological grandchild under eighteen or the grandchild of their partner, but not with their adult child or that of their partner. This definition most often includes children living with grandparents without their parents, but also includes the case in which the parent of the child is under age eighteen.
Own or other child. Children under eighteen live in the household but are not the grandchildren of the focal senior or their partner. Under this categorization, the senior or their partner is usually but not always the parent of the child.
No child. No child under eighteen lives in the household.
To analyze the relationships between economic and policy variables and the propensity to live with children, we merge data from a variety of other sources to the census or ACS dataset based on year and place of residence using either state or Public Use Microdata Area (PUMA), where PUMAs are nonoverlapping statistical geographic areas defined by the census so as to contain no fewer than one hundred thousand people each. In particular, we obtain measures of economic opportunity for workers, measures of the generosity of the safety net, measures of housing affordability, measures of drug-related mortality, and measures of incarceration. We inflate all dollar-denominated variables to 2019 dollars using the Consumer Price Index for All Urban Consumers (CPI-U) from the Bureau of Labor Statistics (BLS).
Measures of Economic Opportunity for Workers
Measures of economic opportunity variables are measured annually at the state level and include the state’s ratio of employment to population and the minimum wage in effect in the state, which is the state’s statutory minimum wage or the federal minimum wage, whichever is higher. We obtained both measures from the University of Kentucky Center for Poverty Research National Welfare Data, which collates state-level data from a variety of documented sources (UKCPR 2023).
Measures of Safety Net Generosity
Measures of safety net variables are also measured annually at the state level. We obtained data on state Unemployment Insurance generosity, measured as the maximum benefit amount multiplied by the maximum duration of benefits, collated from the Department of Labor’s records of state unemployment insurance laws by Maxim Massenkoff (2024). We also use an index of safety net generosity we describe elsewhere (see Schmidt, Shore-Sheppard, and Watson 2023). It is the sum of refundable tax credits, Temporary Assistance for Needy Families (TANF), and Supplemental Nutrition Assistance Program (SNAP) benefits for which the average single-parent family in a nationally representative sample would be eligible, assuming they took full advantage of the programs for the state and prior calendar year.
Measures of Housing Affordability
We use the census and American Community Survey data to calculate annual median rent at the PUMA level. Because metropolitan area residence status is not reported at the household level in the census or ACS, we match a measure of whether the PUMA is nonmetropolitan as determined by IPUMS USA, the METRO variable (Ruggles et al. 2023) to our data by PUMA and year.
Measures of Drug Mortality and Incarceration
We use a measure of the prior year crude drug-related mortality death rate from the CDC (Centers for Disease Control and Prevention) Wonder database (2021). We obtain the number of male and female prisoners by state and year from the Bureau of Justice Statistics National Prisoner Statistics collection and denominate the numbers with state annual male and female population estimates from the Census Bureau to obtain male and female incarceration rates (U.S. Bureau of Justice 2022).5
Table 1 reports means of variables in the ACS sample used in regression analyses, broken out by type of living arrangement. Demographic differences are notable across groups, as we explore graphically in the next section. In regard to the economic and policy variables, seniors in multigenerational living arrangements are more likely living in a metro area and in places with high median rents and lower drug mortality rates. Skip-generational living arrangements are more common in places and years with less generous safety net policies, with lower median rents, and with higher rates of incarceration.
Variable Means
CHARACTERISTICS AND TRENDS IN SENIORS LIVING WITH CHILDREN
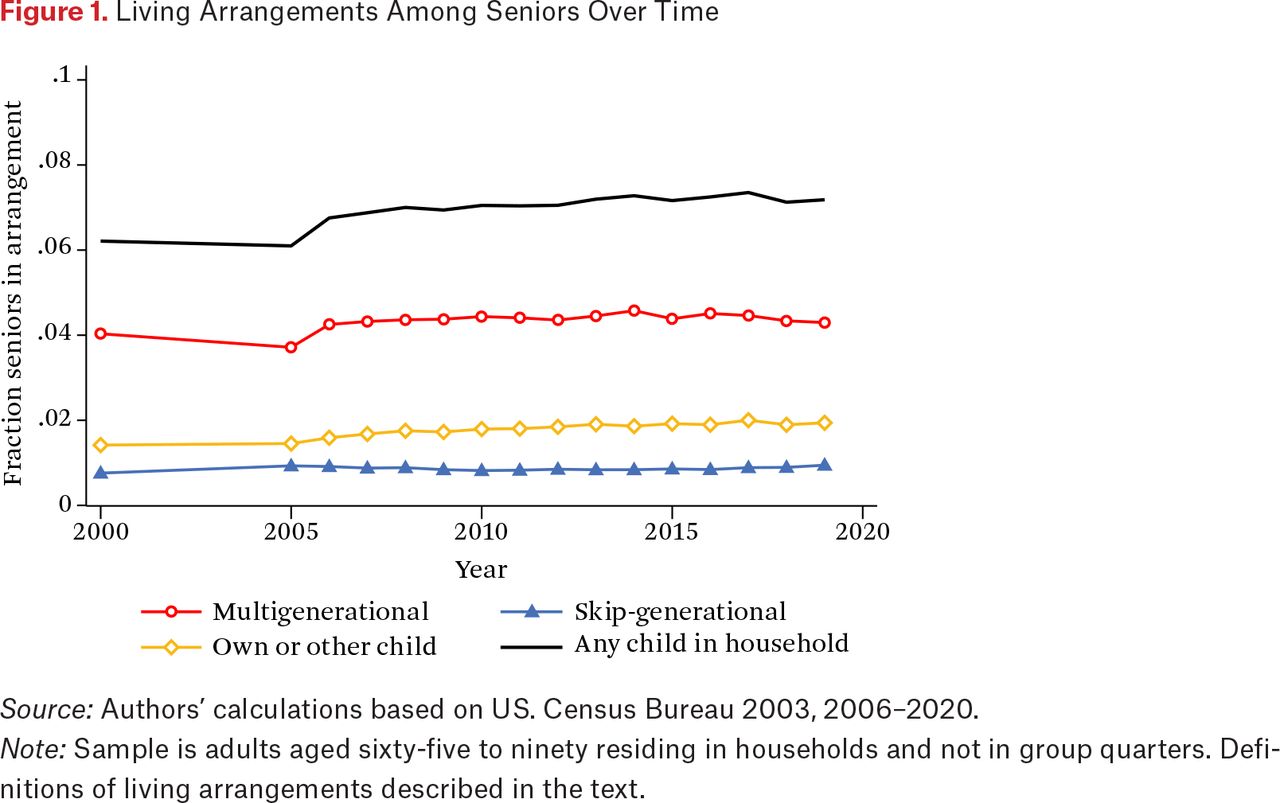
We begin with a graphical analysis describing the prevalence of living with children overall and in the three subcategories of child-coresident household structures over time and by demographic characteristics. Figure 1 shows trends in seniors age sixty-five through ninety living with children between 2000 and 2019. The overall propensity to live with children has risen recently, primarily driven by older adults being more likely to live with their own child. Rates of multigenerational living increased slightly around the time of the Great Recession and have returned to around 4 percent since.6 This pattern is in contrast to the pattern observed when focusing on children, which shows increasing shares of children living in multigenerational and skip-generational arrangements (Dunifon, Ziol-Guest, and Kopko 2014; Pilkauskas, Amorim, and Dunifon 2020). This difference can be explained by demographic shifts in the population. Reductions in fertility in previous generations and longer life expectancy have led to increases in the share of seniors in the population. In total, 7.2 percent of adults between the ages of sixty-five and ninety live with a child in their household in 2019.

Living Arrangements Among Seniors Over Time
Source: Authors’ calculations based on US. Census Bureau 2003, 2006–2020.
Note: Sample is adults aged sixty-five to ninety residing in households and not in group quarters. Definitions of living arrangements described in the text.
Figure 2 illustrates the substantial differences in living arrangements by race and ethnicity, with non-Hispanic White seniors having the lowest prevalence of living with children among all major race-ethnicity groups. In 2019, 4.5 percent of non-Hispanic White seniors live with children, compared with 11.7 percent of non-Hispanic Black seniors, 17.7 percent of Hispanic seniors, and 20.6 percent of non-Hispanic Asian seniors. Figure 2 also makes clear that multigenerational living arrangements are particularly common among Asian and Hispanic seniors, and that skip-generational situations are most common among non-Hispanic Black seniors. The propensity to live with children is declining between 2000 and 2019 for most major race-ethnicity groups, but increases slightly among non-Hispanic White seniors over this period, from 3.5 to 4.5 percent of seniors.

Living Arrangements by Race-Ethnicity
Source: Authors’ calculations based on U.S. Census Bureau 2003, 2006–2020.
Note: Sample is adults aged sixty-five to ninety residing in households and not in group quarters observed in 2000 Census and 2005–2019 American Community Surveys. Other race-ethnicity defined to include those reporting more than one race. Definitions of living arrangements described in the text.
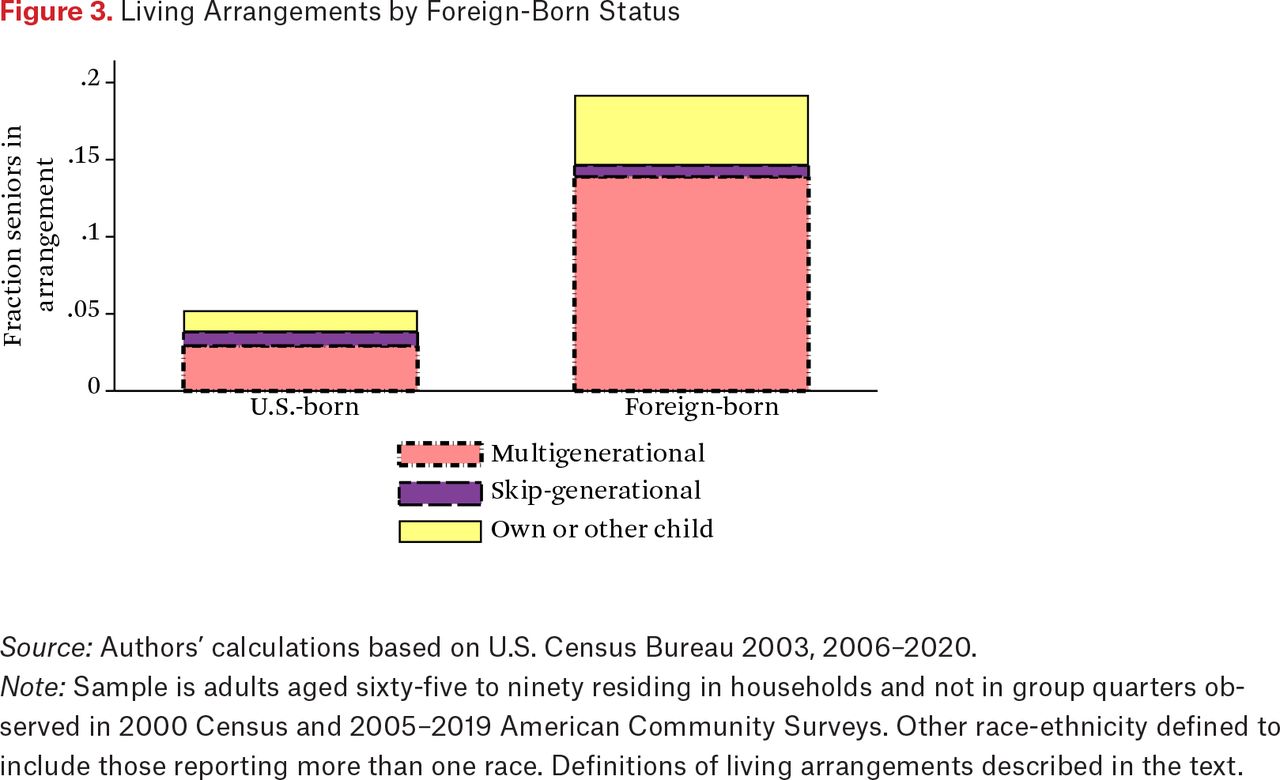
We next pool the years of analysis (2000 and 2005 through 2019) to characterize some key demographic patterns. Figure 3 shows that foreign-born seniors are much more likely to live with children, particularly in multigenerational arrangements, than native-born seniors (19.2 versus 5.2 percent for the full sample). This propensity of foreign-born seniors to live with children is also evident within each major race-ethnicity group (results not shown).

Living Arrangements by Foreign-Born Status
Source: Authors’ calculations based on U.S. Census Bureau 2003, 2006–2020.
Note: Sample is adults aged sixty-five to ninety residing in households and not in group quarters observed in 2000 Census and 2005–2019 American Community Surveys. Other race-ethnicity defined to include those reporting more than one race. Definitions of living arrangements described in the text.
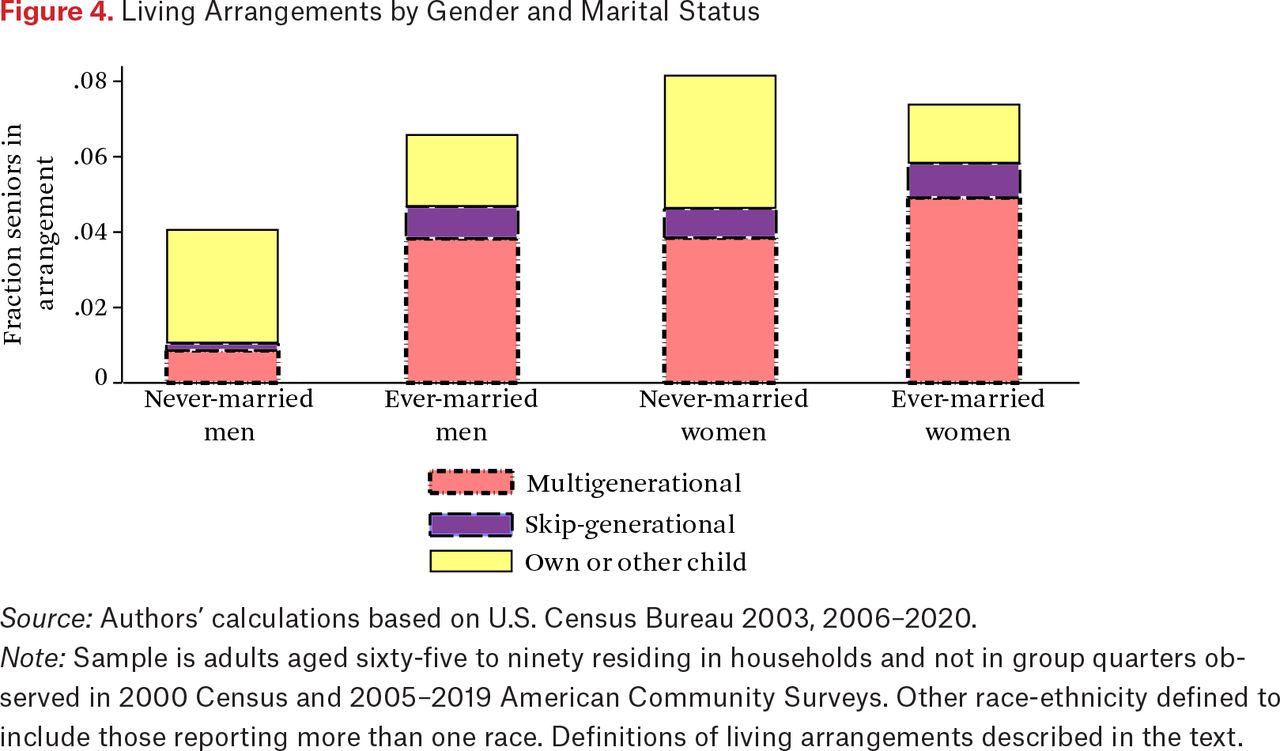
Figure 4 illustrates differences by sex and marital status, breaking out living arrangements for men and women separately by never married and ever married. Never-married men are less likely to be living with children (4.1 percent) than either ever-married men (6.6 percent) or women (8.2 and 7.4 percent for never-married and ever-married women, respectively). Among never-married men, the bulk of those living with children are living with their own children, and multigenerational living is uncommon. Among the other three groups, multigenerational living arrangements play a much larger role.

Living Arrangements by Gender and Marital Status
Source: Authors’ calculations based on U.S. Census Bureau 2003, 2006–2020.
Note: Sample is adults aged sixty-five to ninety residing in households and not in group quarters observed in 2000 Census and 2005–2019 American Community Surveys. Other race-ethnicity defined to include those reporting more than one race. Definitions of living arrangements described in the text.
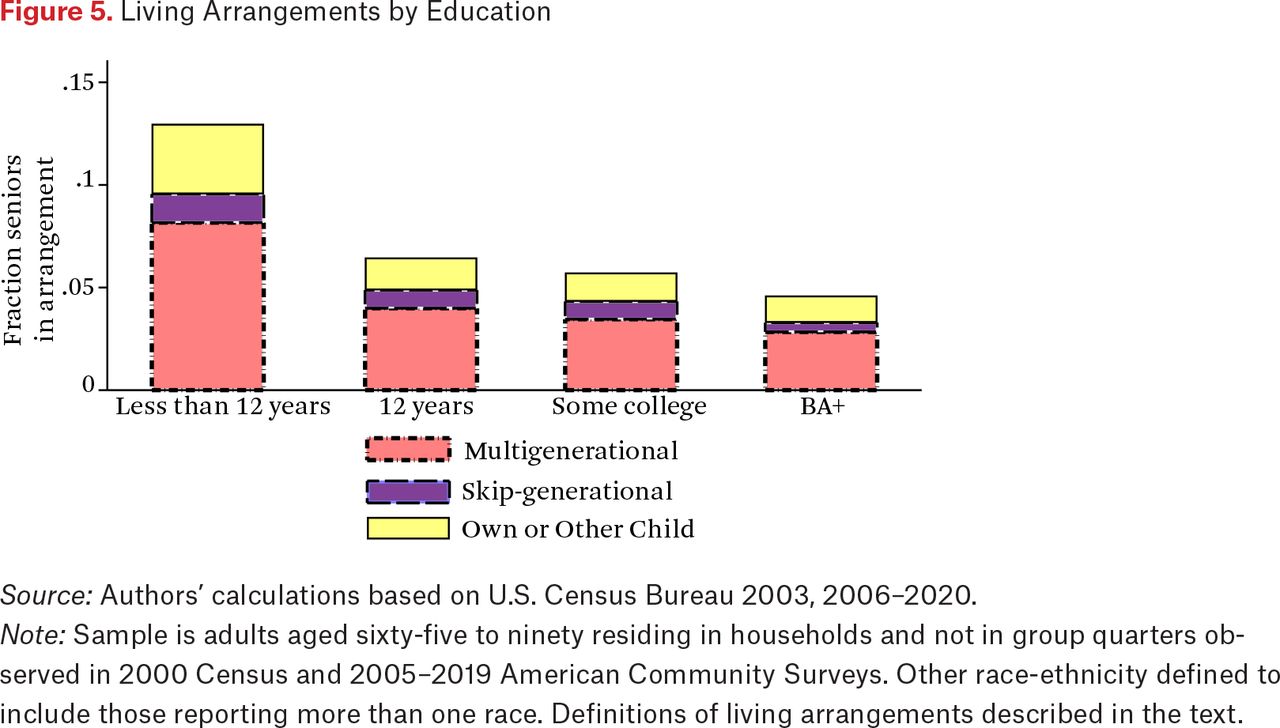
Figure 5 presents living arrangements by educational attainment of the senior, breaking out those with less than a high school degree from high school graduates, those with some college, and those with college degrees. We see an educational gradient in the prevalence of living with children, with the highest rates of child coresidence among those with less than a high school degree (13.0 percent), half that rate for high school graduates (6.5 percent), and the lowest rates among college graduates (4.6 percent). Multigenerational households are the most common arrangement across all educational categories, with both own or other children and skip-generational arrangements playing a larger role among the least well educated.

Living Arrangements by Education
Source: Authors’ calculations based on U.S. Census Bureau 2003, 2006–2020.
Note: Sample is adults aged sixty-five to ninety residing in households and not in group quarters observed in 2000 Census and 2005–2019 American Community Surveys. Other race-ethnicity defined to include those reporting more than one race. Definitions of living arrangements described in the text.
This graphical analysis shows that race-ethnicity, nativity, gender, marital status, and education are important predictors of the propensity to live with children among seniors. However, these demographic factors are correlated with one another, so it is important to examine the partial effect of each factor controlling for the others using a regression framework.
We show the results of this exercise in table 2. The analysis sample is slightly modified to include only observations for which we have the full suite of control variables used, so we drop the District of Columbia, for which we lacked incarceration data for almost all years, and three years of data for North Dakota. The regressions control for year fixed effects, state fixed effects, and age fixed effects, and standard errors are clustered at the state level. Column 1 presents results for any living with children, and the patterns are consistent with the raw associations in the data: seniors who identify as Hispanic or non-White, foreign-born seniors, and those with less education are more likely to live with children even conditional on other demographic characteristics. Ever-married men and women (regardless of marital status) are significantly more likely to live with children than never-married men.
Demographic Correlates of Living with Children
Columns 2 through 4 break results out by the specific category of living with children, presenting results for multigenerational in column 2, skip-generational in column 3, and own or other children in column 4. In general, the patterns are similar to those in column 1. Non-Hispanic White seniors have the lowest likelihood of any of the three types of living arrangements, as do the most educated seniors. One interesting difference is that although foreign-born seniors are significantly more likely to live in either multigenerational households or with their own or other children than the native born, they are significantly less likely to live in skip-generation households. In addition, ever-married seniors (both male and female) are significantly less likely to live with their own or other children than never-married seniors, holding other characteristics constant.
PREDICTING ECONOMIC RESOURCES AT OLDER AGES
Our analysis thus far has shown that seniors living with children are more likely to be from minoritized race-ethnicity groups, to be foreign born, and to have less education. These factors suggest that, separate from any direct impact of their living arrangements, seniors with children in the household may have fewer economic resources at their disposal. To formally investigate this possibility and summarize predicted economic resources, we use a regression model to characterize income in the period before typical retirement age, which—because it correlates with both Social Security benefit amounts and wealth—serves as a proxy for economic resources at older ages, without being directly affected by living arrangements in old age or by the Social Security claiming and retirement decision.
In particular, we consider the total personal income (adjusted to 2019 dollars) of those ages fifty through sixty-one. We assign married individuals half of the combined total personal income for the couple, and assign unmarried individuals their total personal income. We then use a rich set of variables to predict income by demographic cell, where cells are defined by the interactions of race-ethnicity, foreign-born status, gender, an indicator for whether the person has ever been married, and a set of detailed education dummies. State fixed effects are also included.
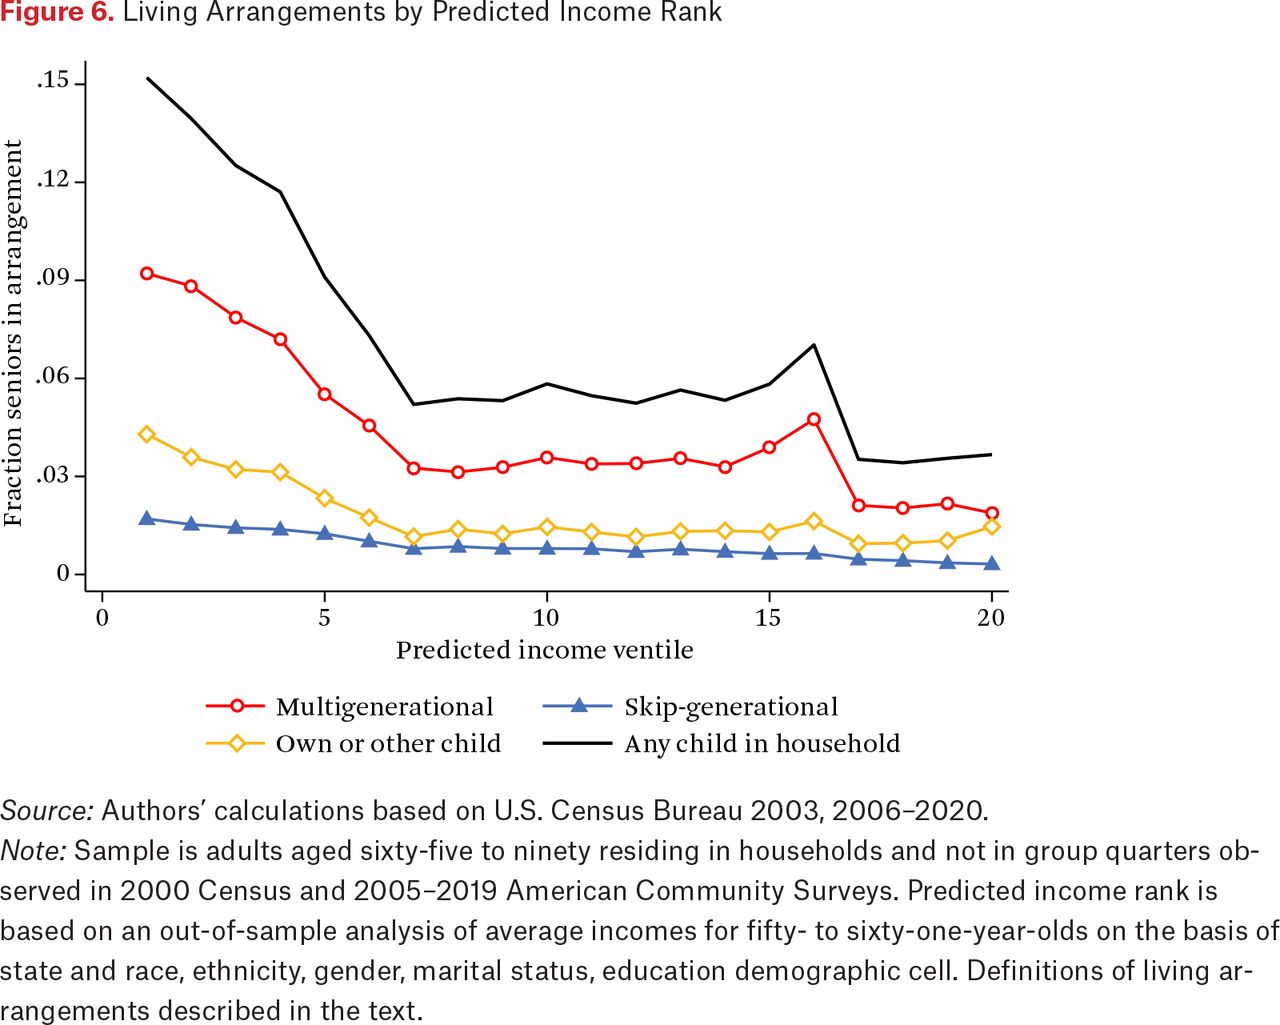
Next, we apply the coefficients from the prediction model to the primary sample of interest, those ages sixty-five through ninety, to generate a ventile rank. This rank is a summary measure of predicted economic resources based on demographics and state of residence. Figure 6 shows how this rank correlates with the share of seniors in living arrangements. More economically vulnerable groups—roughly the bottom third of the predicted income distribution—are much more likely to be in living arrangements with children, with the propensity to live with children falling sharply through the first through seventh ventiles and declining much more gradually with greater predicted income in the upper two-thirds of the distribution.

Living Arrangements by Predicted Income Rank
Source: Authors’ calculations based on U.S. Census Bureau 2003, 2006–2020.
Note: Sample is adults aged sixty-five to ninety residing in households and not in group quarters observed in 2000 Census and 2005–2019 American Community Surveys. Predicted income rank is based on an out-of-sample analysis of average incomes for fifty- to sixty-one-year-olds on the basis of state and race, ethnicity, gender, marital status, education demographic cell. Definitions of living arrangements described in the text.
How Does the Economic and Policy Context Relate to Living with Children?
We now turn to our analysis of the relationship between living arrangements and economic and policy factors. The models also control for year fixed effects, state fixed effects, and age fixed effects, as well as fully interacted demographic controls, including race-ethnicity, foreign-born status, gender, ever-married status, and educational attainment. We focus on how these variables are associated with the likelihood of living in multigenerational and skip-generational arrangements for the overall sample, as well as separately by four predicted income quartiles. The analysis sample is as described.
Table 3 shows the relationship of these contextual variables with multigenerational living arrangements. The first column is for all seniors, and the remaining columns split the sample into four predicted income quartiles, where Q1 is the lowest income quartile, and Q4 is the highest income quartile. We find no statistically significant relationship between multigenerational living arrangements and the state employment-to-population ratio. The minimum wage does have a statistically significant association with living arrangements for older adults in the middle of the predicted income distribution.
Economic and Policy Predictors of Multigenerational Living Arrangements by Predicted Income Quartile
We also find that a less generous safety net is predictive of multigenerational living arrangements for seniors in the lower end of the predicted economic distribution. Seniors in the lower half are significantly less likely to live in multigenerational arrangements when Unemployment Insurance is more generous. More generous cash and food support through refundable tax credits, TANF, and SNAP is also associated with less multigenerational living for older adults in the bottom quartile. An additional $1,665 in cash and food benefit eligibility, which roughly corresponds to a 10th to 90th percentile jump in state generosity, is associated with a 1.1 percentage point lower rate of multigenerational living in the bottom quartile. These programs are more targeted at the working-age population, and might help the middle generation live independently. The results are consistent with similar findings regarding the Earned Income Tax Credit (Pilkauskas and Michelmore 2019).
Living in a metro area is associated with more multigenerational living throughout the predicted income distribution, and high rents are associated for all but the highest quartile. This suggests that doubling up through multigenerational living may be a response to high housing costs. For example, moving from the 10th percentile rent area to the 90th percentile rent area, which corresponds to an extra $1,080 in monthly rent, is associated with a multigenerational living increase of 1.1 percentage point overall and 2.4 percentage points for bottom quartile seniors.
The relationship between drug mortality and living arrangements is not statistically significant. The association is positive, however, of female incarceration with multigenerational living for seniors in the bottom half of the predicted income distribution, although only statistically significant for the second quartile. This could reflect multigenerational living arrangements providing support for families facing disruption due to incarceration.
Table 4 repeats the analysis for skip-generational living arrangements. Here we see suggestive evidence that a higher minimum wage reduces the propensity to live in a skip-generational arrangement. Unemployment insurance has the opposite sign, with more generous systems associated with more skip-generation arrangements. The estimated coefficients on the cash and food safety net variable are not statistically significant. Skip-generational living is more common in places with low rents, possibly because they are areas in economic decline. We find no evidence of an association between drug mortality rates and skip-generational living arrangements. Finally, state female incarceration rates are positively associated with skip-generational living arrangements, particularly for seniors in the bottom economic quintile. Moving from the 10th to 90th percentile state is equivalent to an increase in the state female incarceration rate of 0.074 per hundred women and the associated increase in skip-generational arrangements is 0.56 percentage points for the least advantaged seniors.
Economic and Policy Predictors of Skip-Generational Living Arrangements by Predicted Income Quartile
In sum, a number of contextual factors are associated with living arrangements, even after accounting for individual characteristics, year fixed effects, and state fixed effects. Though not a causal analysis, the results suggest a potential role for safety net generosity, housing prices, and incarceration in determining living arrangements among seniors.
LIVING WITH CHILDREN AND POVERTY
Finally, we investigate the association between living with children and poverty, both overall and separately by predicted income quartile, conditioning on the same set of demographics and interactions that we used to predict the income rank. Living with grandchildren and adult children may be beneficial to seniors by providing financial resources, socioemotional support, and caregiving. On the other hand, pooling resources with children may be in response to economic hardship or itself result in economic hardship.
We use the ACS-defined poverty status of the senior, which is defined on the basis of income including government program cash transfers but before taxes. An individual’s poverty status depends on who is in their census-defined family, which may differ from the group of individuals actually sharing resources in the household (for more detail, see U.S. Census Bureau 2023). The poverty status typically fluctuates as family members enter or leave a household because the needs and the resources of the family change. Consequently, we treat these estimates as informative about the nature of relationship between the economic status of seniors and their living arrangements rather than as a precise measure of this relationship.
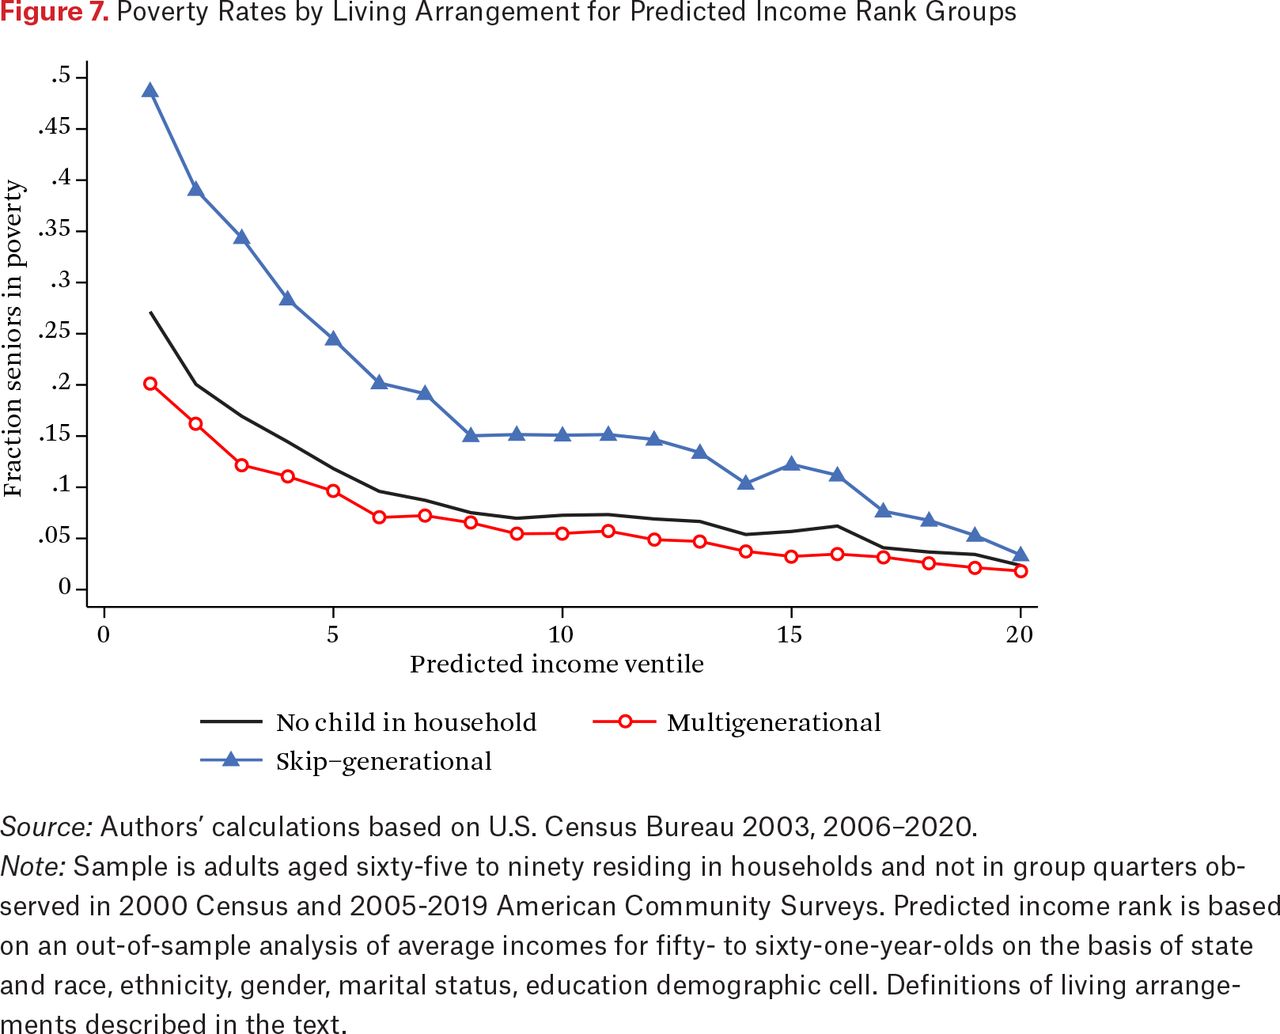
Using the same approach of predicting the ventile rank in economic resources for seniors as in figure 6, we examine how the rate of poverty varies by ventile of predicted economic resources and living arrangement. Figure 7 shows that the share of seniors in skip-generational living arrangements living in poverty is greater than that in all other living arrangements throughout the predicted income distribution. The poverty rate is strikingly high among seniors whose demographic characteristics predict low resources and above 25 percent for seniors in skip-generational living arrangements who are in the bottom fifth of the predicted income distribution. The relationship between predicted resources and poverty among this group is perhaps unsurprising, but it is notable that the rate of poverty among seniors in skip-generational living arrangements is above 10 percent for all except the top quintile of the predicted distribution. In contrast, poverty rates among seniors in multigenerational living arrangements are lower than those among seniors living without children in the household.

Poverty Rates by Living Arrangement for Predicted Income Rank Groups
Source: Authors’ calculations based on U.S. Census Bureau 2003, 2006–2020.
Note: Sample is adults aged sixty-five to ninety residing in households and not in group quarters observed in 2000 Census and 2005-2019 American Community Surveys. Predicted income rank is based on an out-of-sample analysis of average incomes for fifty- to sixty-one-year-olds on the basis of state and race, ethnicity, gender, marital status, education demographic cell. Definitions of living arrangements described in the text.
We next explore the relationship between living with a child and poverty in a regression context. Results in column 1 of table 5 control only for year, state, and the age of senior, and show that seniors who live with children are 3.5 percentage points more likely to be poor. However, many demographic and policy variables are correlated with both living arrangements and poverty. Column 2 incorporates the full set of demographic and policy controls and shows an opposite-signed though insignificant association—that is, seniors living with children are no more likely to be poor after controlling for these factors.
Predictors of Poverty
Given the results in figure 7, which indicate heterogeneity in this relationship by type of living arrangement, we show detailed results in column 3 of table 5. After controlling for the same set of demographic and policy factors, multigenerational living appears to be protective against poverty, whereas skip-generational living is associated with higher rates of poverty, consistent with the less-controlled results from figure 7. Columns 4 through 7 stratify results by predicted income quartile. We see that both of these patterns—higher poverty among skip-generational households and lower poverty among multigenerational households—are seen throughout the predicted income distribution, but are especially pronounced among those in the bottom quartile. Seniors in the first quartile of the predicted income distribution living in skip-generational households have a 15.8 percentage point higher likelihood of poverty than their counterparts living without children, whereas those in multigenerational arrangements have a 6.5 percentage point lower likelihood. Interestingly, this pattern differs from the pattern for reported food insecurity, which is higher for seniors living with children than for seniors living without children (Butcher et al. 2023). This difference is worth exploring in future work.
CONCLUSION
In this article, we use the 2000 Census and the 2005 through 2019 American Community Surveys to examine the likelihood of seniors to live with children over the first two decades of the twenty-first century. We focus on the living arrangements from the perspective of seniors rather than the perspective of children, and find that in contrast to the patterns viewed from the perspective of children (Pilkauskas, Amorim, and Dunifon 2020), the share of seniors living with children has been relatively stable over this time. However, this overall stability masks important underlying differences by demographic characteristics, such that non-Hispanic White seniors are less likely to live with children than seniors in other racial and ethnic groups, and those who are foreign born and those with less education are more likely. The trends differ across groups as well, with rates among non-Hispanic White seniors rising slightly since 2010, and rates among non-Hispanic Black, Hispanic, and non-Hispanic Asian seniors declining from considerably higher base rates.
Examining the factors contributing to these living arrangements among seniors, we conduct a multivariate analysis that considers economic and policy variables as well as demographic characteristics and a measure of predicted disadvantage based on income patterns among older working-age adults. We show that seniors with higher predicted disadvantage are more likely to live with children. A number of policy and contextual variables are associated with living arrangements, with a more generous safety net and lower housing prices correlated with lower rates of multigenerational living, and female incarceration rates associated with higher rates of multi- and skip-generation living. Our findings confirm results from qualitative studies and studies of inmates that find a relationship between female incarceration and skip-generation living (Johnson and Waldfogel 2002; Gleeson et al. 2009). In addition, our work provides evidence that in addition to being associated with the well-being of households with seniors and children (Minkler and Fuller-Thomson 2005; Park 2006; Pittman 2015) safety net generosity is associated with the likelihood that such households form.
Finally, we examine the association between child-coresident living arrangements and poverty status, controlling for a rich set of demographic controls as well as the economic and policy context variables discussed. Our results suggest that multigenerational living arrangements are associated with lower poverty rates than those found among seniors living without children, whereas skip-generational living arrangements are associated with higher poverty rates, even after controlling for demographic and other factors that are correlated with the likelihood of forming multigenerational versus skip-generational living arrangements. Overall, the findings are consistent with the possibility that multigenerational arrangements can help families address resource needs, whereas skip-generational arrangements heighten the risk of poverty for seniors or reflect crises that do so.
Our findings are descriptive and do not imply causal relationships, but they are relevant for policy. The number of seniors in the United States is projected to increase by 24.7 million between 2020 and 2040 (Vespa, Medina, and Armstrong 2020), and the demographic composition of those seniors is evolving in ways that make coresidence with children more likely. Our results also suggest that high housing costs, an area of policy concern in many localities, may increase the likelihood that seniors live with children. In addition, our results are consistent with the idea that safety net generosity reduces living with children, and that female incarceration rates increase it. As a result, policies aimed at working-age adults, like safety net programs or criminal justice reform, may have indirect spillover effects on senior well-being.
In addition, skip-generation living arrangements are strongly correlated with poverty and thus skip-generational families are particularly economically vulnerable. Qualitative evidence has documented that many grandparents raising grandchildren face a number of barriers in accessing safety net benefits (Pittman 2015). Our results imply that reducing these barriers could improve the well-being of both generations.
FOOTNOTES
↵1. Skip-generational households are often the most disadvantaged and can be due to parents being unable to care for children for a number of reasons. Multigenerational households are sometimes formed as a response to economic need, but are sometimes formed as a result of cultural preferences (Dunifon, Ziol-Guest, and Kopko 2014).
↵2. For example, Natasha Pilkauskas and Katherine Michelmore (2019) show that higher simulated Earned Income Tax Credit benefits reduce multigenerational residence among single-mother families.
↵3. For 2001 through 2004, the American Community Survey does not report geographic information more finely than the state level; we therefore exclude those years from the analysis.
↵4. There has been a secular decline in age-specific institutionalization rates over our time period (Butcher, Moran, and Watson 2022), but the decline is largest among the oldest seniors, who are the least likely to live with children.
↵5. Because the Federal Bureau of Prisons is responsible for sentenced prisoners in Washington, D.C., the male and female incarceration rate variables are available only for the fifty states. Consequently, regression models are estimated for the fifty states excluding Washington, D.C.
↵6. In the first half of the 2000s, the American Community Survey was experimental and had a less standardized format and a smaller sample size. We do not use the 2001 to 2004 waves due to the lack of detailed geographic information noted, and we believe the jump between 2005 and 2006 to be an artifact of these data issues.
- © 2025 Russell Sage Foundation. Schmidt, Lucie, Lara Shore-Sheppard, and Tara Watson. 2025. “Living with Children and Economic Disadvantage Among Seniors.” RSF: The Russell Sage Foundation Journal of the Social Sciences 11(2): 46–64. https://doi.org/10.7758/RSF.2025.11.2.03. The authors thank Russell Sage Foundation Visiting Scholar Seminar series participants and participants in the author’s conference for this volume for helpful feedback. Simran Kalkat and Agustin Aliaga provided excellent research assistance. Direct correspondence to: Lara Shore-Sheppard, at lshore{at}williams.edu, 24 Hopkins Hall Drive, Williamstown, Massachusetts, 01267, United States.
Open Access Policy: RSF: The Russell Sage Foundation Journal of the Social Sciences is an open access journal. This article is published under a Creative Commons Attribution-NonCommercial-NoDerivs 3.0 Unported License.
REFERENCES
In this issue


Jump to section
Related Articles
Cited By...
- No citing articles found.