
Abstract
Using the data on 6.8 million individuals from the 1980, 1990, and 2000 decennial censuses and the 2010 and 2019 American Community Surveys, we document changes in living alone over the four decades across five ten-year age groups—twenty-five to thirty-four, thirty-five to forty-four, forty-five to fifty-four, fifty-five to sixty-four, and sixty-five to seventy-four—for each gender and race group. The analysis reveals no substantial change in living alone for most groups over time, save older men showing an increase in the share of solo living. Four-year-college-educated men are more likely to live alone than less-educated counterparts at younger ages. The relationship is reversed at older ages. This educational crossover is not observed among women, who show educational convergence only at older ages. Blacks are more likely to live alone than whites, though the age and education patterns are similar.
The number of one-person households in the United States has soared over the last six decades. In 1960, they totaled 6.9 million, accounting for 13 percent of all types of households. Six decades later, the number of one-person households has increased to thirty-six million, 28 percent of all households (U.S. Census Bureau 2022). At the same time, the media have portrayed the increased proportion of adults living alone as inevitable, warning the public of potentially negative consequences of living alone for individuals and society (Chamie 2021; Goldstein and Gebeloff 2022). Recently, the U.S. Surgeon General declared loneliness and social isolation as an epidemic, which presumes detrimental impacts on both mental and physical health of individuals, prompting urgent public health concerns (Office of the Surgeon General 2023). The advisory report addressed the demographic trend of an increasing prevalence of one-person households as one of the factors contributing to heightened loneliness and isolation.
However, it is often ignored that the increase in the share of one-person households has been modest during the last four decades since 1980 (only 5 percentage points, from 23 percent in 1980 to 28 percent in 2020) after a more substantial rise over the earlier two decades. Moreover, the rise of one-person households does not necessarily mean an increase in the proportion of adults who live alone at the population level. As demographers have warned, demographic changes over time based on counting households should not be confused with changes based on counting people (Fischer and Hout 2006; Park and Choi 2015; Ruggles and Brower 2003). In fact, our estimates based on the census and American Community Survey show only a modest change in the share of women living alone among those aged twenty-five to seventy-four, from 12 percent in 1980 to 14 percent in 2019. The corresponding increase is more substantial among men: from 9 percent to 14 percent.1 Based on census data, David Reher and Miguel Requena (2020) also present that the percentage of women age sixty-five or older who live alone actually declined from 37 percent in 1980 to 31 percent in 2015.
The modest change in the overall share of adults living alone can be the result of competing trends for different demographic groups. Trends in living alone can be heterogeneous by age, education, gender, and race, preventing a single story of temporal changes in solo living. A particularly significant source of confusion in the literature on living alone is who is more likely to do so. Are those with more socioeconomic resources more likely to live alone than their counterparts with fewer resources or vice versa? On one hand, scholars who emphasize independence and freedom associated with living alone, tend to suggest that those who can afford it are more likely to live alone by choice (Klinenberg 2012; Macvarish 2006). On the other hand, scholars who highlight the socioeconomic vulnerability of those who live alone tend to suggest the opposite: those with fewer socioeconomic resources may be pushed out to live alone because they have no other choice (Bennett and Dixon 2006).
These two perspectives, however, are not necessarily in conflict. Instead, they may complement each other in that the nature of living alone actually depends on the stage of life course. Independent living may be considered as an ideal living arrangement for young people in their twenties and early thirties so that young adults with more resources are able to afford solo living. But those who live alone at later ages without a spouse, partner, or family members are likely to come from the lower end of socioeconomic hierarchy. Therefore, the relationship between living alone and socioeconomic status may vary across the life course: the positive relationship in young adulthood may become null and even reversed to be negative in the older life stage (see Lamidi 2022; for a contrast finding, see Reher and Requena 2020). As will become clear, one of the major findings from the current study is the educational crossover across age in the share of people living alone among men, though not among women. At younger ages, men with a bachelor’s degree or higher are more likely to live alone than their non-college-educated counterparts, whereas at older ages the relationship is reversed.
In documenting trends in solo living over the last forty years, this study focuses on educational differences in solo living and their temporal changes. Among many possible indicators of socioeconomic resources, educational attainment indicates both economic and cultural resources. Relative to income, which is available only for the working population, educational attainment is applied to everyone. Many studies rely on educational attainment in documenting long-term demographic trends for different socioeconomic groups, providing useful references for the current study of living alone (Martin 2006; Torr 2011). In particular, the literature on diverging destinies has highlighted divergence over time in key family behaviors between less and more educated individuals in the United States and other societies (McLanahan 2004; Raymo, Park, and Yu 2023). Although the focus of the diverging destinies framework is on family behaviors such as mothers’ employment and father’s involvement that are relevant for children’s well-being, the same framework can be useful to guide hypotheses on potential divergence in other family behaviors like living alone that are not directly relevant for children’s well-being.
The discussion on the age variation in the relationship between education and solo living highlights the importance of a life-course perspective. The perspective aids in understanding how the likelihood of living alone varies across different life stages when individuals make transitions to young, middle, and late adulthood (Sandström and Karlsson 2019). As many studies recognize, living alone has been studied primarily among the elderly (Mudrazija et al. 2020; Reher and Requena 2020). Some studies have extended their interest to living alone during middle age or even more broadly during working years (Lamidi 2022; Sandström and Karlsson 2019). Studies of the transition to adulthood often examine solo living in relation to leaving the parental home as a marker of adulthood (Chaloupková 2023). However, given that these studies investigated living alone separately at different life stages, the complete picture of how prevalence and determinants of living alone vary across life stages has not clearly emerged yet.
This study investigates how living alone has changed over the last four decades in the United States for different ages, genders, races, and education levels. By looking at ten-year age groups in each of the 1980, 1990, and 2000 Censuses and 2010 and 2019 American Community Surveys (ACS) for all adults age twenty-five to seventy-four, this article provides a comprehensive picture of changes in living alone over the last four decades. Our intersectional approach in tracing the evolution of solo living explicitly acknowledges heterogeneity in the likelihood of living alone by key demographic and socioeconomic characteristics. Moreover, another advantage of looking at each of twenty-five to thirty-four, thirty-five to forty-four, forty-five to fifty-four, fifty-five to sixty-four, and sixty-five to seventy-four age groups every ten years between 1980 and 2019 (treating 2019 as if 2020) is that we are able to better address the change in living alone over the life course by constructing a synthetic cohort born between 1946 and 1955, whose likelihood of living alone can be traced every ten years from ages twenty-five to thirty-four through sixty-five to seventy-four.
In understanding life-course variation in living alone, we explicitly consider the role of changing marital status over the life course. Given that most married people live with their spouses (and thus not alone), life-course events such as marriage, divorce, widowhood, and singlehood (never married) have direct implications for the prevalence of solo living. In the early twenties and thirties, when many young adults still remain unmarried, the share of individuals living alone can be relatively high. Then, as young adults make the transition to form a new family through marriage and cohabitation, the share of solo living may decline in the thirties and forties before rising again with increased divorce and widowhood in later ages. However, this scenario of changing prevalence of living alone across the life course should not be generalized to all groups. Because life-course events related to marital status occur in varying timings and degrees for different groups, the patterns of solo living across the life course and time trends therein likely vary by gender, race, and education among others.
CHANGING MARITAL STATUS AND LIVING ALONE
Changes in the marriage rate should be closely related to the trend in living alone. The rise of unmarried individuals who are separated, divorced, widowed, or never married likely indicates the increase in the share of population living alone, ceteris paribus. In this article, we address the influence of changing marital status in documenting the trend in living alone (for cross-national comparisons, see Esteve et al. 2020). The prevalent narrative in media and public discussions suggests that the decrease in marriage rates among young adults necessarily corresponds to an increase in the proportion of individuals living alone, of which evidence is often drawn from the trend of rising one-person households (Pandey 2023; USA Facts 2023). This presumed linkage between declining marriage rates and increasing solo living is reinforced in the context of growing academic literature showing that the transition to adulthood, including the transition to first marriage, in the United States takes much longer today than in the past (Furstenberg 2010; Shanahan 2000). The trend indicates an increase in the proportion of unmarried young adults in their twenties and thirties, potentially leading to a higher prevalence of individuals living alone within this demographic, assuming that other factors like living with parents remain stable.
However, the trend in the share of nonmarried individuals is not enough to predict the change in the prevalence of living alone. The likelihood of living alone among nonmarried individuals can decline rather than increase over time to the extent to which it offsets the increase in the share of nonmarried individuals. Not all nonmarried individuals live alone but some live with parents (for young adults), adult children (for the elderly), relatives, and even roommates. In fact, the rising share of young adults living with parents and perhaps with roommates partially because of increasing rent and housing prices suggests that the share of young adults living alone might not have necessarily increased despite the increased proportion of young adults who delay or avoid marriage (Davis 2023; Fry, Passel, and Cohn 2020). Another relevant trend is the increase of young adults living with unmarried partners (Gurrentz 2018). Of course, cohabitation and roommates may not account for the large part of living arrangements among older groups. However, we recognize that demographic trends in those and other arrangements among nonmarried adults are relevant to understanding the trend in living alone for the older groups as well. Therefore, we pay attention to assessing the trend in the relationship between marital status (especially being nonmarried) and living alone. Although some studies control for marital status (Reher and Requena 2020) or adjust the proportion of those living alone with consideration of marital status (Esteve et al. 2020), they are still limited in assessing how both the changing composition of marital status and the varying likelihood of living alone within each type of marital status contribute to the trend in living alone in the entire group of a specific age range.
Moreover, because younger and older age groups differ in the composition of marital status and its change over time, it is necessary to examine the connection between changing marital status and the trend in living alone separately by age groups. Therefore, in the results section we discuss changes in the composition of marital status and in the relationship between marital status and living alone for different age groups. Among many age groups, our discussion focuses on two: the youngest (twenty-five to thirty-four) and the oldest (sixty-five to seventy-four). The purpose of this description is to illustrate potential implications of changing marital status and relationship between living alone and marital status for understanding the change in the prevalence of solo living. Our results presented below will reveal that despite the popular discourse of the presumably increased rate of living alone (likely originated from the conventional view of the trend in one-person households), the proportion of individuals living alone has not changed much for most groups—combinations of education, age, gender, and race. An exception is the group of older men, especially the oldest, regardless of race and education, who show a substantial increase. The limited change in the proportion of individuals living alone for most groups is in part due to either the decline in the likelihood of living alone among the expanded group of nonmarried individuals or the decline (or persistence) in the proportion of nonmarried people.
DATA AND METHODS
We use data from the decennial census between 1980 and 2000 and the American Community Survey one-year samples in 2010 and 2019, which collect a variety of information on individuals and households. Harmonized microdata across years were accessed from the IPUMS USA database (Ruggles et al. 2022). Data from the 2020 ACS was excluded from the analysis because of concerns regarding COVID-related data collection issues. The analytic sample of this study was restricted to non-Hispanic black and white Americans between twenty-five and seventy-four in each survey year.
Hispanic and Asian groups were not examined given their changing characteristics related to immigration over the period, which may have some implications for changing prevalence of solo living. We also did not include other racial and multiracial groups because of the sample size. The age range of twenty-five to seventy-four was selected because by age twenty-five many people would not be enrolled in school and by age seventy-five most people would still wield some degrees of autonomy over deciding whether to live alone. The selection of the age range was also related to our decision to exclude those residing in institutional and non-institutional group quarters such as college dormitories, residential treatment centers, nursing facilities, group homes, military barracks, and prisons (Stempowski and Christy 2021). We did not separate native-born and foreign-born individuals within each race because the share of foreign-born population is relatively small within each of the black and white populations (Ho, Park, and Kao 2022). The final sample for the analysis consists of about 6.8 million individuals across the 1980, 1990, and 2000 decennial censuses and the 2010 and 2019 ACS.
The key outcome variable in the study is living alone status. This was determined by measurement of the number of people recorded in a household (NUMPREC) available in the census and the ACS. If the number of people recorded in the same household was equal to one, respondents were coded as living alone.2 This operationalization of living alone is consistent with that of previous studies (Reher and Requena 2020). We compare the share of those who live alone across five demographic characteristics of individuals: gender, race, age, and education. Within each gender (men and women) and race (black and white) combination, we assess the share of individuals who live alone across five ten-year age groups: twenty-five to thirty-four, thirty-five to forty-four, forty-five to fifty-four, fifty-five to sixty-four, and sixty-five to seventy-four. The construction of ten-year age groups reflects the decennial census and ACS surveyed in 2010. Although the most recent ACS used in our analysis was conducted in 2019, we treated it as if it were conducted in 2020 for convenience of ten-year gaps between two adjacent surveys. Within each gender, race, and age group, we distinguished three educational groups—high school or less, some college (one to three years), a bachelor’s degree or higher (four or more years). In sum, our analysis of living alone is more comprehensive than most studies to date because we simultaneously consider multiple factors: age (five groups), year (five time points), race (two groups), gender (two groups), and education (three groups). Table 1 presents the number of individuals and their weighted proportions in each category of year, age, education, and race for men and women, respectively.
Sample Sizes and Weighted Proportions by Gender
Methods
Using data pooled across three key independent variables (education, age, year) in each of four race-gender combinations (black men, white men, black women, and white women), we run the following logistic regression model to predict the log odds of living alone by education, age, year, two-way interactions between education and year, between education and age, and between year and age, and three-way interactions among education, year and age:
CHANGING DISTRIBUTIONS OF MARITAL STATUS AND IMPLICATIONS FOR LIVING ALONE
As emphasized, we examine how the share of nonmarried people in each age, race, and gender gap has changed across years in relation to the trend in living alone. In this section, we describe changes in the distribution of marital status and in the likelihood of solo living among nonmarried people, highlighting their implications for changes in the share of people living alone. Instead of repeating the same discussion across all age groups, we focus on the youngest and oldest groups.
Youngest Age Group
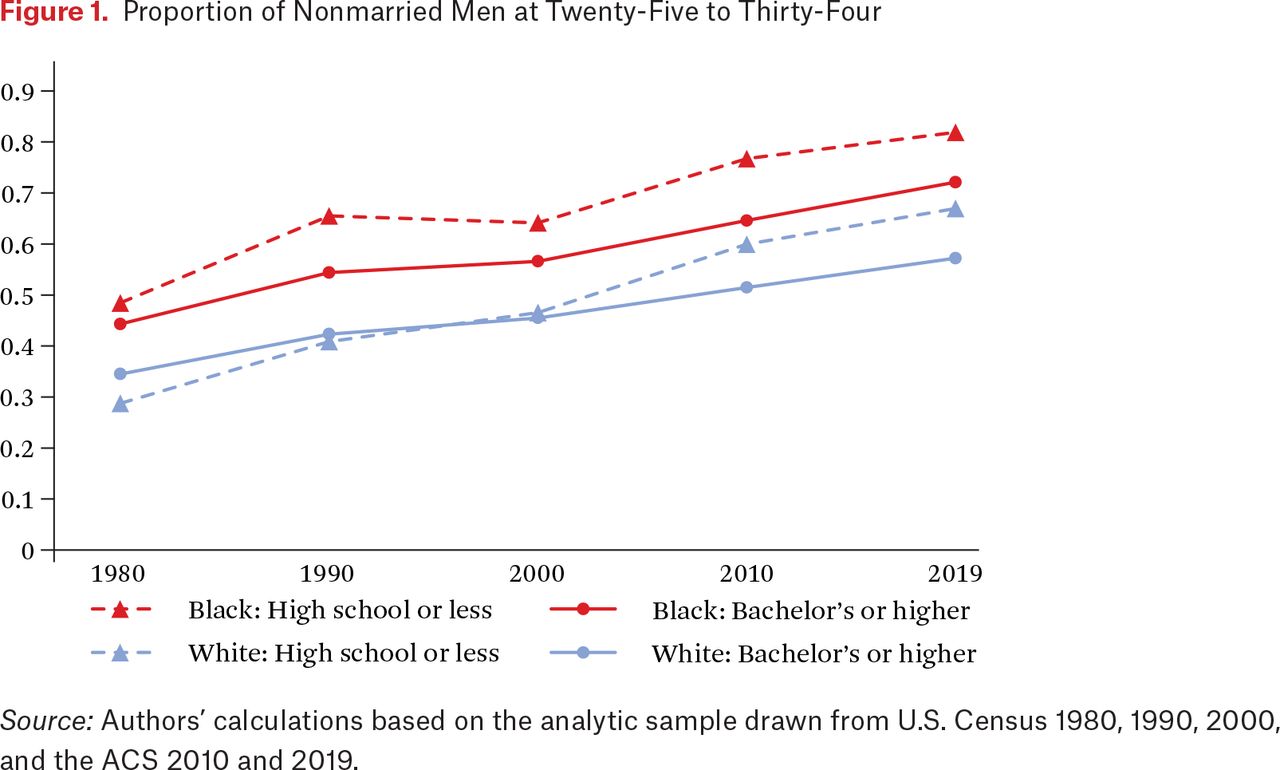
Figure 1 presents changes across years in the proportion of nonmarried men, which include those separated, divorced, widowed, and never married. For the sake of visualization, we present the trends only for those in the lowest and highest levels of education, omitting those with some college education. The share of nonmarried men in the twenty-five to thirty-four age group has increased over four decades from 48 to 82 percent for black men without college education, from 44 to 72 percent for black men with a bachelor’s degree or higher, from 29 to 67 percent for white men without college education, and from 35 to 57 percent for white men with a bachelor’s degree or higher. Regardless of race and education, this increase in the share of nonmarried men in the age group twenty-five to thirty-four is primarily due to the increase in the share of never-married men. The proportion of widowed men in this age group is negligible, while the proportion of divorced men has decreased across years.

Proportion of Nonmarried Men at Twenty-Five to Thirty-Four
Source: Authors’ calculations based on the analytic sample drawn from U.S. Census 1980, 1990, 2000, and the ACS 2010 and 2019.
However, the proportion of men living solo among those who are not married has substantially declined. Our own calculation based on the census and ACS data reveals that, in 1980, 45 and 47 percent of nonmarried black and white men with a bachelor’s degree or higher in the age group lived alone, respectively. Four decades later, only 25 percent and 28 percent did. The decline across years is also substantial for non-college-educated men. Given that the majority of nonmarried men in this age group are never-married men, this trend is mainly due to the decline in the proportion of those living alone among never-married men. As discussed, the declining rate of living alone among nonmarried men age twenty-five to thirty-four may reflect several changes such as the increase in the share of young adults living with parents and perhaps with roommates as well as those living with unmarried partners (Davis 2023; Fry, Passel, and Cohn 2020; Gurrentz 2018). The rising trend of coresidence with parents among young adults is well documented elsewhere (Fry et al. 2020). It is somewhat challenging to estimate prevalence of young adults living with roommates consistently across census and ACS years given the change in the categories for the relationships to household head. Using our data, we calculated the share of those living with a roommate among the twenty-five- to thirty-four-year-olds, based on the category of housemate-roommate, which is available for 1990 Census and afterward. The overall proportion of those living with a roommate among the entire cohort has increased more or less for both genders and races, but particularly among black and white men, who showed an increase from 5 and 6 percent in 1990 to 9 and 10 percent in 2019, respectively. However, the proportion of those living with a roommate among nonmarried individuals has increased over the same period only by 1 to 2 percentage points for men and remained constant for women. The census and ACS data are not ideal to measure prevalence of cohabitation. Using the category of unmarried partner in 1990 through 2019, we estimated the share of nonmarried men and women age twenty-five to thirty-four living with an unmarried partner. The proportion has increased between 1990 and 2019 for both genders and races, noticeably among white men and women with a bachelor’s degree or higher. In 1990, 11 and 13 percent of nonmarried white men and women with bachelor’s degrees or higher, respectively, lived with an unmarried partner; in 2019, 23 and 28 percent did.
It is beyond the scope of this article to assess the causes of the declining proportion of never-married men who live alone. Whatever the reasons, however, this trend may wield force against the trend of the rising share of nonmarried men, hardly affecting the change across years in the proportion of young men who live alone in this twenty-five to thirty-four age group.
Young women aged twenty-five to thirty-four show a similar pattern of the rise in the proportion of nonmarried women. As presented in figure 2, 56 and 49 percent of black women in the two educational groups, respectively, were not married in 1980. Four decades later, the proportion of nonmarried black women has increased to 83 and 74 percent. White women also show an increase in the share of nonmarried women, although the degree of increase among those with a bachelor’s degree or higher is relatively modest. Similar to the pattern for twenty-five- to thirty-four-year-old men, the increase in the share of nonmarried women in this age group is primarily driven by the increase in the share of never-married women.

Proportion of Nonmarried Women at Twenty-Five to Thirty-Four
Source: Authors’ calculations based on the analytic sample drawn from U.S. Census 1980, 1990, 2000, and the ACS 2010 and 2019.
However, the proportion of those living alone among nonmarried women has declined across the years, again similar to the pattern for men in the same age group. According to our estimates with the census and ACS data, 35 and 45 percent of nonmarried four-year-college-educated black and white women, respectively, lived alone in 1980. Four decades later, the corresponding percentage declined to 25 percent for both. White women without college education also show a decline in the proportion of living alone among nonmarried from 16 to 7 percent over this period. In 1980, only 7 percent of nonmarried black women without college education lived alone. This low prevalence has slightly increased to 10 percent in 2019. Along with the decline in the proportion of those living alone among nonmarried women, it remains to be seen how the rising share of nonmarried women has affected the trend in living alone among twenty-five- to thirty-four-year-old women.
The Oldest Age Group
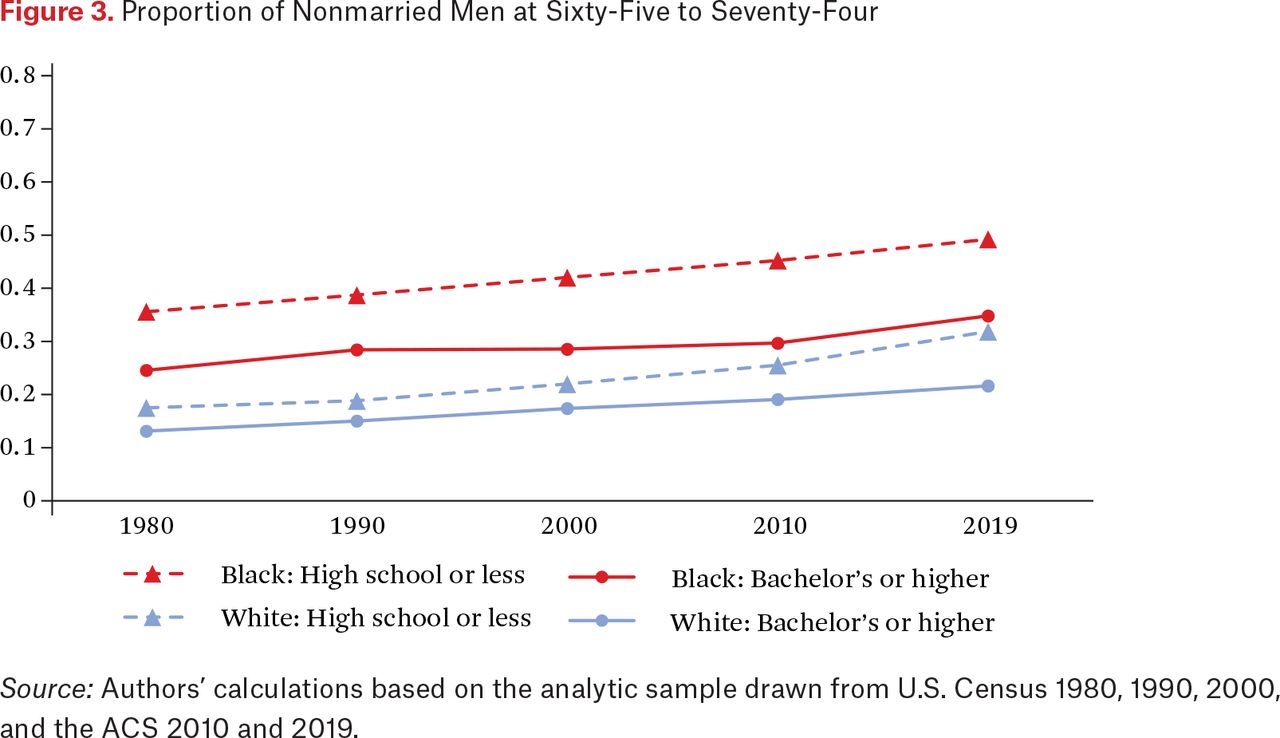
Figure 3 presents the proportion of men aged sixty-five to seventy-four who are not currently married. In 1980, 36 percent of black men in that age group with high school or less education were not married. This share continued to increase to 49 percent in 2019. The trend toward the increased share of nonmarried men is similar for four-year-college-educated black men as well as among white men for both educational groups. Although not presented in the figure, this increase is primarily due to the increase in the share of divorced (or separated) men and also of never-married men especially for black men.

Proportion of Nonmarried Men at Sixty-Five to Seventy-Four
Source: Authors’ calculations based on the analytic sample drawn from U.S. Census 1980, 1990, 2000, and the ACS 2010 and 2019.
The rising share of nonmarried men is combined with a limited change across years in the proportion of individuals living alone among nonmarried black and white men aged sixty-five to seventy-four. The share of those living with an unmarried partner among the nonmarried generally increased between 1990 and 2019. However, the proportion is small—9 percent for black men, 12 percent for white men, 3 percent for black women, and 6 percent for white women in 2019. The share of those living with a roommate among the nonmarried is even smaller, though it too has increased over time—about 6 percent for men of both races and 3 percent for women of both races. Our estimates show that the proportion of living alone among nonmarried men in this age group has declined by only 3 and 5 percentage points for white men with a bachelor’s degree or higher and with high school or less education, respectively. The proportion has increased only by 7 and 3 percentage points for black men. The increased share of nonmarried men without much change in the proportion of living alone among them should result in the rising share of men living alone in the oldest age group for both educational groups and for both races.
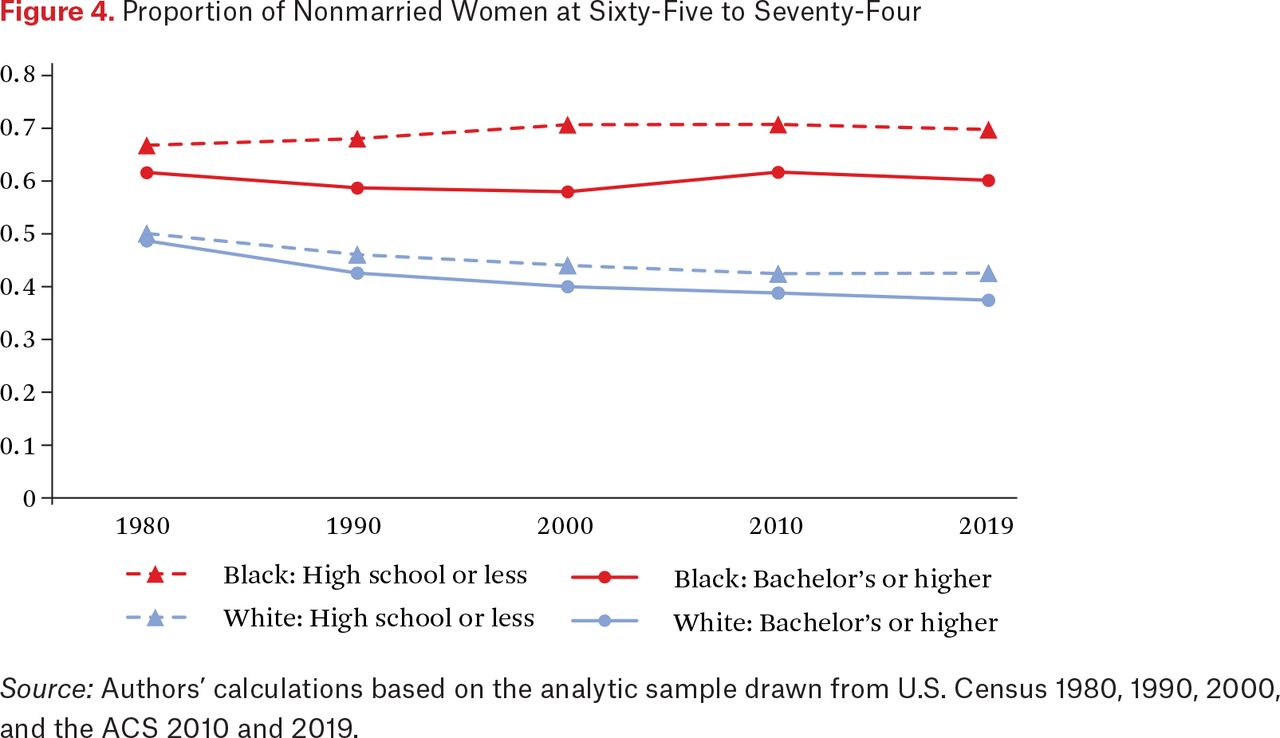
Turning to women aged sixty-five to seventy-four, shown in figure 4, we see the different trends in the proportion of nonmarried women in the age group. Black women regardless of educational group do not show a substantial change over time, whereas white women show a decline in the proportion of nonmarried women. This constant or declining trend is the result of two opposite directions of changes: the relative share of divorced women has increased and that of widowed women has decreased. According to our estimates, moreover, the proportion of living alone among nonmarried women in the age group has hardly changed across years save for a decline among white women without college education. No change in the proportion of nonmarried black women of both educational groups, combined with no change in the proportion of those living alone, suggests no substantial change across years. Reduction across years in the proportion of nonmarried white women with a bachelor’s degree or higher, combined with the constant proportion of living alone suggests a decline in the proportion of four-year-college-educated white women who live alone. The share of nonmarried has declined among white women without college education, and the proportion of living alone among nonmarried women has also declined, indicating a decline in the share of living alone among white women without college education.

Proportion of Nonmarried Women at Sixty-Five to Seventy-Four
Source: Authors’ calculations based on the analytic sample drawn from U.S. Census 1980, 1990, 2000, and the ACS 2010 and 2019.
RESULTS: LOGISTIC REGRESSION
We first discuss the result of the logistic regression model that predicts log odds of living alone by education, age, and year; two-way interactions between two of education, age, and year; and three-way interactions among education, age, and year. Equation (1) specifies the model that has a total of seventy-four coefficients of independent variables to be estimated, besides an intercept. Table A.1 presents the coefficients and standard errors of each independent variable in the logistic regression model for each of four gender-race groups: black and white men and black and white women. Because the three independent variables are categorical, the model—which includes all the two-way and three-way interactions—should reproduce the observed percentages of those living alone in each combination of education, age, and year. However, an advantage of the logistic regression model is to obtain standard errors of the (predicted) percentages. As the model has many interaction terms and interpretation of those interaction coefficients is not straightforward, we present the predicted probabilities of living alone for those with each level of education in each age group and each year, based on the logistic regression. We provide 95 percent confidence intervals of each predicted probability as well. To increase readability of the figures, we display the predicted probabilities only of those at both ends of the educational hierarchy, omitting the middle group (that is, some college).
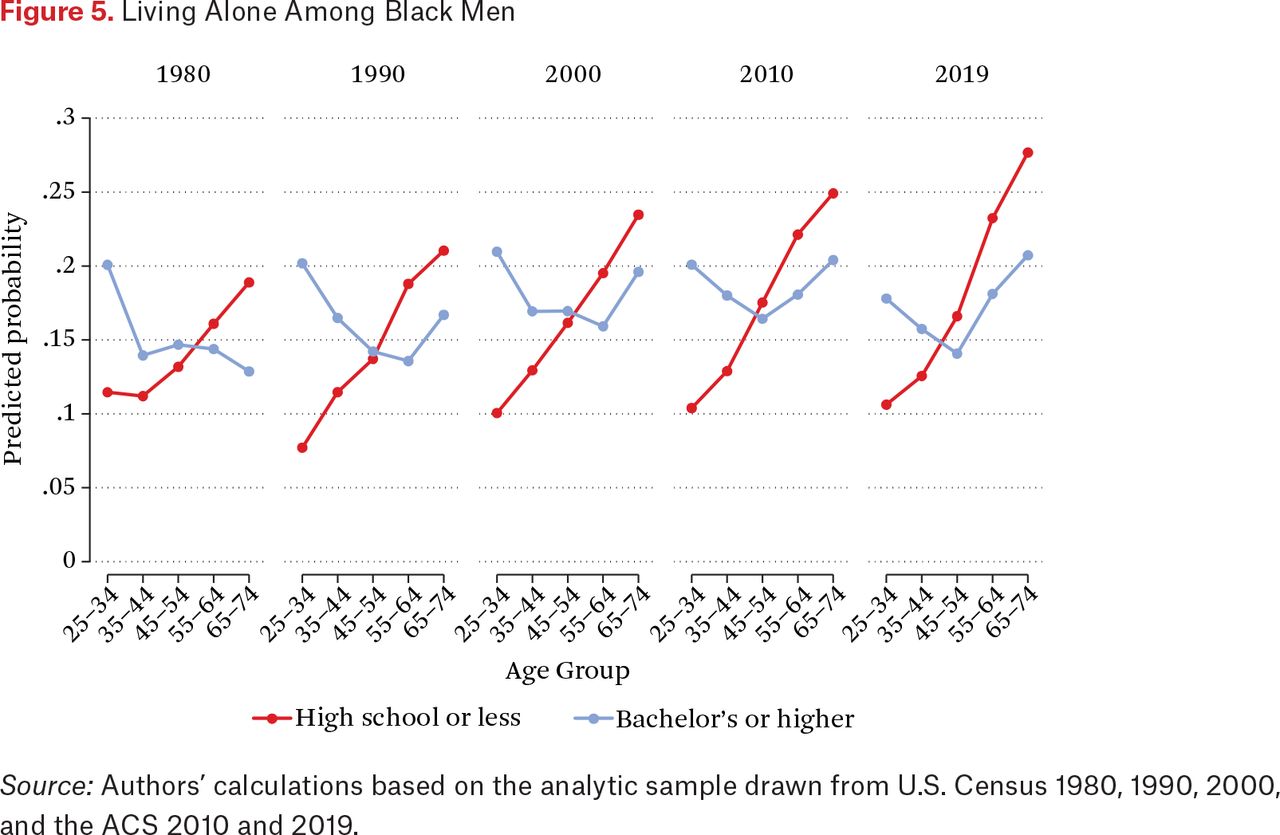
Figures 5 and 6 show the predicted probabilities of black men and white men living alone at each age range in each census or ACS year. In figure 5, the probability of solo living linearly increases across age groups within each year among black men with high school or less education. Specifically, in 2019 about 11 percent of black men with high school or less education lived alone in the twenty-five to thirty-four age group; the corresponding share increases to 13 percent (thirty-five to forty-four), 17 percent (forty-five to fifty-four), 23 percent (fifty-five to sixty-four), and 28 percent (sixty-five to seventy-four). Moreover, the difference in the share of solo living between the youngest and the oldest groups has grown across years, due to the more rapid increase in living alone across years among the oldest. Only 19 percent of sixty-five- to seventy-four-year-old black men without college education lived alone in 1980 but 28 percent did four decades later. Meanwhile, the share of solo living among the youngest black men without college education did not increase at all.

Living Alone Among Black Men
Source: Authors’ calculations based on the analytic sample drawn from U.S. Census 1980, 1990, 2000, and the ACS 2010 and 2019.

Living Alone Among White Men
Source: Authors’ calculations based on the analytic sample drawn from U.S. Census 1980, 1990, 2000, and the ACS 2010 and 2019.
The increase in the proportion of those living alone among the oldest black men without college education was expected in our earlier discussion about the increased share of nonmarried men across years in this group along with a slight increase in the probability of living alone among those nonmarried men (figure 3). We also highlighted the declining probability of living alone among nonmarried men in the youngest age group, which potentially could offset the increased proportion of those who are not married across years (figure 1). The result of these two contrasting trends is no substantial change in the proportion of twenty-five- to thirty-four-year-old black men without college education who live alone, contributing to the growing age gap across years in the proportion of people living alone.
However, black men with a bachelor’s degree or higher show a different pattern: no linear increase in the likelihood of living alone by age within a specific year, that is, older individuals are more likely to live alone than younger. The predicted probability of living alone was highest among the youngest until 2000, after which it was highest among the oldest. Except for 1980, the age pattern of living alone is a V shape: the share is highest at both ends of the age groups but lowest at the middle. Only 13 percent of sixty-five to seventy-four-year-old black men with a bachelor’s degree or higher lived alone in 1980, but four decades later 21 percent did. This trend was expected from our earlier discussion in figure 3 about the rising share of the oldest black men, both college educated and not college educated, who are not married, combined with only a slight increase in the probability of living alone across years among those who are not married. Meanwhile, the share of people living alone among the youngest age groups has hardly changed. In figure 1, the youngest black men with a bachelor’s degree or higher also showed an increase in the proportion not married. However, the probability of living alone among nonmarried men has declined across years. In the result, as shown in figure 5, the proportion of those living alone in this age-education group has not changed much.
With respect to the educational gap in the share of solo living, at younger ages, four-year-college-educated black men are more likely to live alone than their counterparts with high school or less education. This educational gap disappears at the middle age brackets and then reverses at older ages, resulting in the oldest men without college education being more likely to live alone than their college-educated counterparts. This changing relationship across age groups suggests how the nature of solo living varies across the life course. Perhaps living alone at younger ages is a living arrangement young adults prefer, whereas at older ages those without resources are pushed out to live alone.
Turning to figure 6, white men show age patterns by education similar to those of black men. The share of those living alone tends to increase across ages among white men without college education, whereas the age pattern among those with a bachelor’s degree or higher becomes increasingly V-shaped. The relationship between education and living alone is positive at young ages but negative at older ages. This reverse pattern over the life course has become more evident in recent years among white men. Also, relative to figure 5 for black men, figure 6 shows that overall white men are less likely to live alone.
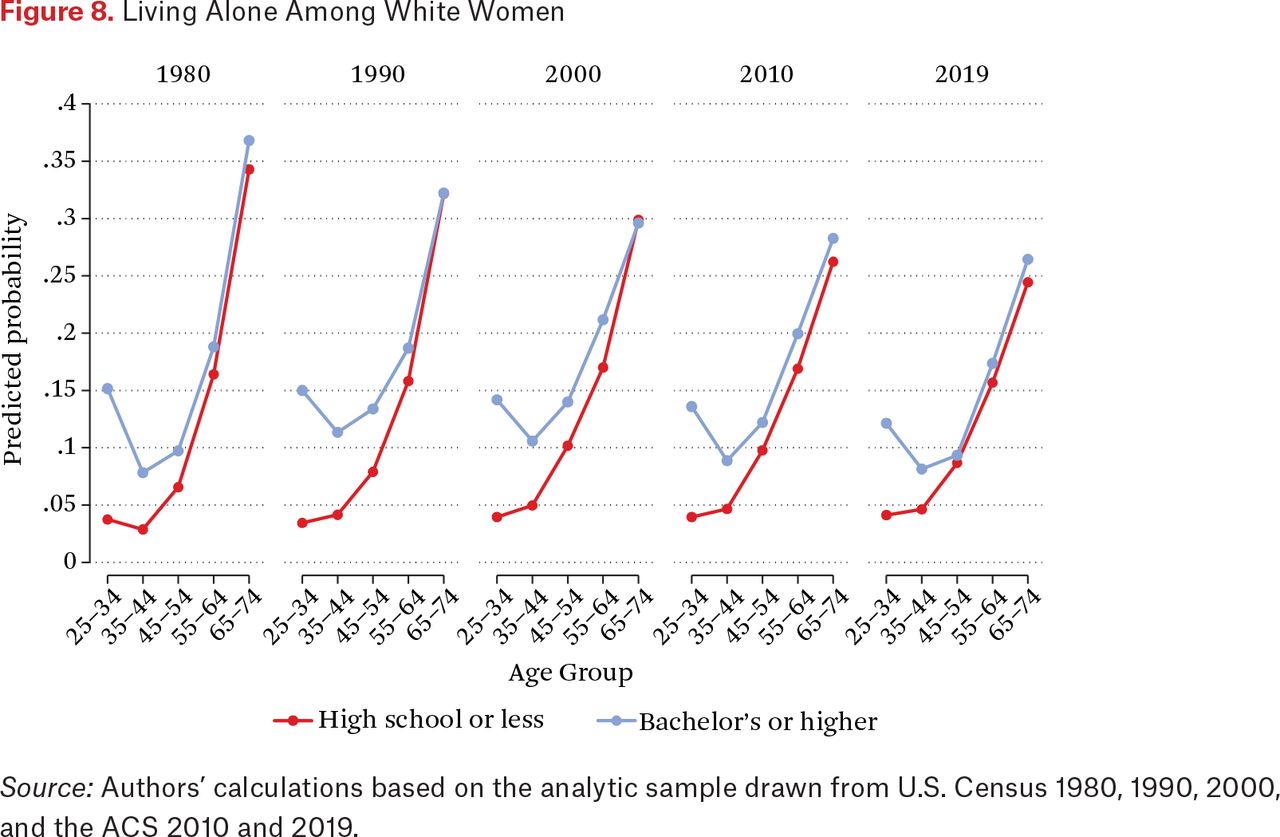
In figure 7, the share of not college-educated black women living alone increases sharply across ages after a modest increase between twenty-five to thirty-four and thirty-five to forty-four. The linear increase is observed every year. However, in contrast to what is observed among men, the gap in the proportion between the youngest and oldest age groups has not changed much over time. The corresponding age gap among white women without college education even decreased due to the decline across years in the share of solo living among the oldest white women (figure 8). In our earlier discussion, we found the decline in the proportion of those who are not married among white women without college education in the oldest age group (see figure 4).

Living Alone Among Black Women
Source: Authors’ calculations based on the analytic sample drawn from U.S. Census 1980, 1990, 2000, and the ACS 2010 and 2019.

Living Alone Among White Women
Source: Authors’ calculations based on the analytic sample drawn from U.S. Census 1980, 1990, 2000, and the ACS 2010 and 2019.
Women with a bachelor’s degree or higher show a tilted J-shaped pattern: the share among twenty-five- to thirty-four-year-olds is higher than the share among the next two age groups (thirty-five to forty-four and forty-five to fifty-four) from which the proportion of living alone increases linearly until the oldest age group. Relative to among men, the share of solo living among the youngest age group does not reach the same level among the oldest. Another gender difference is that educational differences in living alone among older age groups are not substantial, but among the two youngest age groups are relatively large. Therefore, in contrast to the clear evidence of educational crossover across ages, the gap in living alone converges but is not quite reversed at older ages. Finally, race differences in the age-education pattern and also the overall level of living alone are much less among women than race differences among men.
LIFE-COURSE CHANGES IN LIVING ALONE OF THOSE BORN BETWEEN 1946 AND 1955
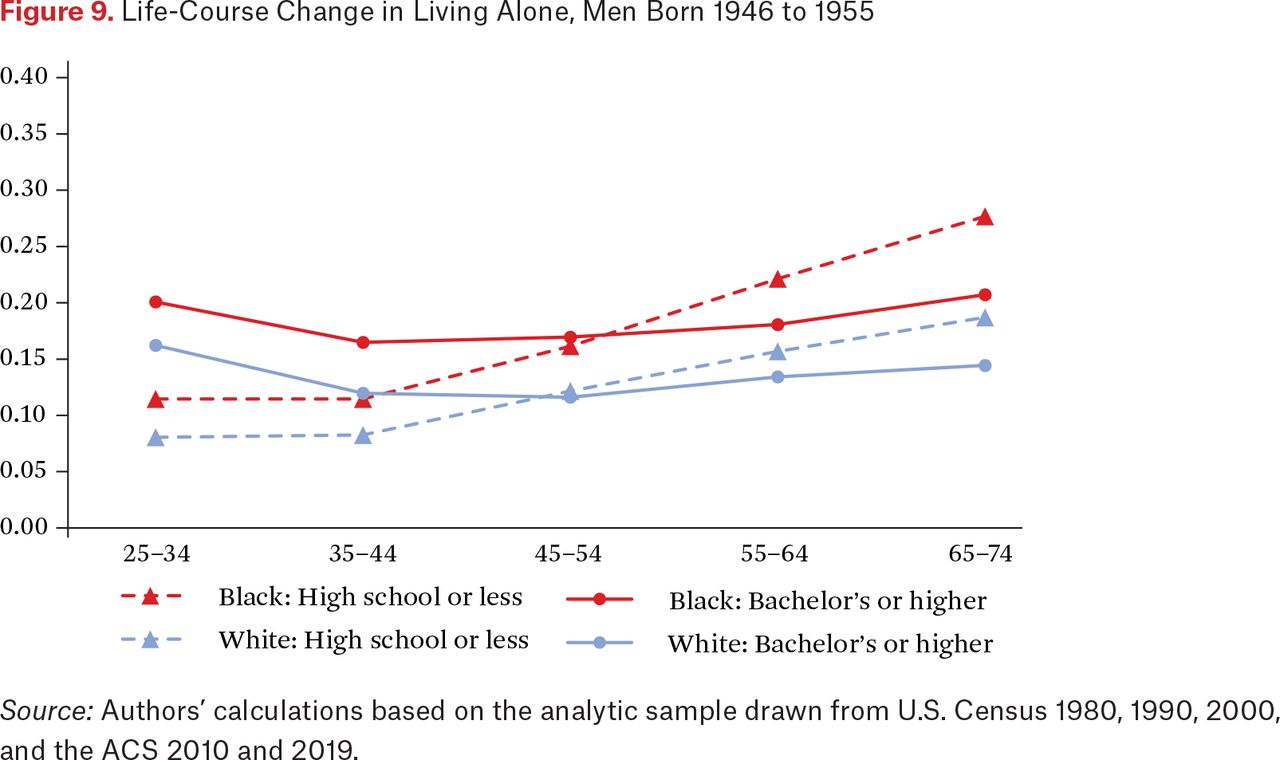
For those born between 1946 and 1955, we can estimate the share of those living alone when they were at ages twenty-five to thirty-four from the 1980 Census, at thirty-five to forty-four from the 1990 Census, at forty-five to fifty-four from the 2000 Census, at fifty-five to sixty-four from the 2010 ACS, and sixty-five to seventy-four from the 2019 ACS (although the 2019 ACS is not exactly ten years from the 2010 ACS, we treat it as if it is the 2020 ACS). In short, we can address how U.S. men and women change the likelihood of living alone over their life course from ages twenty-five through thirty-four to sixty-five through seventy-four for a specific birth cohort born between 1946 and 1955. We can also estimate living alone across the life course for the birth cohort of 1956 to 1965 from twenty-five to thirty-four in 1990 to fifty-five to sixty-four in 2019 (and for other cohorts with varying age ranges). Our preliminary analysis indicated that life course changes in living alone show similar patterns across cohorts. Therefore, we present life-course changes in living alone for the 1946 to 1954 cohort as an illustration.
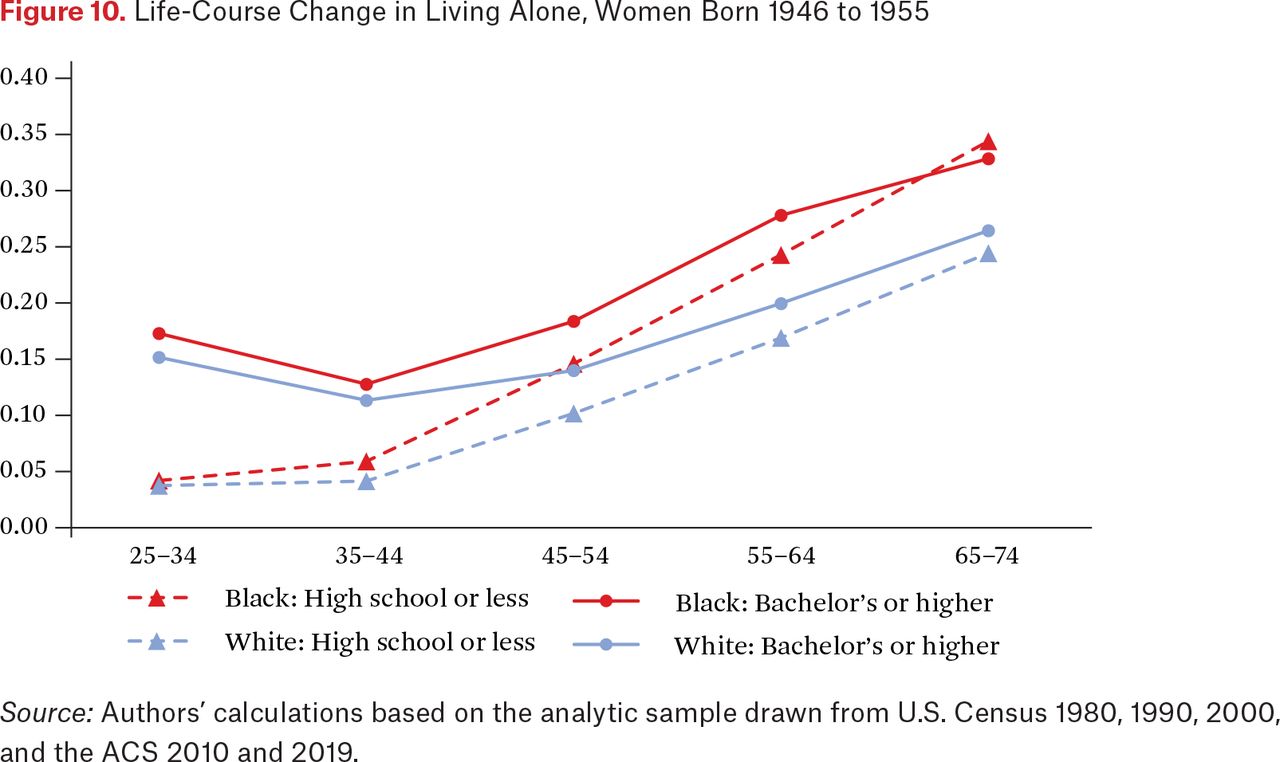
Figure 9 shows changing proportions of those living alone among black and white men with two different levels of education. Figure 10 shows the corresponding changes for black and white women. For both black and white men born between 1946 and 1955, the educational crossover in living alone occurred between the ages of forty-five and fifty-four. Men with high school or less education show a continued increase in the share of those living alone as they get older, whereas men with a bachelor’s degree or higher do not show much change over the life course after a slight decline between twenty-five to thirty-four and thirty-five and forty-four (if any, the pattern is close a V shape, as discussed). This kind of educational crossover is not evident among women of the same birth cohort. Among white women, the increase across age groups in the share of those living alone is more substantial among those with high school or less education than their more-educated counterparts, resulting in convergence in the gap in living alone. However, the educational crossover is not observed even in the oldest age group. The pattern for black women is similar to that for white women, except that we can see the educational crossover in the oldest age group.

Life-Course Change in Living Alone, Men Born 1946 to 1955

Life-Course Change in Living Alone, Women Born 1946 to 1955
Source: Authors’ calculations based on the analytic sample drawn from U.S. Census 1980, 1990, 2000, and the ACS 2010 and 2019.
CONCLUSION
Our investigation of changes over time in the likelihood of living alone by education, age, gender, and race reveals an empirical finding that has not been recognized by both scholarly and public attention to the trend in living alone. Despite the growing public and media attention to the potential rise of solo living, the likelihood of living alone has not changed much over the last four decades for most groups. Both men and women, regardless of education and race, in the youngest age group do not show any substantial change in the proportion of those who live alone. Although the share of nonmarried (particularly never-married) men and women in this age group has increased, the share of those who live alone among nonmarried men and women has declined, offsetting the increase in the share of nonmarried individuals in the age group. Black women of both educational groups in the oldest age bracket do not show any evident trend in living alone either. The share of nonmarried individuals among the oldest black women has hardly changed across years. Moreover, the proportion of those who live alone among nonmarried black women in the oldest age group has not changed much. White women of both educational groups in the oldest age bracket actually show a decline in the share of those who live alone. White women in the oldest age group show a decline across years in the share of nonmarried individuals as well as in the share of those who live alone among nonmarried individuals, especially among white women without college education.
A clear exception against this constant or declining trend in living alone is the increased share of the older, especially the oldest (age sixty-five to seventy-four) men who live alone across years, both races and both educational groups. If there is any group that fits well to the media’s concern for the rise of solo living, it is the group of the oldest men. This group of men shows an increase across years in the share of those who are not married, particularly those who are divorced (and also who are never married for black men). The share of those living alone among nonmarried men has not changed much across years. The evidence that the increased trend in living alone is observed only for the older men offers a useful insight for social policy efforts to address the needs of those who live alone. However, older women are still more likely to live alone than older men. Therefore, public and scholarly concerns for older people living alone should not be restricted to one gender.
The finding of different trends in living alone across age groups was possible because this study investigated solo living across the entire life course (except for those seventy-five or older), unlike many studies that focus on a particular age group (Chaloupková 2023; Reher and Requena 2020; Sandström and Karlsson 2019). This long life-course perspective, moreover, explicitly considered the relevance of another life-course factor—marital status in explaining change or no change across years in the share of those who live alone. Specifically, we examined the changes in the share of those who are not married and the probability of solo living among those who are not married. Based on the two trends, we were able to anticipate in advance the trends in living alone in both youngest and oldest age groups, which were confirmed with the empirical analysis. Although it is not the main interest of the current study, future research may conduct a formal analysis to quantify the extent to which the changes in the share of solo living between 1980 and 2019 (or any two other time points) are attributable to the changes in the composition of marital status and the rate of living alone among each type of marital status (see Christenson and Hermalin 1991 for an illustration applied to elderly living arrangements).
Another noticeable finding from our study is the educational crossover in men’s solo living over the life course. At younger ages, men with a bachelor’s degree or higher are more likely to live alone than their counterparts without college education. Although not all independent households refer to solo living, some existing studies have shown that young adults with more education tend to show a higher likelihood of establishing an independent household than their counterparts with less education (Ho, Park, and Kao 2022). However, at older ages, the relationship is reversed: men without college education are more likely to live alone than their more-educated counterparts at older ages. This age-variation pattern suggests that men with more socioeconomic resources are better able to afford solo living at younger ages but men with fewer resources are more likely to live alone not by their choices at older ages. In other words, the nature of solo living seems to depend on the life stage. This finding again confirms the need for social policy efforts to understand the life-course specific nature of solo living in order to adequately address the needs of those who live alone. However, the story becomes even more complicated given the gender difference in the pattern. Although the educational gap in solo living mostly disappears in older age groups, the crossover is not observed among women.
Because the main purpose of this study is to document the trends in living alone by age, gender, race, and education, we did not pay much attention to potential moderating variables. For instance, prevalence of solo living and its relationship with education may differ between rural and urban areas reflecting rural-urban differences in availability of housing units for single persons and housing costs (Henning-Smith, Schroeder, and Tuttle 2020). The Census Bureau definition of urbanicity varies by year but generally refers to all cities and places that have at least 2,500 people, which increased to at least five thousand in the 2020 Census (IPUMS USA, n.d.). Our supplementary analyses separately for rural and urban areas based on the census definition reveal that the major conclusions drawn from our study without distinction between rural and urban areas are generally valid in both areas. Given that 90 percent of blacks and 81 percent of whites in our sample across all years lived in urban areas, the patterns presented here are primarily urban. Although the overall level of solo living is lower in rural areas than in urban, the variations by age, year, education, gender, and race seen in figure 4 are similarly observed in rural areas as well (results not shown).
We acknowledge limitations of our study, especially in our inability to link the trends in living alone with other relevant trends over the last few decades. For instance, studies show an increased risk of institutionalization for older people who live alone (Gaugler et al. 2007; Pimouguet et al. 2016). Therefore, we expect that changes in the overall level of institutionalization and in the relationship between institutionalization and individuals’ socioeconomic characteristics should be relevant for the trend in living alone among the elderly. Similarly, evidence for the relationship between living alone and mortality suggests that recognizing the trend in mortality and its socioeconomic variation should be helpful to understanding the change in prevalence of living alone and its socioeconomic differences, especially among the elderly (Abell and Steptoe 2021; Pimouguet et al. 2016). However, the complicated relationships among living alone, institutionalization, and mortality among the elderly prevent us from addressing the issue here. Future research should pay more attention to analyzing the trends in living alone in tandem with historical changes of other relevant contexts.
Appendix
The Results of Logistic Regression Model Predicting the Log Odds of Living Alone
FOOTNOTES
- © 2025 Russell Sage Foundation. Park, Hyunjoon, Matthew Sheen, and Paula Clark. 2025. “Living Alone for Black and White Men and Women over Four Decades, 1980–2019.” RSF: The Russell Sage Foundation Journal of the Social Sciences 11(2): 26–45. https://doi.org/10.7758/RSF.2025.11.2.02. The authors thank participants of the RSF journal conference, held June 8–9, 2023, for their comments and suggestions on the earlier version. They are grateful for Dr. Andrew Taeho Kim’s help for creating figures included in the paper. Direct correspondence to: Hyunjoon Park, at hypark{at}sas.upenn.edu, Department of Sociology, University of Pennsylvania, 3718 Locust Walk, Philadelphia, 19104, United States.
Open Access Policy: RSF: The Russell Sage Foundation Journal of the Social Sciences is an open access journal. This article is published under a Creative Commons Attribution-NonCommercial-NoDerivs 3.0 Unported License.
In this issue


Jump to section
Related Articles
Cited By...
- No citing articles found.