
Abstract
This article traces the history of census undercount and its importance to civil rights. The Constitution mandates a census and calls for Congress to use the results to apportion seats in Congress and the Electoral College. A substantial undercount in the census will misallocate congressional and electoral college votes. More recently, census-derived statistics are used for the geographic allocation of federal and state funds. This linkage of the census count to the distribution of federal and state funds puts the undercount on the radar for states and municipalities. Closely tied to the undercount and becoming a more central issue to the Census Bureau is the difficulties in reaching hard-to-count populations. Is the Census Bureau up to the task? We end our story with a discussion of Detroit’s experience with the 2020 Census, including its unsuccessful challenge to its housing count.
The census is the only federal statistical program mentioned in the Constitution. Every ten years the census enumerates the total population so that this nation will have a democratic government in which each state has political power reflecting its population size. James Madison wanted the first census to be expanded beyond bare enumeration. He wished to collect information about the population so that Congress could be more informed when they enacted laws and spent tax dollars.
From 1790 to 1940, all respondents were asked a series of questions about their demographic and economic status. From 1940 to 2000, a sample of households received a long form that asked such questions; most respondents, however, filled out a short form asking their address, name, race, sex, and age. Since 2001, the collection of detailed information about economic and demographic characteristics has been collected not by the census but by the annual American Community Survey (ACS). The ACS does not enumerate the population. Instead, it gathers data about the characteristics of residents of places whose official population size is ascertained by the decennial census. The current sample size for the annual ACS is about 3.5 million housing units. The population for each place is updated every year by the Census Bureau’s Population Estimates program. Communities use these data for operational purposes by analyzing the characteristics of neighborhoods to deploy programs. Researchers use the data for analyzing social and economic trends, investors and nonprofits to make decisions about where they will locate their facilities. In all cases, the accuracy and completeness of the census enumeration is critical.
Census under- and overcounting is a civil rights issue. If some states are significantly overcounted and others undercounted, some states may be over- or underrepresented in Congress. If areas with many black and Hispanic residents are undercounted while areas with white and Asian residents are overcounted, legislative seats within a state may be erroneously assigned, and federal and state dollars may flow to overcounted areas rather than to the locations that were intended to receive such funds. Although census errors are important, other forces are often more important to civil rights, including gerrymandering and voting rights issues. With the rapidly increasing distribution of federal funds tied to the census counts and characteristics drawn from the ACS, census undercount looms large in importance. Although undercount is a national issue, its impact is often local. We close this article with an illustration of a city that has in the past and most recently challenged the Census Bureau concerning its apparently substantial undercount. This undercount costs the city state and federal monies and diminishes its influence in the state legislature. Thus we end our story with Detroit’s experience with the Census 2020 and its formal challenge to the 2020 housing and population counts.
CENSUS UNDERCOUNT
A perception of undercount in the census is long standing, however exaggerated. For instance, without any evidence, both George Washington and Thomas Jefferson told their European counterparts that the population of the United States in 1790 exceeded four million, not the 3.9 million enumerated in the first census (U.S. Census Bureau 2024). After the 1870 census, the mayors of Indianapolis, New York, and Philadelphia were so upset with their small population counts that they demanded a recount. President Ulysses Grant ordered the Census Office to count those cities a second time (Anderson 2015, 91)—the only time a president ordered a recount.
In the nineteenth and early twentieth century, the census date was June 1 or April 1. In 1920, the census questionnaire included a new question asking farmers about the value of their crops in 1919. The Department of Agriculture had requested that Census 1920 be taken on January 1 because farmers would more likely remember the value of their crops from the previous year. That date was selected but with a curious result. Congress never used Census 1920 data to reapportion congressional and Electoral College seats, the only time that happened. Data from the 1920 Census showed that the country had shifted from majority rural to majority urban and much of the urban population was composed of recent immigrants. Using 1920 data would have shifted seats from rural states to those with rapidly growing urban areas, with their large population of recent Catholic and Jewish immigrants (Prewitt 2017). Congress had already prohibited migration from Asia but in 1924 greatly restricted and almost terminated the flow from eastern and southern Europe by using the relative size of the foreign population in the 1890 Census as the basis for immigration quotas.
CENSUS UNDERCOUNT: DEMOGRAPHERS TO THE RESCUE
The first statistical analysis to measure the extent of undercount was accomplished by demographer Daniel Price (1947), who compared the count of men, age twenty-one to thirty-five who registered with the Selective Service in 1940 to the number enumerated in the 1940 Census. Not only was there a 3.1 percent undercount of these men, but also a differential undercount with black males showing a deficit of 14.8 percent, almost five times the undercount of white males. Another group of demographers illustrated a different method to measure undercount using birth and death registration numbers. Ansley Coale and Mel Zelnick (1963) demonstrated that vital statistics data about births and deaths could be used to assess the completeness of the census count by age, sex, and race. For instance, the 1950 count of children four years old and younger should have been almost the same as number of births in the preceding five years minus deaths to that age group. It was not. Their findings supported what Price had shown: a much greater undercount of blacks than whites.
UNDERCOUNT: WHY IT DIDN’T MATTER
Undercount is never good and differential undercount is worse, but it was not as much of a civil rights issue in the 1940s or even in the 1960s. Why? First, very few blacks in the South were allowed to vote or even register to vote. In 1867, shortly after the Fourteenth Amendment to the Constitution was adopted, 66.9 percent of black men of voting age were registered to vote in Mississippi. This was higher than the comparable percentage for white men of voting age—59.6 percent. By 1892, registration numbers had plummeted for blacks to 5.7 percent, but the number remained virtually unchanged for whites at 56.5 percent (U.S. Commission on Civil Rights 1965, 8). Mississippi was an outlier for the South, but registration numbers for the voting age black population were below 50 percent in eleven southern states in 1956 and remained below 50 percent for all but three—Florida, Tennessee, and Texas, in 1964 (U.S. Commission on Civil Rights 1965, 11).
Differential undercount mattered more when blacks had the right to vote. It took the Voting Rights Act of 1965 for data from the decennial census to make a difference. The Voting Rights Act of 1965 included a preclearance provision in Section 5, inserted because so few blacks were voting in many southern states. Section 5 required states that had prevented blacks from registering to vote or voting to obtain Department of Justice approval when they changed their voting procedures. In 2013, in Shelby County v. Holder the Supreme Court did away with the preclearance requirement.1 The majority opinion asserted that there was no longer a disparity in registration and voting between blacks and whites. In addition, the coverage formula had not been updated and was still based on decades-old data from the 1960s. In Ruth Bader Ginsburg’s vibrant dissent, she famously wrote, “Throwing out preclearance when it has worked and is continuing to work to stop discriminatory changes is like throwing away your umbrella in a rainstorm because you are not getting wet.” In fact, recent research out of the Brennan Center for Justice (Morris and Grange 2024) shows that the black-white voting gap has increased across the United States since 2012. This is especially true in the previously covered jurisdictions. They argue that one explanation for the elimination of the race-specific disparity in registration and voting at the time of Shelby v. Holder was that a black man, Obama, was the presidential candidate.
A second reason undercount was not particularly relevant for civil rights was malapportionment—drawing the boundaries of voting districts so that they have unequal populations. The Compendium of State Legislative Apportionment is a treasure trove that shows the disparities in districts before the Supreme Court intervened (National Municipal League 1962, iii–vi). Congressional district disparities between the most populous and the least populous district were more than two to one in thirteen states in the 1960s. State legislative districts were even worse. In twenty states, it only took 33 percent of the population to control the state house; for the state senate, the number rose to twenty-eight states. This extreme malapportionment gave residents in some areas of a state very much more political influence than those in other areas, a clear example of gerrymandering at work.
Even though the Supreme Court focused on the Tennessee state house in their 1962 Baker v. Carr decision, these differences in population size among voting districts were not just in the South.2 In 1960, in the lower house in Vermont, one district had only twenty-four residents while another had 35,531 (National Municipal League 1962). State senates had equally extreme examples. In California, Los Angeles County with a population of more than six million had the same representation in the state senate as three inland counties, which had a combined population of just over fourteen thousand. So much for the principal of one person, one vote.
Malapportionment was rampant until a series of Supreme Court decisions. The first, Baker v. Carr (1962), concluded that redistricting cases were judiciable based on the equal protection clause of the Fourteenth Amendment. Subsequent cases addressed whether districts would have to have equal populations. Gray v. Sanders (1963) established the famous “one person, one vote” principle for state house districts, by upending the county unit system.3 Wesberry v. Sanders (1964) required that congressional districts be drawn with equal populations.4 Reynolds v. Sims (1964) required that state senate districts be equal in population size using census counts.5 Quoting the Chief Justice Earl Warren, “legislators represent people, not acres or trees.”
These changes to the rules for drawing state senate voting districts were extremely contentious, especially the judgment that state senate districts had to have the same population size. Most but not all states had set up their state legislative maps like the federal system with congressional House seats based on equal populations, whereas every state gets two senators regardless of its population. Some states used the rationale that specific areas in their state should have representation in Congress and the state legislature regardless of their population size. Congress, led by Senator Everett Dirksen (U.S. News and World Report 1967) labored to pass a constitutional amendment to overturn the rule for drawing of state senate districts. After congressional efforts failed, energy went to overturning this decision via a constitutional convention (Smith 2014). The quest for a Constitutional Convention almost came to fruition with 33 states voting for it—just one shy of the two-thirds majority needed. However, this may be overstating the close call as some of the states that voted in favor of the convention were voting before their new per capita state legislative maps had been drawn.
A final reason undercount was not a civil rights issue at this time was that federal dollars did not really flow to states and municipalities based on the census count until the 1980s. We discuss this issue later.
LITIGATION OF UNDERCOUNT
Next, we turn to Supreme Court cases that address whether adjusted counts would be produced by the Census Bureau and whether these could be used for apportionment and redistricting. Although these are old cases, the issue of the difficulties of fully enumerating the hard-to-count populations and whether it can or should adjust for over and undercount is as important now as in the past.
In the 1970s, the city of Detroit, Young v. Klutznick and the state of New York, Carey v. Klutznick took the lead in trying to resolve the census undercount problem through litigation.6 Prior to the 1980 count, they filed suits contending that not only could the census be conducted more accurately, but that a large post-enumeration survey (PES) could detect undercounts for specific groups and for specific local areas. Post-enumeration surveys are one of two ways the Census Bureau measures undercount. In brief, the PES is a follow-up to the decennial census by independently surveying a sample of the population. The results of this survey are compared to the original enumeration for completeness of count within a household as well as whether the household was completely missed during the census enumeration. This is covered in more detail when we discuss the 2020 Census.
A primary motivation for this litigation was that Detroit and New York were large cities in states that had numerous suburban and rural residents. If the cities were undercounted, their residents were underrepresented in the state legislature and representatives from rural and suburban areas could easily pass laws and tax policies favorable to their own districts but unfavorable to residents in big cities. The plaintiffs contended that PES data should be used to adjust the actual census count to remedy the constitutional violations. The lower courts in Michigan and New York supported the plaintiffs. However, the Sixth Circuit Court of Appeals overturned the lower court decision and argued that the plaintiff, Mayor Coleman Young of Detroit, had not demonstrated a judicially cognizable injury and therefore lacked standing to sue. The Census Bureau planned to release the official but unadjusted apportionment count on December 31, 1980. However, on December 30, the district court in New York handling that city’s litigation issued an order enjoining that release since it did not include an adjustment for undercount. The Supreme Court met the next morning. They overturned the lower court order, and the apportionment population was released on December 31 without an adjustment for undercount ending the challenges to the 1980 Census (Brown 1980).
The Census Bureau’s PES analysis of Census 1980 found the typical shortcoming: an undercount of 5.2 percent of blacks and an overcount of 1.2 percent of whites. Detroit and New York repeated the litigation they began in the previous decade, contending that the continuing racial differences in undercount deprived the residents of large cities of their fair share of representation in state houses and in Congress. The Ronald Reagan administration settled with the plaintiffs by agreeing that the Census Bureau would take a large post-enumeration survey. An eight-person panel—four appointed by the plaintiffs and four by the defendants—would then recommend to the secretary of Commerce whether the actual count or the adjusted count should be the official apportionment population. If the panel deadlocked, the secretary of Commerce would cast the deciding vote.7 The committee deadlocked, leaving Secretary of Commerce Robert Mosbacher with the deciding vote. He turned down the option to adjust for undercount and the actual count was official (Anderson 2015, chap. 11).
In July 1990, a coalition of cities and states led by New York continued the litigation. They filed suit claiming that undercount of minorities in Census 1990 likely cost cities representation and probably gave two states congressional seats they did not deserve thereby denying two other states congressional representation the Constitution mandated. The litigants also contended procedural errors in the decision-making process. The litigation proceeded slowly. In 1996, the Supreme Court recognized an undercount of minorities but ruled that the unadjusted numbers would be official numbers (Wisconsin v. New York et al.).8 Mayor Rudy Guiliani immediately stated that the Supreme Court decision meant that New York City was likely undercounted by 230,000; probably lost at least one seat in the state legislature and would cost the city $500 million annually in federal funds (Greenhouse 1996).
MORE LITIGATION: REENGINEERING THE CENSUS
By now, attention increased on reengineering the census to both cut costs and improve accuracy. Two panels of the Committee on National Statistics examined possible improvements and innovations for the 2000 Census. In the end, the Census Bureau’s plan included a more user-friendly questionnaire. The real innovation, though, was to use sampling in the nonresponse-follow-up (NRFU) operation, which had the potential to cut costs. The sampled population would represent all the nonresponses. In addition, a large post-enumeration survey would be combined with the enumeration via dual-system-estimation, which would result in a one-number census. Not all statistical reviews embraced everything in the Census Bureau plan, but they were in favor of sampling for NRFU and a large post-enumeration survey to measure undercount (Norwood 2016).
In the words of the Census Bureau director at the time, Kenneth Prewitt (2005), “The census was politically radioactive in 2000 and it may remain so.” Republicans were skeptical about the merits of the plan and threatened to hold up funding for the census. The Bill Clinton administration supported the Census Bureau.9 Fearing that this would have political implications, Speaker of the House Newt Gingrich sued the administration. Because the suit involved two branches of the government, the matter immediately went to the Supreme Court. In 1999, in a 5–4 decision in Department of Commerce v. U.S. House of Representatives, the Court ruled that the Constitution forbade the use of sampling in the census and mandated a continuation of traditional census taking.10 They did not, however, eliminate the post-enumeration survey to measure undercount but ruled that information from a sample could not be used to adjust for census errors.
THE CIVIL RIGHTS ACT STILL HAS A LEG TO STAND ON
By July 2023, seventy-four suits had been filed in twenty-seven states challenging how the state legislature used Census 2020 data to reapportion congressional and legislative districts (Brennan Center for Justice 2023). Many of these suits were filed by groups representing black and Hispanic plaintiffs but, in North Dakota, representatives of Native Americans filed suit contending that that state legislature had not drawn state legislative districts where Native Americans made up a substantial fraction or majority of the voting age population. As the Census Bureau’s PES showed, Native Americans on tribal lands or reservations were undercounted by 5.6 percent. A recent study found that nonwhites are drastically underrepresented in local governments including elected positions (DeBenedictis-Kessner 2024).
Federal court decisions in 2023 placed great emphasis on the use of census data to protect the voting rights of minorities and thereby bringing to the fore questions about civil rights violations due to differential undercount in the census. Title 2 of the Voting Rights Act of 1965 prohibits states from adopting policies or procedures that would diminish the voting rights of racial minorities or of certain specific language groups, including Spanish speakers. After the 1990 Census, the Alabama legislature created one congressional district in which a majority of the voting age population was black. For the first time since Reconstruction, a black was elected to represent Alabama in Congress. The state now has seven congressional districts. Using Census 2020 data, the Alabama legislature redrew the state’s congressional districts. In one of them, 46 percent of the voting age population was African American but the percentage black in the other six congressional districts was much lower due to the choices the legislators made in drawing the map. Census 2020 reported that one-quarter of the state’s voting age population were single-race non-Hispanic blacks.
Many states have a tradition of both blacks and whites voting for members of their own race, a tradition the Supreme Court noted. After the Alabama legislature drew new congressional maps based on Census 2020 data, voting rights plaintiffs in Alabama argued that there should be two districts where blacks could elect a representative that would serve their interests and sued. A panel of federal judges in Alabama unambiguously upheld the plaintiffs’ view and ordered the districts be redrawn so that Alabama voters would have the opportunity to elect more than one black to Congress.
The Alabama attorney general appealed to the Supreme Court. Most court watchers were surprised when the Supreme Court upheld the lower court ruling with a 5–4 majority and ordered that Alabama redraw its districts in compliance with the Voting Rights Act (Allen v. Milligan).11 Eventually, the state legislature complied with this ruling, as did other states with large concentrations of blacks.
This victory for civil rights may be short lived, however. Brett Kavanaugh voted with the majority but raised the issue of whether a time limit should be set on how long minority voting districts are necessary. In time, a case will raise that issue. In addition, several of the southern states that had to draw an additional minority voting district have challenged the minority voting rights districts on other grounds.
The Eighth Circuit ruled that only the U.S. Department of Justice could serve as a plaintiff in litigation regarding how legislative districts were drawn.12 In Georgia, the state legislators dismantled a coalition minority opportunity district of Hispanic and Asians, neither of which were large enough to be a stand-alone minority opportunity district (Gringlas 2023). They did this to create an additional black opportunity district. Will coalition minority opportunity districts be on the chopping block? If so, these are quite numerous in states such as Texas and California.
THE 2020 CENSUS
The federal government spent $13.7 billion to enumerate the population in 2020, that is, a cost of $41 per person (GAO 2023). For decades, administrations have sought to minimize that cost. Recall that President Clinton ran on a reinventing government platform, which was supposed to bring efficiencies to the federal government and save money. It has not worked, at least as far as the cost of the decennial census.
The 2020 Census was conducted under incredibly challenging circumstances (Sullivan and Cork 2023). Because of the COVID-19 pandemic, the Census Bureau had to delay the start of its nonresponse-follow-up. There was also political interference. The Donald Trump administration reduced funding for the census, which led to the cancellation of several pre-tests in sites the Census Bureau had selected because few residents had computers with high-speed connectivity. The Census Bureau wanted to assess the challenges of enumerating in that environment. The Trump administration also attempted to add a question on citizenship. As demographers predicted, this apparently reduced the response rate among Hispanics. For Census 2020, the post-enumeration survey estimated that 5.0 percent of Hispanics were missed, but the same study in 2010 reported that only 1.5 percent of Hispanics were not counted. In a complicated decision by the Supreme Court, citizenship was not added to the 2020 Census questionnaire.13 However, then President Trump wrote an executive order to have the Census Bureau and other executive agencies determine how many citizens and noncitizens there were in the United States.14 A year later, he wrote a memorandum that would exclude unauthorized immigrants from the apportionment count (Lo Wang 2020).
The apportionment counts were not released before Trump left office, so he was not able to attempt to implement this plan. The idea, however, has staying power. In January 2024, Senator Hagerty from Tennessee and Senator Budd from North Carolina along with twenty-two other Republican senators introduced the Equal Representation Act, requiring that Census 2030 include a citizenship question and that only the count of citizens could be used to allocate congressional and electoral college seats (Budd 2024). This has almost no chance of being enacted into law, but another Supreme Court ruling is possible about what the Constitution means that apportionment should be based on the count of the “whole number of persons” in each state.
A major cost-cutting innovation for Census 2020 was providing households with an array of ways to respond: by telephone, by mail, or by internet. Since 2000, the Census Bureau has used a Master Address File (MAF) to reach the residential address of respondents. The initial MAF was based on the 1990 Census Address Control file and the U.S. Postal Service delivery sequence file. This is updated twice a year. Since the passage of the Census Address List Improvement Act of 1994,15 the Census Bureau can work with local government to improve the MAF. The law created the Local Update of Census Addresses (LUCA) program, which gives local governments the opportunity to examine the list of addresses in their area before the decennial census enumeration, allowing them to suggest modifications. The Census Bureau provides feedback to the municipalities. Not all municipalities participate, but 2020 saw more address updates than expected (GAO 2019).
Another innovation for the 2020 Census was the use of handheld devices to collect data from nonrespondents. All responses were entered into the device, which meant that the Census Bureau knew which nonresponding households had been reached and in turn that enumerators could be more efficiently deployed. The handheld devices were part of the planning for the 2010 Census, but the project was behind time and over budget, so the innovation was not brought on board until the 2020 Census.
By 2019, the Census Bureau had an updated address list for each locality. Each household received a census enumeration form in the mail shortly before April 1 and was encouraged to respond by mail, telephone, or internet. All households that do not respond are followed by enumerators going door to door.
Because of COVID, the nonresponse-follow-up operation did not begin until August. The Census Bureau intended to continue the NRFU operation through November 2020, but the Trump administration ordered that it end at the end of August. Federal courts in California rejected the administration’s effort and ordered that NRFU continue until early October.16
If a housing unit did not respond, NRFU interviewers went to the missing address and attempted to enumerate the household or determine that the housing unit was empty or demolished. If the NRFU interviewer determined that the residence was occupied but could not contact anyone living there, at some point the enumeration software prompted the interviewer to secure information from a neighbor. The Census Bureau used administrative records to complete the enumeration of households that were never reached. In 2020, this amounted to 4.6 percent of verified MAF addresses (Sullivan and Cork 2023, chap. 8). The Supreme Court’s 2002 Utah v. Evans decision approved the use of imputation in the census.17
The Census Bureau has long been aware of an undercount and initiated processes to accurately measure it. Starting in 1980, the Census Bureau conducted post-enumeration surveys after each census. An independent sample of addresses was matched to the original enumeration of the same addresses. An enumerator went to the sampled address to determine if accurate information had been provided about who lived there on the April 1 census date. This revealed who was missed and who was overcounted in the census. These studies found a large racial difference in census quality, a substantial undercount of children but an overcount of persons age eighteen to twenty-nine and a more substantial overcount of persons fifty and older (U.S. Census Bureau 2022).
Table 1 shows the Census Bureau’s PES estimates of census accuracy from 1990 to 2020. It also reports the number of people, by race, over- or undercounted in Census 2020. Overall, the census did an excellent job, at least at the national level. In 2020, the Census Bureau counted 331 million residents with an estimated net undercount of only six hundred thousand—just 0.2 percent. A look at the race-specific data, however, reveals that Census 2020 and earlier numerations substantially undercounted blacks, Hispanics, and Native Americans and that the white and Asian populations were substantially overcounted. Demographer William O’Hare (2019b) contends that much more attention should be paid to gross omissions as estimated by the PES, rather than the net undercount rate. The Census Bureau’s 2020 PES, for example, reported that the census failed to count about nineteen million persons. This was offset, though, by about seven million who were counted twice and eleven million who were imputed based on proxy interviews or through administrative records. The gross omission rate was 5.6 percent and the net omission rate only 0.2 percent. In other words, the Census Bureau’s PES reveals a substantial overcount of some groups such as “snowbirds,” who have two residences, and college students, who are often counted both at home and in their college residence. These overcounts offset omissions (Hill et al. 2022, appendix table 2). The net omission rates give an extremely misleading view of census accuracy.
Census Bureau Estimates of Undercount and Overcount by Race: 1990 to 2020
Data Used to Calculate Reimbursement Rates for Medicaid
The racial difference in census accuracy is large. The Census 2020 PES reports that about 3.9 million Hispanics and blacks were missed but almost 4.1 million whites and Asians were counted twice. The PES estimates of census quality are based on data for the population living in households. The Census Bureau does not measure the over- or undercount of persons living in group quarters such as dormitories, barracks, nursing homes, or prisons. In 2020, approximately eight million people, some 2.5 percent of the total population, lived in group quarters.
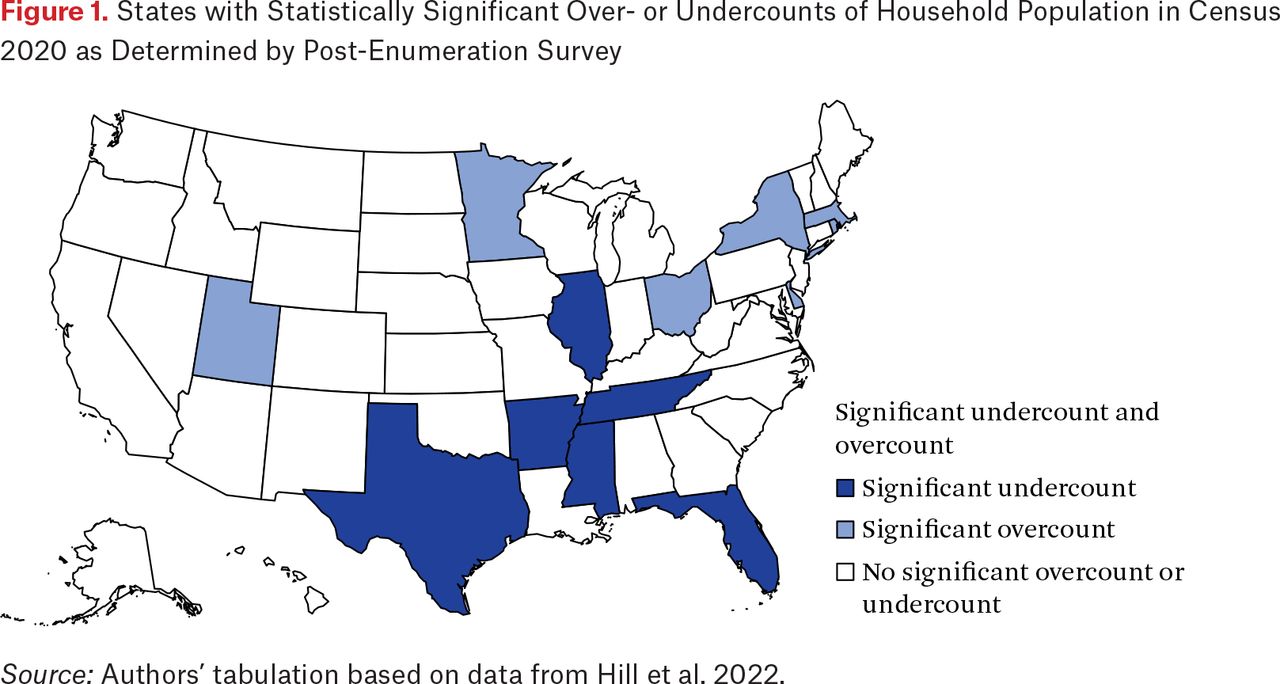
Using an online apportionment calculator (Population Studies Center 2024), one can determine what the difference in apportionment would be if the PES estimates of states’ 2020 household populations were correct (Hill et al. 2022). This exercise shows that using the Census 2020 counts gave Colorado, Minnesota, and Rhode Island congressional and electoral college seats they should not have. Florida, Tennessee, and Texas each lost a seat because of census deficiencies, assuming that the PES is correct (see figure 1).

States with Statistically Significant Over- or Undercounts of Household Population in Census 2020 as Determined by Post-Enumeration Survey
Source: Authors’ tabulation based on data from Hill et al. 2022.
Undercount in Census 2020 apparently misallocated three congressional and electoral college seats, which presents a civil rights issue. The undercount implies that residents of Colorado, Minnesota, and Rhode Island will have more power in determining who will be elected president in 2024 and who will serve in Congress than the framers of the Constitution intended. Residents of Florida, Tennessee, and Texas, however, will have less influence.
THE CENSUS: COUNTING FOR DOLLARS
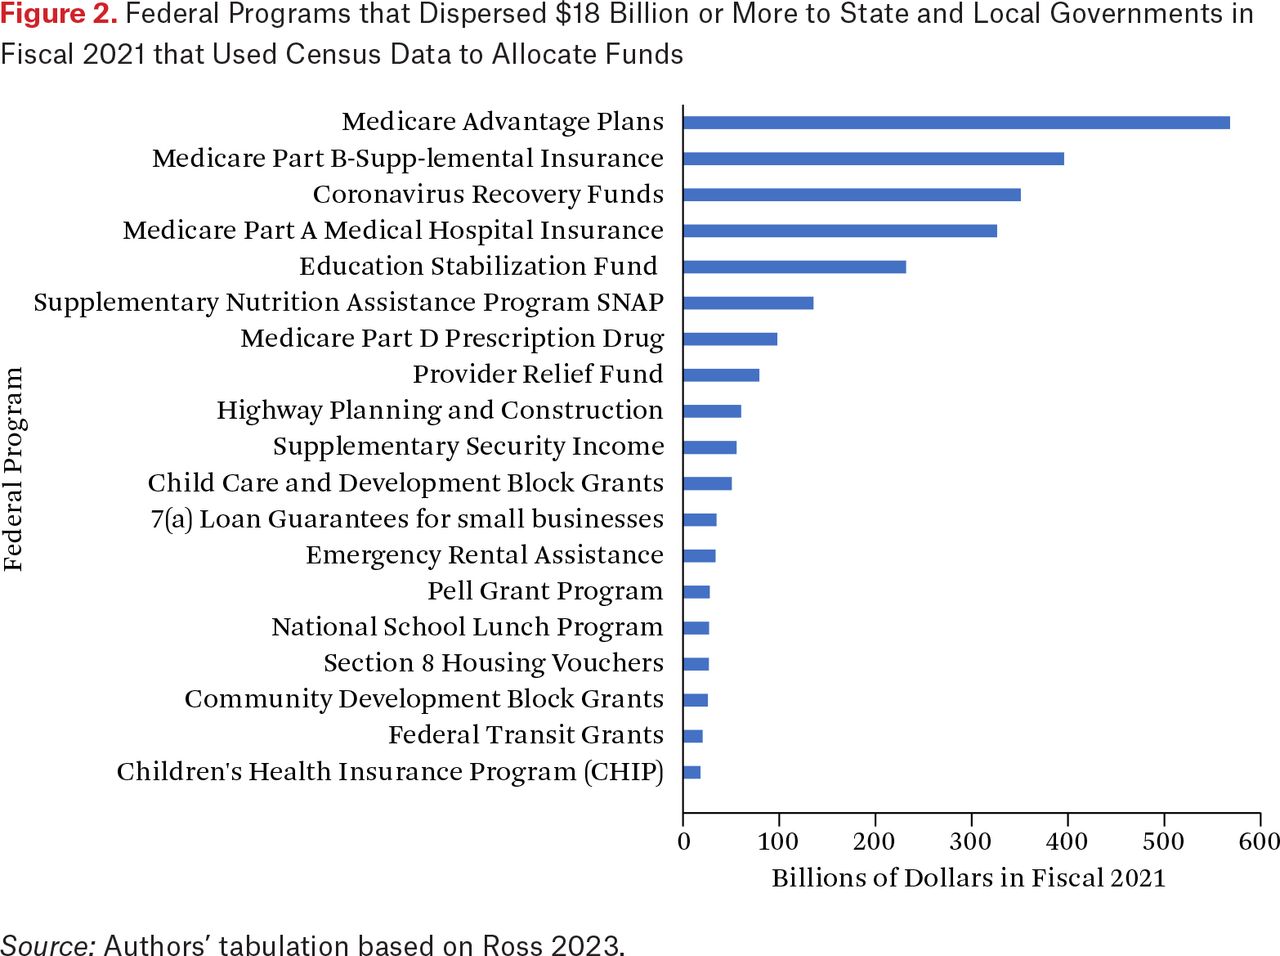
Large cities have always complained about the political and financial implication of undercount, but most of this objection flew under the radar until Andrew Reamer (2020) at George Washington University created the Counting for Dollars website in 2016. This data-laden and detailed resource shows the distribution of dollars to states based on population numbers or other community characteristics measured by the ACS, which is linked to the census. In fiscal year (FY) 2017, this amounted to 316 federal spending programs distributing $1.5 trillion. By FY 2021, it amounted to 353 federal programs distributing $2.8 trillion (Ross 2023). Some of the major federal programs that distribute funds to states, local governments and school districts are presented in figure 2.

Federal Programs that Dispersed $18 Billion or More to State and Local Governments in Fiscal 2021 that Used Census Data to Allocate Funds
Source: Authors’ tabulation based on Ross 2023.
Since the early 1970s, when President Nixon proposed revenue sharing, Census Bureau data have been used to allocate federal monies to local governments and school districts. Nixon proposed that 2 percent of what the Internal Revenue Service collected be distributed to the nation’s thirty-one thousand local government based on their population size, their poverty rate, and the taxes imposed on residents. Census Bureau data were used to determine population size and the poverty rate. Census 1970 asked an income question so that the Census Bureau could determine the poverty rate for each of the local governments. This federal revenue sharing, albeit at a reduced rate, began in the Gerald Ford administration but was terminated in the Reagan administration.
Since the 1970s, Congress has vastly increased the federal programs that distribute funds to states, municipalities, and school districts based on characteristics such as poverty, unemployment, and housing overcrowding that are measured by the Census Bureau in their surveys, especially the American Community Survey. The population figures in these surveys are intricately linked to the previous last census count. Thus census undercount or overcount has an impact on the share of the $2.8 trillion annual disbursement that subnational governments and school districts receive from the federal government.
As an example, consider Medicaid. Congress enacted this program in 1965 to provide states with federal funds that would provide health insurance to low-income individuals. In fiscal 2022, the federal government dispersed $571 billion to states for Medicaid. The federal allocation formula is a complicated one and states have two options about how their revenue will be calculated. However, the key element in the distribution of Medicaid funds is the per capita income of the residents of the state. The higher the per capita income, the smaller the share of total medical costs paid by the federal government and the higher the share paid by the state. At present, the federal reimbursement rate is 50 percent for Connecticut, New Jersey, and New York but 75 percent for Mississippi. In other words, residents of New York state must put up one dollar for every dollar of Medicaid aid they obtain from Washington. However, one dollar spent by Mississippi taxpayers for Medicaid benefits nets them three dollars in federal dollars.
Table 2 shows the Census Bureau’s demographic estimate of the likely undercount of a racial group in Census 2020 and that group’s per capita income as reported in the 2021 American Community Survey. A census overcount of whites and Asians in a state paired with a 4 to 5 percent undercount of blacks and Hispanics would carry over to the population figures used in the ACS and the state’s per capita income could be erroneously high, forcing the state’s taxpayers to overpay for Medicaid.
In 1997, members of Congress realized that many children in this country did not have health insurance because they did not qualify for Medicaid. Congress responded by passing the Child’s Health Insurance Program (CHIP). This is a state and federal program that rapidly increased the proportion of the nation’s children covered by health insurance. States pay the administrative costs, but the federal government distributed $15 billion to states in 2022 for the CHIP program. The distribution formula is like that used for Medicaid. That is, it depends on the ACS estimate of the annual per capita income in a state.
In 1965, President Lyndon Johnson signed the Elementary and Secondary Education Act, which initiated direct federal support for local school districts. Title I of that act distributes federal monies both to the state educational agency and to individual school districts within the state. The allocations to local school districts depend on the proportion of children age five to seventeen living in that school district who are formula eligible; that is, their household income is below the poverty line. In fiscal 2022, Title I distributed $36 billion to local school districts. The data used to distribute those funds are obtained from the American Community Survey. The five-year compiled files of ACS data provide a count of impoverished children living in each school district, but the ACS does not enumerate the population. The ACS population figures instead reflect the previous decennial census with updates for population change: births, death, and domestic and international migration.
The Census Bureau’s demographic analysis of the quality of the 2020 enumeration by age reported that 5 percent of children under age five were not counted in the census but the college-age population—ages eighteen to twenty-four—was overcounted by 4 percent, the same overcount rate for those age sixty-five and older (U.S. Census Bureau 2022). The Census Bureau does not present that information specific for the race of children, but their evaluations of census quality consistently show an overcount of whites and Asians and an undercount of blacks and Hispanics. Most likely, school districts with primarily minority students were less completely counted in the census than school districts with few minority students. This has implications for the ACS estimates of impoverished children in school districts. The current federal allocation provides about $1,500 annually for every student in districts with high childhood poverty rates and about $1,100 for students in districts with lower poverty rates.
Table 3 shows the distribution of two populations who benefit from federal policies linked to census counts in the state of Michigan: Medicaid recipients and children in poverty. It is abundantly clear that Detroit has a far larger share of Medicare recipients and children in poverty than other populations in suburban Detroit or outside metropolitan Detroit. Quoting a presentation by Andrew Reamer (2019): “For the most part, census-derived data don’t determine the ‘size of the pie’ but ‘who gets what slice of pie’.”
Percentage of Michigan Population Insured by Medicaid and Children Under Eighteen Impoverished in 2021
Funds not received by a state or municipality because of an undercount are distributed to other states and municipalities that were more accurately counted or overcounted in the census. Undercounting matters because it reduces the slice of the pie going to localities that can least afford to lose their share of funding and sends more money to overcounted municipalities.
The Counting for Dollars website provides detailed and up-to-date information about the more than three hundred federal programs that currently distribute more than $2.8 trillion in federal government dollars to local governments and school districts annually. No other website provides similarly comprehensive information about the many states that share some of their tax revenue with local governments. In many states, population size is a major criterion.
In Maine, for instance, the state places what it receives from sales taxes, corporate income taxes, and personal income taxes into a pool. A fraction of that pool is distributed annually to local governments. Three criteria are used to determine how much a local government receives. The criteria are population size, local state valuation of property, and the sum of local assessments of property values (Office of the State Treasurer, State of Maine 2024).
Michigan has both constitutional and legislative revenue sharing. Its 1963 constitution mandates that each year approximately 10 percent of what the state collects in sales tax must distributed to the state’s 2,863 local governments. Each government gets a share of revenue equal to its share of the state total population as determined by the most recent census.
In 2024, constitutional revenue will likely provide the city of Detroit with about $71 million, about $110 per person. This suggests that if Detroit’s population were undercounted by 40,000 in Census 2020, the city would lose about $5 million each year until the results of Census 2030 are released (State of Michigan, Department of Treasury 2024). That $5 million would go to municipal governments that were more accurately enumerated or overcounted in 2020. Michigan also has legislative revenue sharing designed to provide support to local governments whose tax base has recently dropped.
The importance of this issue to the financing of local governments was highlighted by developments in January 2024. The Census Bureau will take a special census, paid for by the local community, of any local governmental unit any time during the first seven years of a decade. In many states, the allocation of state dollars is based on the most recent official Census Bureau count of a community.
By January 2024, seven cities in Iowa, four in Illinois, more than a dozen in Tennessee, and two in Washington agreed to either pay the Census Bureau to take a special census in 2024 or decided to take a special census on their own. In most of these places, it was done to capture more state dollars. In others, it was done because officials believed the 2020 population was undercounted or had grown since then. The mayor of Bondurant, Iowa, for example, stated that the Census Bureau would bill his city for $400,000 for a special census but that expenditure will be a net plus for the city because Bondurant will get an additional $1 million each year until the Census 2030 count is released (Leone and Schneider 2024).
In Tennessee, the state constitution allows cities to take their own censuses. Quite a few locations are doing so, including Memphis. They are motivated because Tennessee currently distributes about $170 annually per resident (Tennessee State Data Center 2024).
DETROIT CHALLENGES THE CENSUS ONCE AGAIN: CENSUS 2020
So far, this article has described the importance of census accuracy. Redistricting is based on decennial census counts and a census undercount can hurt at the state level for apportionment, but is even more critical for the mapping of legislative districts. Undercounting also deprives communities of funding that is based on either population counts or the characteristics of undercounted populations. To paraphrase the title of a book by Barbara Bryant, the first woman to direct the Census Bureau, the census moves power and money (Bryant and Dunn 1995).
To illustrate the harm and the difficulties of adequately redressing census undercount, we turn to the city of Detroit and its experience with the 2020 Census, including its formal challenge to the census count. Three years before the census, the Census Bureau provided Detroit with the address list they intended to use for the enumeration, the Master Address File. The city updated that list. In 2018, and the Census Bureau and city agreed on a count of slightly more than 360,000 dwelling units—occupied and unoccupied in the city.
The Census Bureau annually calculates and publishes population estimates of municipalities. Detroit was often cited for leading the nation in population decline. From 1950 to 2013, the city lost residents at a rate of nineteen thousand per year. Demographic trends turned around after the city came out of bankruptcy in 2014. Large employers invested heavily in the city and the local government finally had funds to revitalize city services and invest in neighborhoods. According to Census Bureau estimates, from 2014 to 2019, the city lost residents at a rate of only two thousand per year. The Census Bureau estimated that 670,000 lived in Detroit in 2019 and that the city had 360,000 housing units.
However, when the 2020 Census results were published for Detroit, the census showed 639,000 residents and 310,000 housing units, which implies a loss of thirty-one thousand residents and about fifty thousand residential units in one year. Mayor Michael Duggan and local demographers immediately recognized that these results were puzzling and likely erroneous.
The mayor and his staff examined data for Detroit neighborhoods and discovered that the vacancy rate in several of the city's most elegant neighborhoods, including Boston Edison, were high. Boston Edison, where the city’s financial elite in the 1920s built their mansions, is one of the most magnificent inner-city neighborhoods in the nation. A team was assembled to explore the potential undercount in Detroit. It included the city staff, a group from Wayne State University, and demographers from the University of Michigan (Cooney et al. 2021). The first project, this team undertook was to determine whether the Census 2020 vacancy rates made sense. To explore this notion, the team examined the 2020 Census count of occupied housing units in two types of neighborhoods, each consisting of five census block groups. The first neighborhood should have been relatively easy to count because it had among the highest rates of census self-response in the city, had relatively high rates of residential stability, and was mostly single-unit, owner-occupied housing. The second was more typical of Detroit—relatively low rates of census self-response, lower rates of residential stability, and higher vacancy rates. Census 2020 counted 625 block groups in Detroit with an average population size of 1,022.
The group from Wayne State canvassed the first sample of block groups in stable neighborhoods and enumerated the number of total and occupied housing units. These were compared with postal delivery data (USPS) and the 2020 Census count. The Wayne State enumeration data tracked very closely to the USPS data, whereas the Census 2020 data showed consistently lower occupancy rates. The second set of block groups was not enumerated but compared with postal delivery data. Overall, this research revealed that in this small sample of neighborhoods was a likely undercount of occupied housing units of 8.1 percent (Cooney et al. 2021).
This finding—a major undercount of occupied housing units—could not be used to challenge the adequacy of the nonresponse follow-up (NRFU) enumeration in Detroit because census challenges are limited to geographic errors and processing errors. A discrepancy in occupancy rates would not be considered a data collection error. The city felt that missing housing units was an example of a process issue—an inadequate NRFU. The city submitted a formal challenge about the missing housing units to the Census Count Resolution Program (CQR). This is a Census Bureau program through which local governments can submit their objections to the official count. The city compared USPS records for all city blocks and found that 4,350 blocks had more housing units than the 2020 Census count showed. In that census, 14,290 blocks in Detroit had an average population size of forty-five. This finding was submitted and almost immediately rejected because the Census Bureau would not accept USPS data as a data source. The city had ninety days to respond.
The city conducted a virtual audit of all housing units on these 4,350 blocks—that is, 30 percent of all blocks in the city. According to USPS data, these blocks included 114,274 residential addresses. The city used street-view images (such as Google Street View and Detroit Street View) to assess the presence and condition of the housing units. The raters found two images of each address as close as possible to April 1, 2020 (one before and one after the census). Raters were trained to count housing units based on the Census Bureau’s definition of an inhabitable residential unit, the definition the Census Bureau uses to determine whether a housing structure is sufficiently protected from the elements that someone could live there—regardless of whether the unit is currently occupied or vacant.
The audit also included a quality-control process in which a random sample of housing units were rated twice. On occasion, raters could not rate a housing unit. These were viewed with satellite imagery to allow a better visual examination.
In the end, the raters found that the Census Bureau missed 11.8 percent of the residential housing units on these 4,350 blocks. Omissions were more pronounced in the blocks with lower self-response rates. Recall that the Census Bureau shifted to self-reporting online and assumed that most householders would use a computer with a high-speed connection to fill out their census form on their laptop. However, Detroit is one of the least connected big cities in the country (National Digital Inclusion Alliance 2019). Thus it was no surprise that Detroit had the lowest Census 2020 self-response rate among the fifty largest cities in the United States (Khan 2020). The Census Bureau’s 2019 ACS reported that 82 percent of Detroit housing units were occupied and that each unit had an average of 2.3 residents. An undercount of 11 percent of housing units implies that Census 2020 may have undercounted Detroit’s population by twenty-four thousand if restricted to the CQR challenge blocks and up to sixty thousand if applied to the entire city.
An issue relevant to Detroit’s missing housing units is a lack of transparency in how the Census Bureau develops the Master Address File. Recall that the city made changes to the MAF via the LUCA program that were accepted by the Census Bureau. The city does not get to see which addresses were deleted during the 2020 Census, however. The government watchdog has recommended more transparency and collaboration between the Census Bureau and municipalities in the MAF operations (GAO 2019). Further, the Panel to Evaluate the Quality of the 2020 Census observed that the “decennial census is as much an inventory of housing and residential addresses/locations as an enumeration of persons” (NASEM 2022).
Low self-response rates are exacerbated if not enough time and resources are devoted to the NRFU operation. Detroit officials complained that its local area census office started late, ended early, and was not adequately staffed and supervised. Indeed, all the suburban census offices started their NRFU operation before the Census Bureau opened its Detroit NRFU office. Detroit was not well served by the 2020 Census. The consequences are substantial. One of the authors of this article, Jeffrey Morenoff, testified at a Senate subcommittee meeting held in Detroit in 2022 that focused on Census 2020 operations in Detroit (Mackay and Rahal 2022).
“This seismic decline in housing stock is likely inaccurate and translates into a significant population undercount,” Morenoff said. “There’s a real impact behind this undercount of people that should have gotten millions of dollars that should have gone to programs providing affordable housing, nutrition assistance, early childhood education and more won’t reach the people who need them.”
In the end, Detroit’s Count Resolution Appeal was rejected by the Census Bureau. The city can challenge the population estimates, which at the beginning of the decade are very much driven by the 2020 Census. However, these—as well as the unsuccessful CQR—require incredible expertise and effort on the part of a city, especially if the challenge is based on more than just building permits. Even if the population estimate challenges are successful, Detroit is stuck with the 2020 Census housing unit counts for its starting point for all the population estimates.
CONCLUSION
The framers of the U.S. Constitution established a country from former British colonies. They determined that each state should have political power proportional to its population. Hence the constitution mandates a decennial census. The United States and Australia are the only two countries with such a constitutional mandate for such an enumeration.
Data collected in the census have influenced the allocation of federal spending since the nation’s founding but, since the 1970s, the increase in the federal programs that disperse money to local governments based on their population size and their characteristics measured by the Census Bureau has been tremendous. Truly, the decennial census moves power and money.
The Census Bureau’s analysis of census quality reveals that the overall count of the total population in Census 2020 was extremely accurate but this came about because of an overcount of some groups and an undercount of others. This article focuses on the substantial undercount of Hispanics and blacks and the offsetting overcount of Asians and whites. Indeed, these errors in Census 2020 may have misallocated three congressional and Electoral College seats.
Supreme Court decisions in the 1960s and 1970s clearly established that the democratic principles underlying the constitution call for electoral districts within a local government to be equal in population size as measured by the U.S. Census. In 2023, the Supreme Court just as authoritatively ruled the Voting Rights Act of 1965 mandates that when election districts are drawn, they must be drawn to enhance the chances of electing to office a member of one of the protected minorities specified in that 1965 law; that is, blacks, Hispanics, and Native Americans. As a result of recent federal court orders, Alabama and Louisiana have redrawn their congressional districts to increase the likelihood of minority representation in Congress. The number of African Americans serving in Congress rose from five of 435 when the Civil Rights Act was enacted in 1965 to fifty-four of 435 in 2024 and the number of Hispanics in the House of Representative rose from three in 1965 to forty-five in 2024 (Brookings Institution 2024). If the 2023 Supreme Court decision holds, this likely guarantees that the number of blacks and Hispanics in Congress will continue to increase.
At present, Census 2030 is being planned. We reviewed the issue of undercount in Detroit and showed that it is almost impossible for a municipality or state to present evidence that will lead the Census Bureau to change the census count. The evidence that the city of Detroit presented was compelling. This affects the annual population estimates, which are bookended by the most recent decennial census. Those annual population estimates are influential in the dispersion of federal and state dollars. It is likely that locations with many minority residents are losing their fair share of such monies and locations that were overcounted are getting more than their fair share.
Based on our Detroit analysis, we offer several suggestions about improving the Master Address File for Census 2030 and the need for a very prompt and well-organized NRFU operation. Quite likely, to reduce costs, there will be calls for Census 2030 to rely heavily on administrative records to impute residents to households that did not respond to the census.
Before using administrative records to reduce the expensive cost of NRFU work in Census 2030, the Census Bureau and Congress need to assure the nation that their use will not perpetuate or exacerbate the differential under- and overcounts by race and ethnicity described in this article.
FOOTNOTES
↵1 Shelby County v. Holder, 370 U.S. 529 (2013).
↵2 Baker v. Carr, 369 U.S. 186 (1962).
↵3 Gray v. Sanders, 272 U.S. 368 (1963).
↵4 Westberry v. Sanders, 376 U.S. 1 (1964).
↵5 Reynolds v. Sims, 377 U.S. 433 (1964).
↵6 Young v. Klutznick, 652 F.2d 732, 6th Cir. (1981); Carey v. Klutznick, 653 F.2d 732, 2nd Cir. (1981).
↵7 An Undercount Steering Committee comprised Census Bureau statisticians and voted 7–2 in favor of adjusting for undercount, as did the Census Bureau director, Barbara Bryant.
↵8 Wisconsin v. New York et al., 517 U.S. 1 (1996).
↵9 Clinton had run for office on a reinventing government platform, which would reduce the number of government employees. Sampling for NRFU fits this model well. More long-lasting was the outsourcing of technology at the Census Bureau, which occurred under his administration (Ruggles and Magnuson 2020).
↵10 Department of Commerce et al. v. U.S. House of Representatives et al., 525 U.S. 316 (1999).
↵11 Allen et al. v. Milligan, 599 U.S. 1 (2023).
↵12 Arkansas NAACP et al. v. Arkansas Board of Apportionment et al., 578 F.Supp.3d 1011 (2023).
↵13 Department of Commerce et al. v. New York et al. 18 U.S. 966 (2019)
↵14 Exec. Order No. 13880, 84 Fed. Reg. 136 (July 16, 2019).
↵15 Public Law 103–430.
↵16 National Urban League v. Ross, No. 20-16868 (9th Cir. 2020).
↵17 Utah v. Evans, 536 U.S. 452 (2002).
- © 2025 Russell Sage Foundation. Neidert, Lisa, Reynolds Farley, and Jeffrey Morenoff. 2025. “How Census Undercount Became a Civil Rights Issue and Why It Is Increasingly Important.” RSF: The Russell Sage Foundation Journal of the Social Sciences 11(1): 26–43. https://doi.org/10.7758/RSF.2025.11.1.02. Direct correspondence to: Lisa Neidert, at lisan{at}umich.edu, 909 Northwood Ann Arbor, Michigan 48103, United States; Reynolds Farley, at renf{at}umich.edu, 807 Asa Gray Drive #306 Ann Arbor, Michigan 48105, United States; Jeffrey Morenoff, at morenoff{at}umich.edu, Gerald R. Ford School of Public Policy, University of Michigan, 735 South State Street, Ann Arbor, Michigan 48109, United States.
Open Access Policy: RSF: The Russell Sage Foundation Journal of the Social Sciences is an open access journal. This article is published under a Creative Commons Attribution-NonCommercial-NoDerivs 3.0 Unported License.
In this issue


Jump to section
- Article
- Abstract
- CENSUS UNDERCOUNT
- CENSUS UNDERCOUNT: DEMOGRAPHERS TO THE RESCUE
- UNDERCOUNT: WHY IT DIDN’T MATTER
- LITIGATION OF UNDERCOUNT
- MORE LITIGATION: REENGINEERING THE CENSUS
- THE CIVIL RIGHTS ACT STILL HAS A LEG TO STAND ON
- THE 2020 CENSUS
- THE CENSUS: COUNTING FOR DOLLARS
- DETROIT CHALLENGES THE CENSUS ONCE AGAIN: CENSUS 2020
- CONCLUSION
- FOOTNOTES
- REFERENCES
- Figures & Data
- Info & Metrics
- References
Related Articles
Cited By...
- No citing articles found.