
Article Figures & Data
Figures
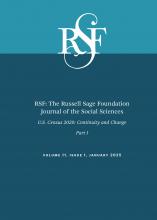
- Figure 1.
Proportion of Twenty-Six to Twenty-Eight-Year-Olds with a Bachelor’s Degree
Source: DiPrete and Buchmann 2013. Reprinted with permission.
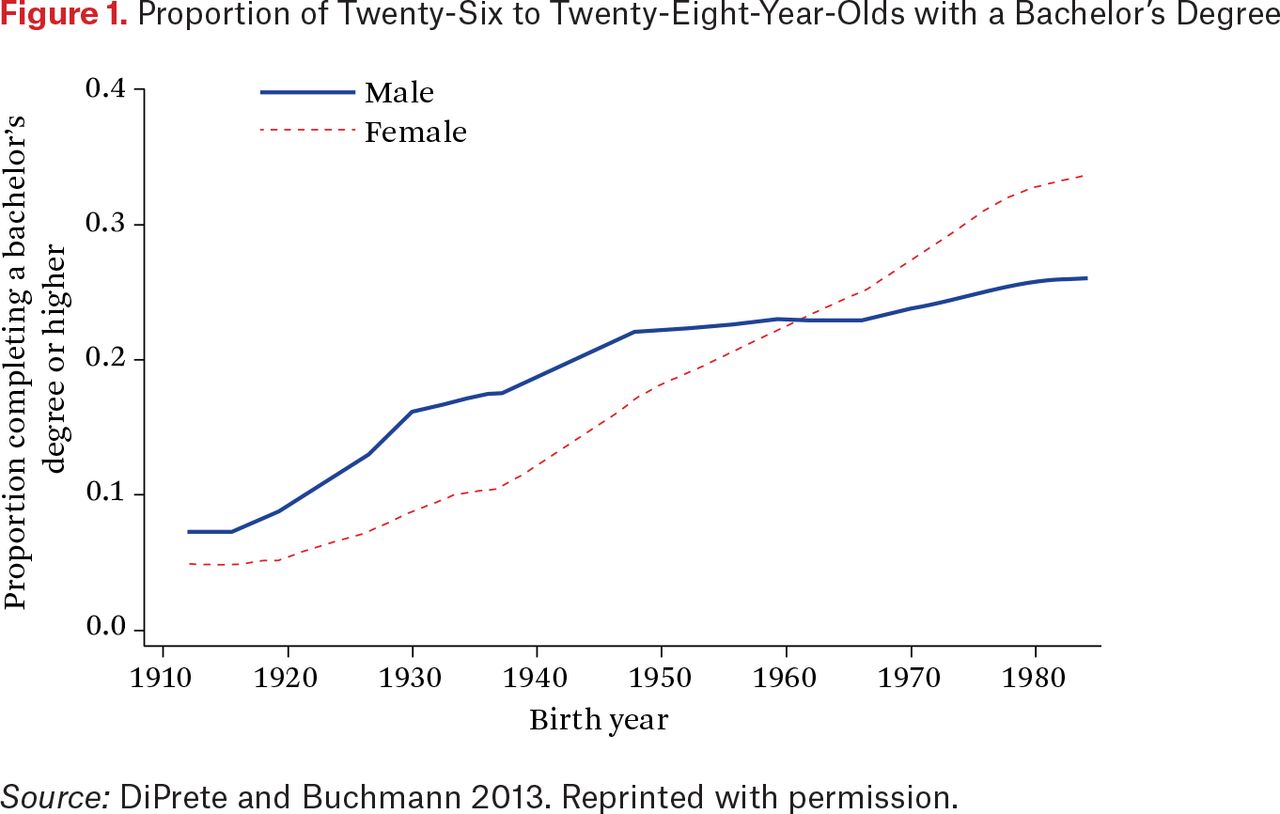
- Figure 2.
Women’s Share of BA Degree Recipients, by Race and Ethnicity
Source: Authors’ calculations based on NCES 2023b, table 322.20.
Note: 2000 refers to the 1999–2000 academic year; 2001 refers to the 2000–2001 academic year, and so on.
- Figure 3.
Mean Grade Point Average for High School Seniors
Source: Authors’ compilation based on DiPrete and Buchmann 2013 and National Assessment of Educational Progress (NAEP 2019).
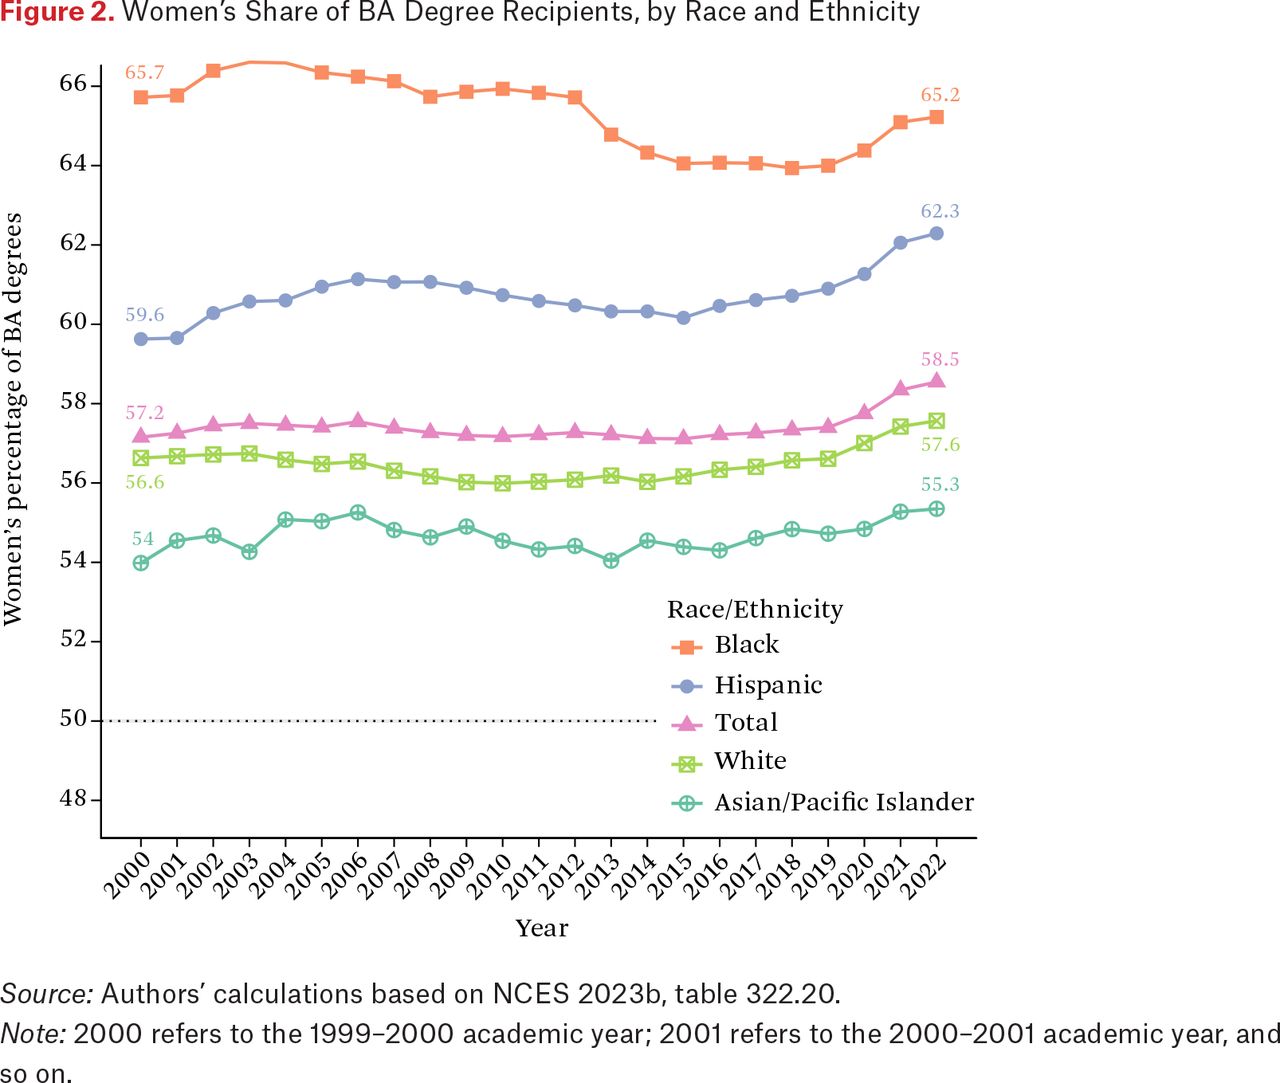
- Figure 4.
Percentage of High School Graduates Across Highest Levels of Math and Science Courses Earned in 2019
Source: Authors’ calculations based on NAEP 2019.
Note: The sum of women’s percentage is slightly above 100 because of rounding.
- Figure 5.
Women’s Share of BA, MA, and Doctoral/Professional Degree Recipients
Source: Authors’ calculations based on NCES 2022, table 318.10.
Note: The given year is the second of an academic year span: 2000 refers to 1999–2000, 2001 to 2000–2001, and so on.
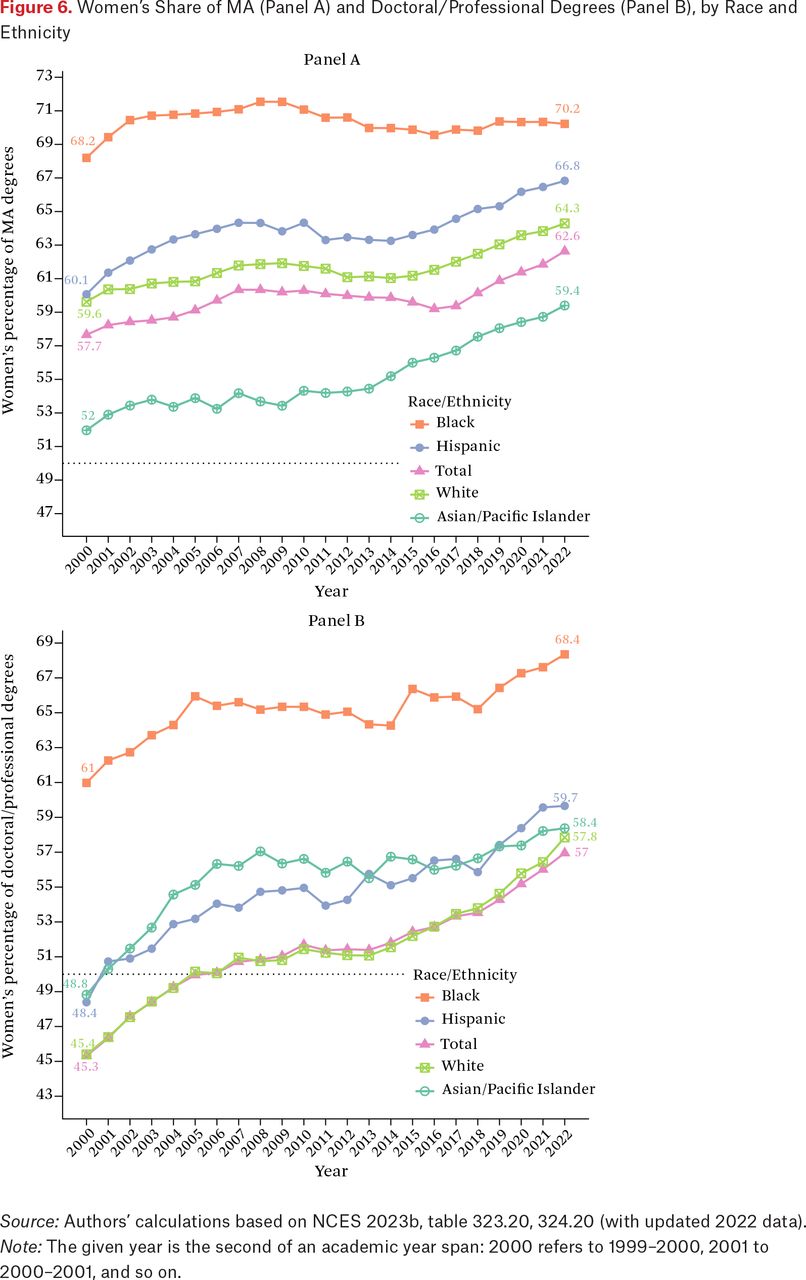
- Figure 6.
Women’s Share of MA (Panel A) and Doctoral/Professional Degrees (Panel B), by Race and Ethnicity
Source: Authors’ calculations based on NCES 2023b, table 323.20, 324.20 (with updated 2022 data).
Note: The given year is the second of an academic year span: 2000 refers to 1999–2000, 2001 to 2000–2001, and so on.
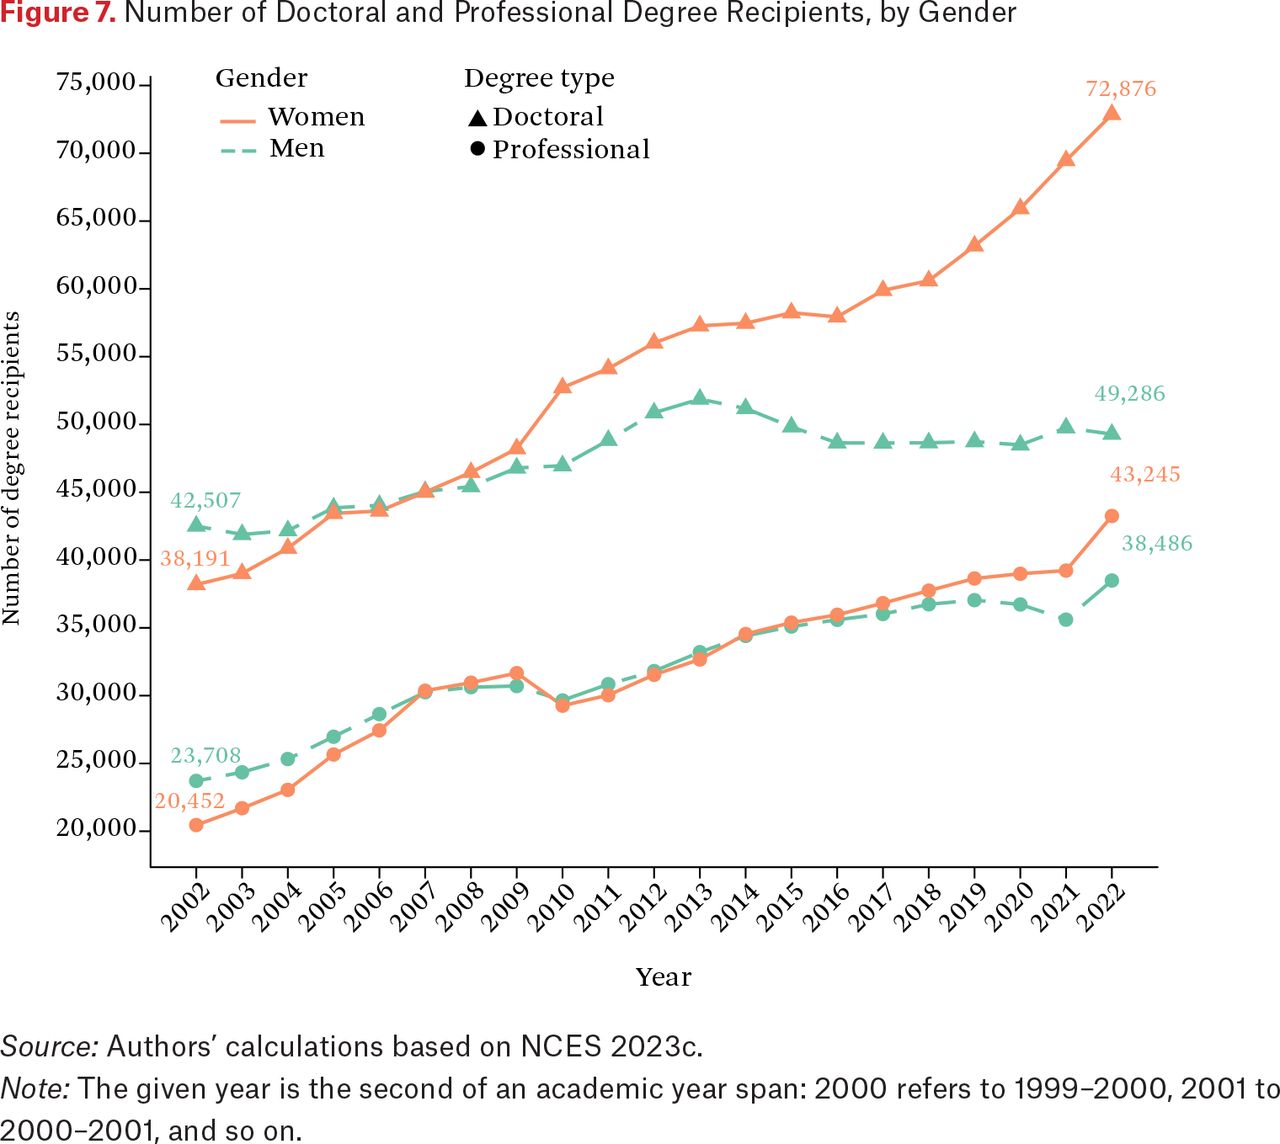
- Figure 7.
Number of Doctoral and Professional Degree Recipients, by Gender
Source: Authors’ calculations based on NCES 2023c.
Note: The given year is the second of an academic year span: 2000 refers to 1999–2000, 2001 to 2000–2001, and so on.
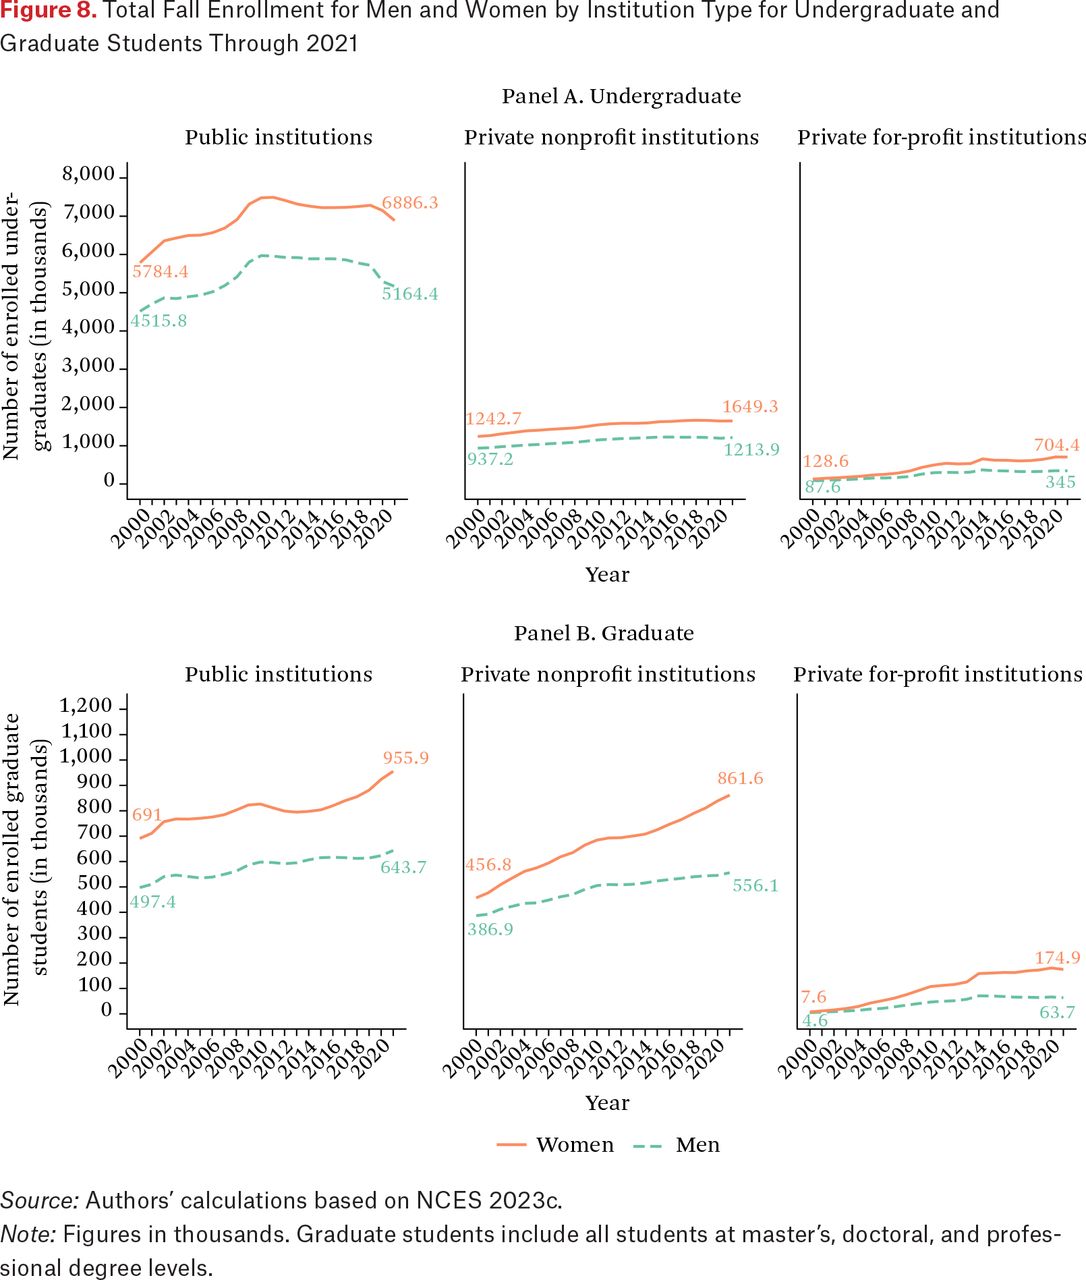
- Figure 8.
Total Fall Enrollment for Men and Women by Institution Type for Undergraduate and Graduate Students Through 2021
Source: Authors’ calculations based on NCES 2023c.
Note: Figures in thousands. Graduate students include all students at master’s, doctoral, and professional degree levels.
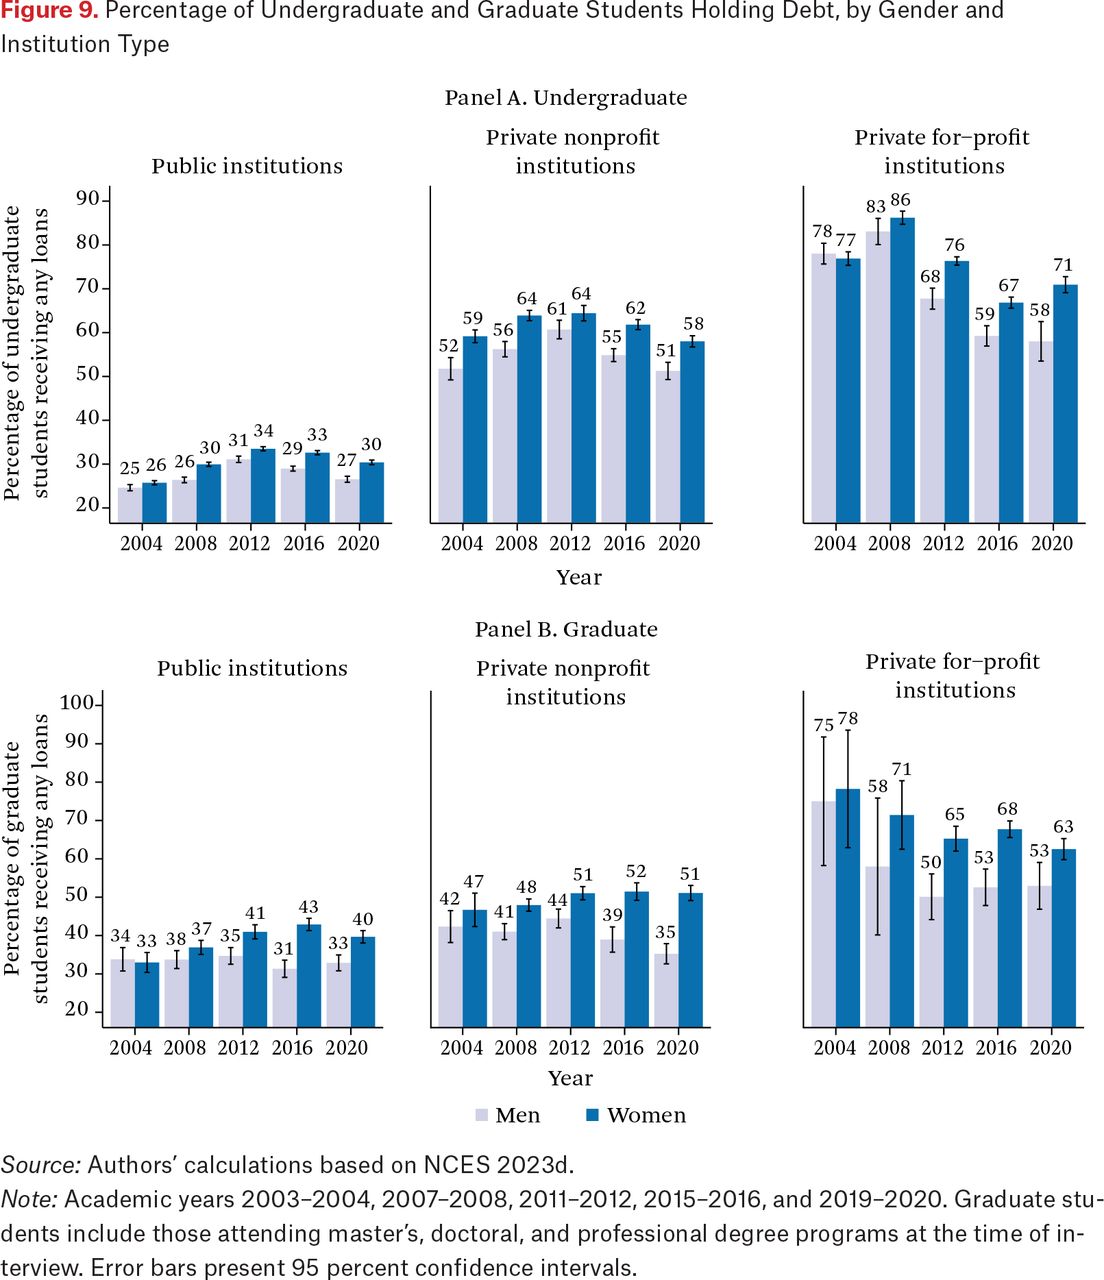
- Figure 9.
Percentage of Undergraduate and Graduate Students Holding Debt, by Gender and Institution Type
Source: Authors’ calculations based on NCES 2023d.
Note: Academic years 2003–2004, 2007–2008, 2011–2012, 2015–2016, and 2019–2020. Graduate students include those attending master’s, doctoral, and professional degree programs at the time of interview. Error bars present 95 percent confidence intervals.
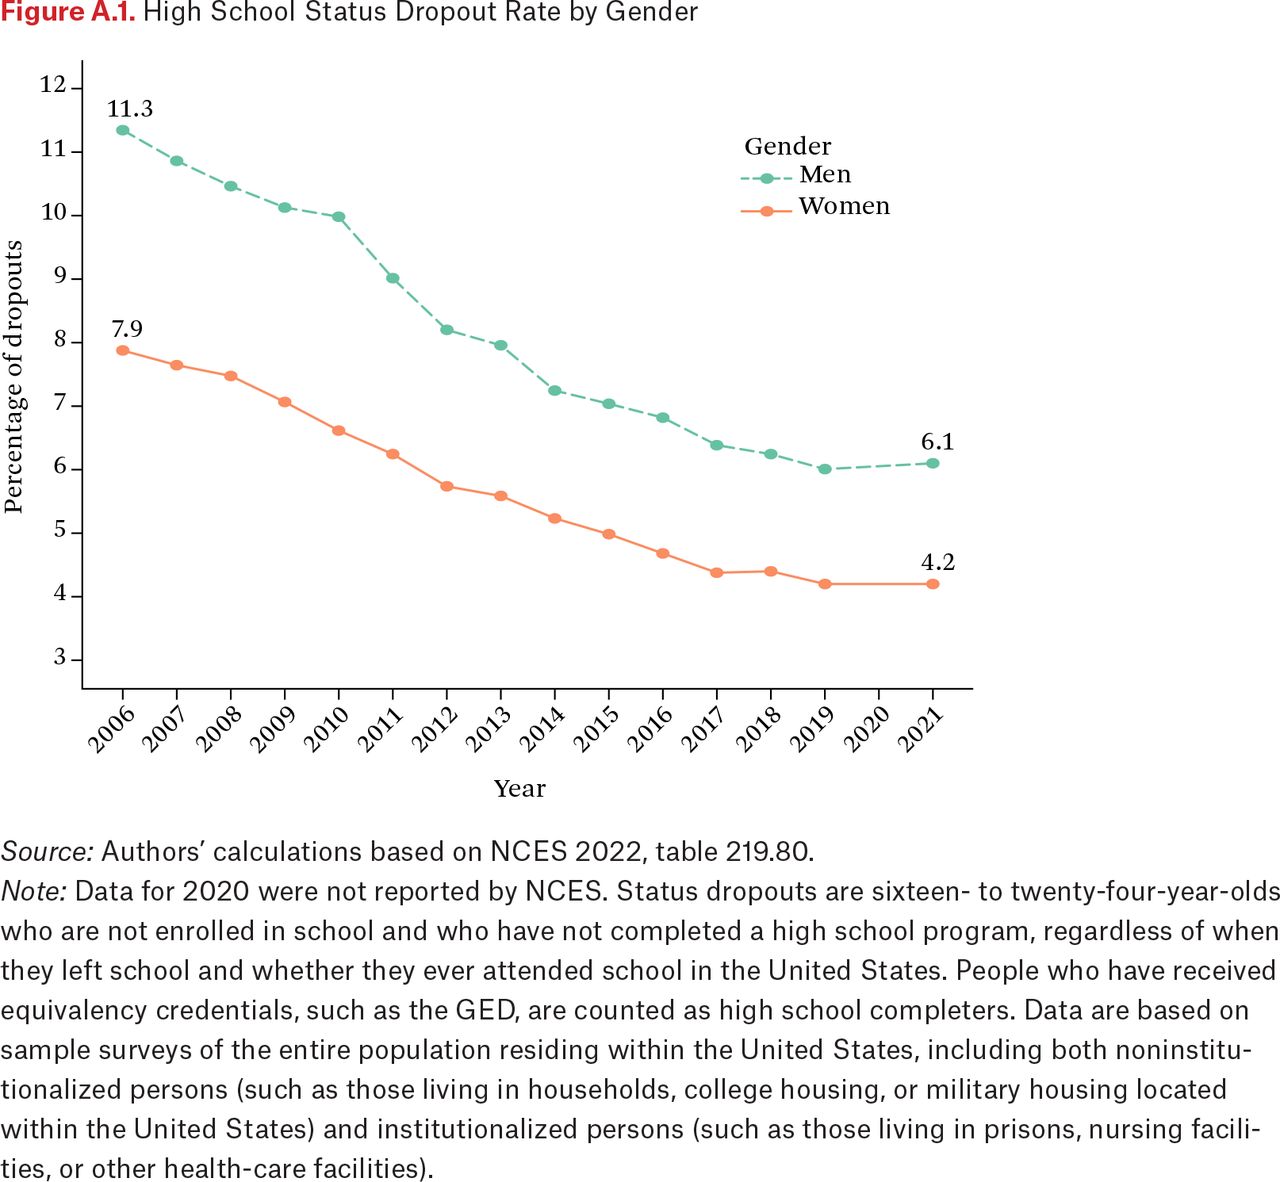
- Figure A.1.
High School Status Dropout Rate by Gender
Source: Authors’ calculations based on NCES 2022, table 219.80.
Note: Data for 2020 were not reported by NCES. Status dropouts are sixteen- to twenty-four-year-olds who are not enrolled in school and who have not completed a high school program, regardless of when they left school and whether they ever attended school in the United States. People who have received equivalency credentials, such as the GED, are counted as high school completers. Data are based on sample surveys of the entire population residing within the United States, including both noninstitutionalized persons (such as those living in households, college housing, or military housing located within the United States) and institutionalized persons (such as those living in prisons, nursing facilities, or other health-care facilities).
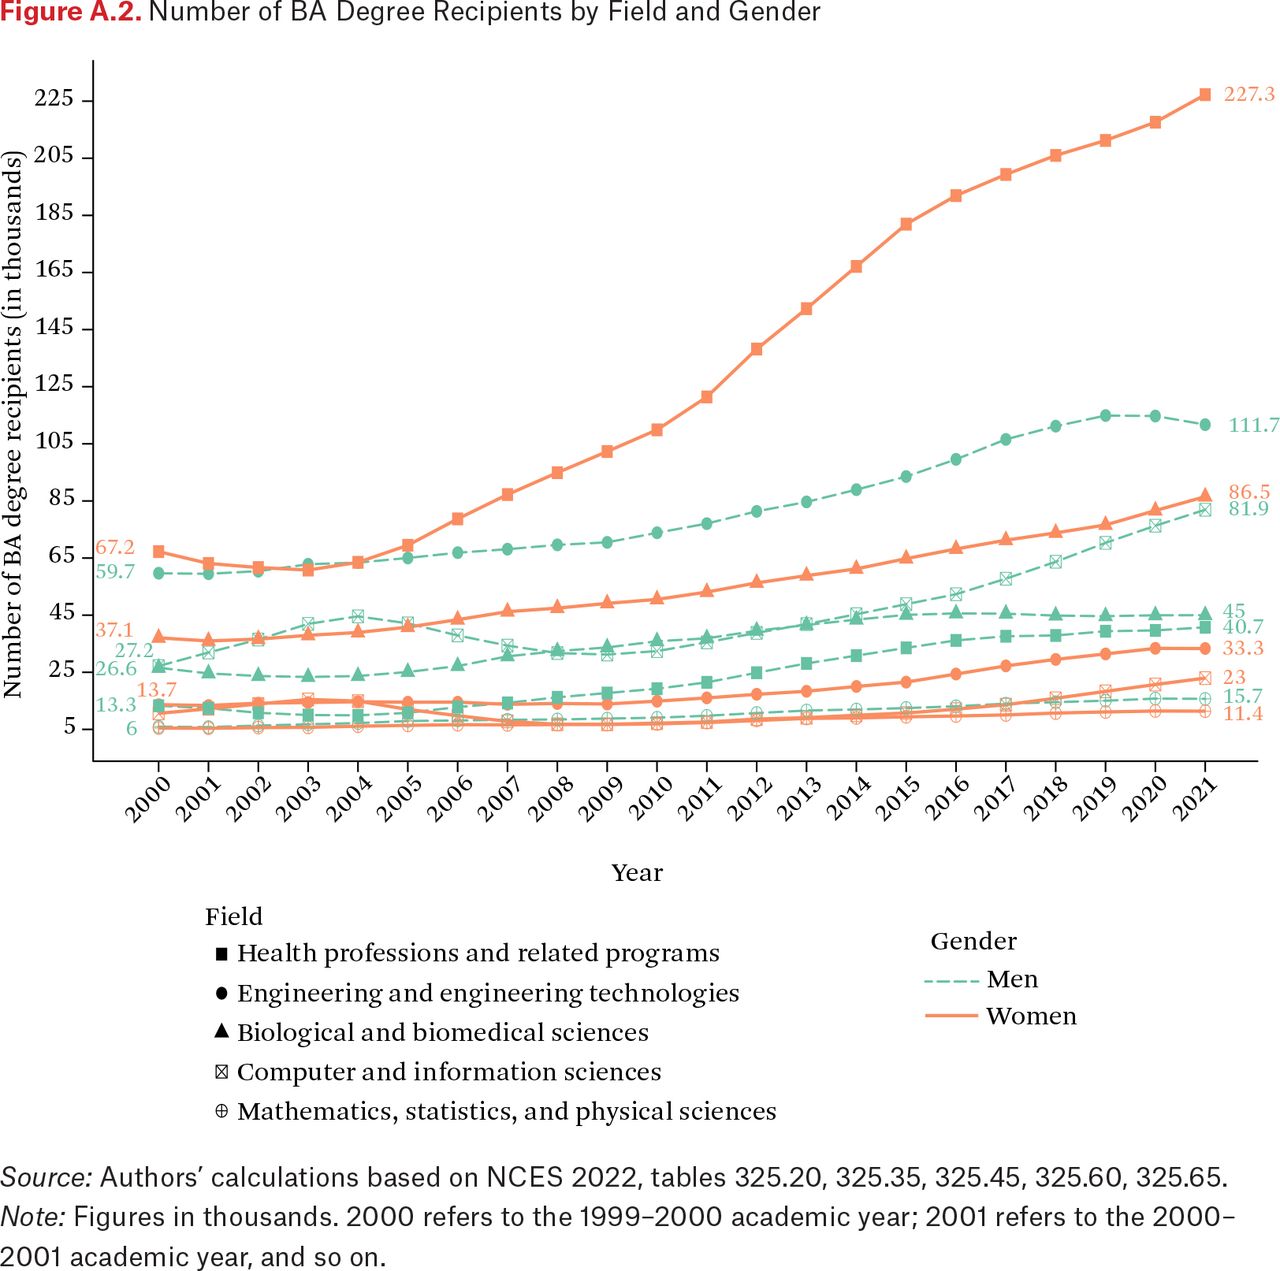
- Figure A.2.
Number of BA Degree Recipients by Field and Gender
Source: Authors’ calculations based on NCES 2022, tables 325.20, 325.35, 325.45, 325.60, 325.65.
Note: Figures in thousands. 2000 refers to the 1999–2000 academic year; 2001 refers to the 2000–2001 academic year, and so on.
- Figure A.3.
Total Undergraduate and Graduate Student Fall Enrollment for Men and Women by Institution Type, 2000–2021
Source: Authors’ calculations based on NCES 2023c.
- Figure A4.
Debt Amounts Held by Undergraduate and Graduate Students
Source: Authors’ calculations based on NCES 2023d.
Note: Error bars present 95 percent confidence intervals. 2004 denotes the 2003–2004 academic year, and so on. For undergraduate students, debt amount includes Parent PLUS loans. For graduate students, debt amount does not include Parent PLUS loans and includes Direct PLUS loans to graduate students. NPSAS did not report the debt amount among graduate students at for-profit institutions in 2004 because the standard error represents more than 50 percent of the estimate. Graduate students include those attending master’s, doctoral, and professional degree programs.


Tables

In this issue


Jump to section
Related Articles
Cited By...
- No citing articles found.