
Abstract
This article combines daily mobility data collected via mobile device and the American Community Survey to create comprehensive measures of activity space segregation across geographic areas in the United States. We extend conventional measures of spatial segregation to incorporate exposure in individuals’ routine activities, weighted by the flows of individuals between census block groups. Our analysis reveals three key findings. First, metropolitan areas vary significantly in the degree of activity space segregation. Second, individuals exhibit a lesser degree of income and racial segregation in their activity space than in their residential space. Third, income inequality at the metropolitan statistical area level is associated with greater isolation for both lowest and highest income groups; economic inequality exerts a more substantial influence on activity space isolation than residential segregation.
The segregation of individuals from different social groups into distinct physical and social spaces leads to the maintenance and reproduction of inequality. To measure segregation, social scientists have developed various models, especially those that focus on exposure between groups in their residential location (Theil and Finizza 1971; Massey and Denton 1988; Massey 2012; Reardon and Firebaugh 2002; Reardon and O’Sullivan 2004). These measures usually center on the sorting of residential location as a primary source of segregation, taking the distance between two residential communities into account. However, individuals may often interact with others beyond their residential neighborhoods, meaning that residential location and spatial distance may not fully capture the degree of segregation they experience in their everyday activities (Athey et al. 2021; Browning et al. 2021; Cagney et al. 2020; Nilforoshan et al. 2023; Wang et al. 2018; Zhang and Cheng 2024). Building on this literature, we modify the conventional spatial isolation index by adding another layer of exposure between communities: connections through the everyday mobility of individuals. Although recent studies have taken a social network approach to measure segregation using geocoded mobility data (Candipan et al. 2021; Echenique and Fryer 2007; Wang et al. 2018), they have not yet examined mobility-based segregation on a national scale or looked into the factors driving variations in segregation across metro areas. Using large-scale data on cross-census block group (CBG) population mobility in 384 U.S. metro areas, we construct measures of exposure to income and racial groups that are weighted by the flows of individuals between CBGs. These spatial and human mobility data, when combined with large-scale national surveys, afford an opportunity to create a more comprehensive and fine-grained measure of activity space segregation across geographic areas in the United States. Finally, we combine the metropolitan statistical area (MSA) measures of income and racial segregation in activity space with a large number of MSA-level covariates to examine the geographic variation of activity space segregation, with a particular focus on how MSA-level economic inequality shapes this geographic variation.
Our empirical analysis reveals substantial variation in income and racial segregation of activity spaces across metropolitan areas. Although the mobility-based isolation both income and racial groups experience tends to be lower than distance-based isolation, racial boundaries impose a more significant constraint on individuals’ daily activities than income disparities do. Income inequality at the MSA level is associated with greater relative isolation for both advantaged and disadvantaged racial and income groups. Moreover, although individuals tend to offset some of the residential segregation based on income and race through their daily activities, segregation within their activity space responds more sensitively to economic inequality compared to their residential space. Our results call attention to activity space as an especially pivotal domain of socioeconomic segregation in times of rising economic inequality.
FROM RESIDENTIAL SEGREGATION TO ACTIVITY SPACE SEGREGATION
Individuals from various racial and income groups are distributed unequally into local environments that shape the potential for accessing social and economic resources and group-specific contact (Reardon et al. 2008; Sharkey and Faber 2014). Most work focuses on capturing the local environment as the residential neighborhood, such as the census tract or block group in which an individual resides. An area is viewed as segregated if different groups are disproportionately allocated to residential neighborhoods. Beyond the home residential neighborhood, several studies have explored incorporating the spatial patterning of population distributions into measures of segregation (Grannis 2002; Massey and Denton 1988; Morrill 1991; Wong 2002). For instance, racially or economically homogeneous neighborhoods may also be encircled by similarly homogeneous ones, leading to the spatial concentration of certain racial and income groups. Therefore, group exposure can extend beyond the residential neighborhood into other spatially proximate locations. To account for this patterning, researchers have adapted segregation measures to define the local environment as the combination of the home community and communities that are close to the home community (Reardon and O’Sullivan 2004).
More recently, the literature on activity space has broadened the scope of the local environment to incorporate social spaces that individuals enter through their daily routines of commuting, working, schooling, and other activities (Browning and Soller 2014; Cagney et al. 2020; Jones and Pebley 2014; Wong and Shaw 2011). Spatial proximity appears to be an important factor in activity spaces, given that individuals may be more likely to spend time in places closer to home. Activity space, however, is not simply a function of physical distance between locations. Instead, the scope of a person’s daily encounters is determined by social, economic, and structural forces. High-income individuals may be well resourced (for example, owning a car or having access to reliable transportation) to make regular trips to neighborhoods not in close proximity, whereas low-income individuals may struggle with transportation insecurity that limits their mobility across neighborhoods (Edwards 2018; Murphy et al. 2022); racial minorities may avoid traveling to a nearby, majority-White neighborhood because racial minorities are stigmatized or marginalized in those communities, and members of majorities may feel uncomfortable going into minority neighborhoods (Anderson 2015).
To measure activity space, researchers have designed surveys in which individuals were asked to report their routine trips or activities (Browning et al. 2021; Jones and Pebley 2014). However, survey data are often limited by their relatively small sample sizes, which restricts their ability to analyze variations across geographic areas. To resolve this issue, certain recent studies have relied on digital trace data that track individuals’ movements and locations in real time (Athey et al. 2021; Bailey et al. 2018; Candipan et al. 2021; Sampson and Levy 2020; Song et al. 2010; Wang et al. 2018; Zhang et al. 2023). These studies document considerable differences in the everyday travels of individuals to poor and nonpoor neighborhoods depending on the racial and income composition of the home neighborhood (Candipan et al. 2021; Wang et al. 2018). Even though some studies find that activity space may closely match or even exceed the levels of segregation within residential spaces alongside growing economic inequality (Mijs and Roe 2021; Wang, Li, and Chai 2012), others find that activity space is often less segregated than residential space (Athey et al. 2021; Silm and Ahas 2014; Wang and Li 2016), or that there are only weak associations between residential and activity space due to factors such as access to transportation (Zenk et al. 2011; Wang and Li 2016). Together, this literature demonstrates the potential of real-time mobility data to reveal essential patterns of segregation in individuals’ daily activities beyond their residential location.
THE GEOGRAPHIC VARIATIONS OF ACTIVITY SPACE SEGREGATION
The degrees and mechanisms of spatial segregation have not been uniform across different areas in the United States. Research on residential segregation indicates that the degree of racial and income segregation at the metropolitan level depends on the composition and intersection of racial and income groups, the political context, the distribution of demographic characteristics such as nativity and age, occupational and industrial composition, economic inequality, schooling, housing, and other local policies (Abramson, Tobin, and VanderGoot 1995; Faber 2020; Massey 2020; Logan, Stults, and Farley 2004; Owens, Reardon, and Jencks 2016; Reardon and Bischoff 2011; Trounstine 2018). Research has also documented the negative influence of residential segregation on the equality of children’s socioeconomic opportunities by race and income (Chetty et al. 2014; Sharkey 2013; Sharkey and Faber 2014).
The growing availability of large-scale mobile device data provides a unique opportunity to examine the geographic variations in activity space segregation across the nation. Existing literature has mainly focused on the overall patterns of mobility and segregation in a few large cities or metropolitan areas (Moro et al. 2021; Wang et al. 2018). In contrast, our study is the first to explore the patterns and determinants of the geographic variations of income and racial segregation in individuals’ activity space. Through our analyses, we reveal the contextual factors that shape the connectedness (or lack of it) between communities, particularly those that experienced heightened economic inequality.
ECONOMIC INEQUALITY AND ACTIVITY SPACE SEGREGATION
Economic inequality has frequently been linked to segregation. Most of the literature focuses on the impact of inequality on spatial segregation due to residential sorting (Tammaru et al. 2020; Scarpa 2015; Watson 2009; Mutgan and Mijs 2023; Watson 2006; Jargowsky and Wheeler 2017; Quillian 2012). Studies have found that residential segregation has risen steadily alongside income inequality (Reardon et al. 2018; Watson 2009; Taylor and Fry 2012), but more recent literature accounting for bias due to sampling variation within census long form and American Community Survey (ACS) data found that it has actually remained fairly stable or risen only slowly since 1990 (Logan et al. 2020; Reardon et al. 2018). In particular, evidence suggests that residential segregation is driven mostly by high-income households (Reardon and Bischoff 2011) and households with children given their distinct preferences in schools and other neighborhood resources and features (Reardon et al. 2018; Owens 2016; Bernelius and Vaattovaara 2016). Many studies have also found that racial and ethnic differences play a role in the size of the relationship between economic inequality and residential segregation through discrimination, housing policy, or differential residential preferences (Logan et al. 2020; Reardon et al. 2018, 2008; Huffman and Cohen 2004; Watson 2009; Reardon and Bischoff 2011; Taylor and Fry 2012; Florida and Mellander 2018; Mulder 2013). Components of the built environment, like highways, street networks, and public transportation systems, may influence residential segregation (Reardon et al. 2008), and other cultural and socioeconomic preferences that develop as economic inequality increases may also have an impact (Smith, McPherson, and Smith-Lovin 2014).
However, the literature to date has not captured how individuals experience the impacts of economic inequality on segregation in their daily lives (Järv et al. 2021). The concept of activity space effectively encapsulates various locations where potential segregation may occur, such as residential spaces, workplaces, educational institutions, and places of leisure and other nonemployment activities (Mijs and Roe 2021; Schwanen and Kwan 2012). Some research argues that patterns of residential segregation can expand to activity space segregation, given that people spend significant time in and around their homes (Schwanen and Kwan 2012; Krivo et al. 2013). However, the mechanisms underpinning segregation in daily activities, when outside home locations, might diverge from those propelling residential segregation.
Along with their home, people spend a significant amount of their time at their workplaces (Blair and Lichter 1991). Although some evidence suggests that workplaces are becoming increasingly integrated between groups of varying economic and racial-ethnic groups (Estlund 2003), other work maintains that gaps between the workplaces of economic groups are increasing (Mijs and Roe 2021), and that Blacks specifically are segregated into jobs because of discrimination, residential segregation, and network differences (Hellerstein and Neumark 2008). This may be especially true in areas with a high concentration of Blacks (Huffman and Cohen 2004). The connection between residential and workplace segregation is also mixed, with some studies suggesting they are weakly correlated (Tammaru et al. 2016) and others suggesting they go in opposite directions (Hall, Iceland, and Yi 2019; Ellis, Wright, and Parks 2004). Educational institutions provide another potential space for segregation, with schools often reflecting the inequality of neighborhoods or being more segregated than the neighborhoods themselves (Boterman et al. 2019; Burgess, Wilson, and Lupton 2005).
Activities that are carried out beyond the home, work, and school can also be significant sources of interaction or segregation in activity spaces. Differential preferences in leisure activities (Kamenik, Tammaru, and Toomet 2014; Tammaru, Marcińczak, and Kukk 2018) and religious and cultural institutions (Hellerstein and Neumark 2008) can provide separation between economic and racial groups. Higher-income individuals typically spend more on leisure activities in general (Karonen and Niemelä 2022) and engage in more recreational activities than low-income individuals (Petersen et al. 2021), who often must look for low-cost and easily accessible leisure opportunities (Cantor et al. 2022).
Across these areas, economic inequality may affect the isolation experienced by income groups in different ways. Residential spaces sorted into by low and high income groups often exhibit disparate characteristics, including accessibility to public spaces, public transportation, amenities, and activities (Reardon et al. 2008). The increasing disparities in these resources, as inequality grows, could lead to increased isolation among low income groups in residential spaces. Further, workplace segregation between low-wage and high-wage jobs may increase with inequality (Mijs and Roe 2021), which may further isolate low-income groups. Disparities in leisure activity preferences and options can also worsen with increasing economic inequality (Toger et al. 2023). Although some studies show that individuals’ activity choices depend more on how they see their social status than any actual measure of inequality, inequality does partially explain this distinction (Järv et al. 2021). In addition, rising economic segregation due to economic inequality may be more significant within minority populations (Reardon and Bischoff 2011; Florida and Mellander 2018), combining with existing racial segregation to compound isolation (Sharkey 2013).
RESEARCH QUESTIONS
Our research investigates mobility-based segregation across metropolitan areas, guided by three distinct questions: How does mobility-based segregation by race and income vary across metropolitan areas? How do mobility-based segregation measures differ from distance-based segregation measures? Does economic inequality increase isolation in individuals’ activity space, net of other contextual characteristics? To answer these questions, we use a combination of the most recent census data and large-scale daily mobility data.
Data
Our data fall into three categories: community, mobility, and metropolitan.
Community Characteristics
Our basic units of community-level analysis are census block groups (CBG). We obtain CBG-level demographic characteristics via American Community Survey’s 2015–2019 five-year data. We retrieve each CBG’s racial and income composition data as well as other features such as poverty, education, and unemployment. Based on racial composition, we create a Race variable to indicate the predominant race of the community, including Asian, Black, Hispanic, White, and Mixed. For instance, if a CBG’s non-Hispanic Whites exceed 50 percent, we treat this CBG as White; if no racial group dominates in a CBG, we treat it as mixed. Similarly, we quantile the median household income (that is, Q1–Q4) to create the Socioeconomic Status variable to capture the relative socioeconomic position of each CBG. Q1 indicates the bottom 25 percent, and Q4 economically advantaged communities.1
Mobility Data from SafeGraph’s Mobile Device Records
To capture individuals’ daily movement, we obtain large-scale mobility flows across neighborhoods via SafeGraph COVID-19 Data Consortium, which contains origin-to-destination (O-D) flow data at the CBG level. We focus on 2019 for our empirical analysis to ensure data coverage consistency and to avoid the impact of the COVID-19 pandemic on mobility patterns (Zhang and Cheng 2024). The construction of between-CBG flows takes the following steps. First, SafeGraph uses a mobile device’s common nighttime (6 p.m. to 7 a.m. local time) location over the last six-week period at the level of Geohash-7 granularity (153m × 153m) to define the home CBG. Second, SafeGraph tracks detailed mobility flow information from origin to destination places (such as restaurants, schools, hospitals, and churches) based on GPS pings from millions of anonymous mobile devices. Third, SafeGraph then aggregates all devices by home CBGs after applying deferential privacy to device count metrics by adding the Laplacian Noise to anonymize residents at the CBG level.2 The aggregated data includes the number of daily visits between CBGs, as well as the number of unique devices in each CBG. Although the SafeGraph data present a valuable opportunity to investigate group exposure in daily life, using the count of unique devices in the SafeGraph data as a proxy for the underlying population may lead to issues with the coverage and representativeness of the sample. In the methodological appendix, we provide a more detailed discussion of these limitations and outline how they affect our analytic strategies.
Metropolitan Area Characteristics
We use the 2015–2019 individual-level data from the ACS obtained from the Integrated Public Use Microdata Series (IPUMS) to construct covariates at the level of metropolitan areas. Individual-level covariates include race and ethnicity, education level, employment and labor-force status, occupation groups, and total personal income measures. Household-level covariates include single-parent household and poverty status and total household income measures. This analysis is based on 15,947,624 unique individuals and 6,989,126 unique households from 261 MSAs, with all other MSAs unidentifiable due to their small sizes in the ACS data. A summary of covariates used in the analysis is shown in table 1.
Mean and Standard Deviation of Household- and Individual-Level Covariates Across MSAs
Measures of Mobility-Based Segregation
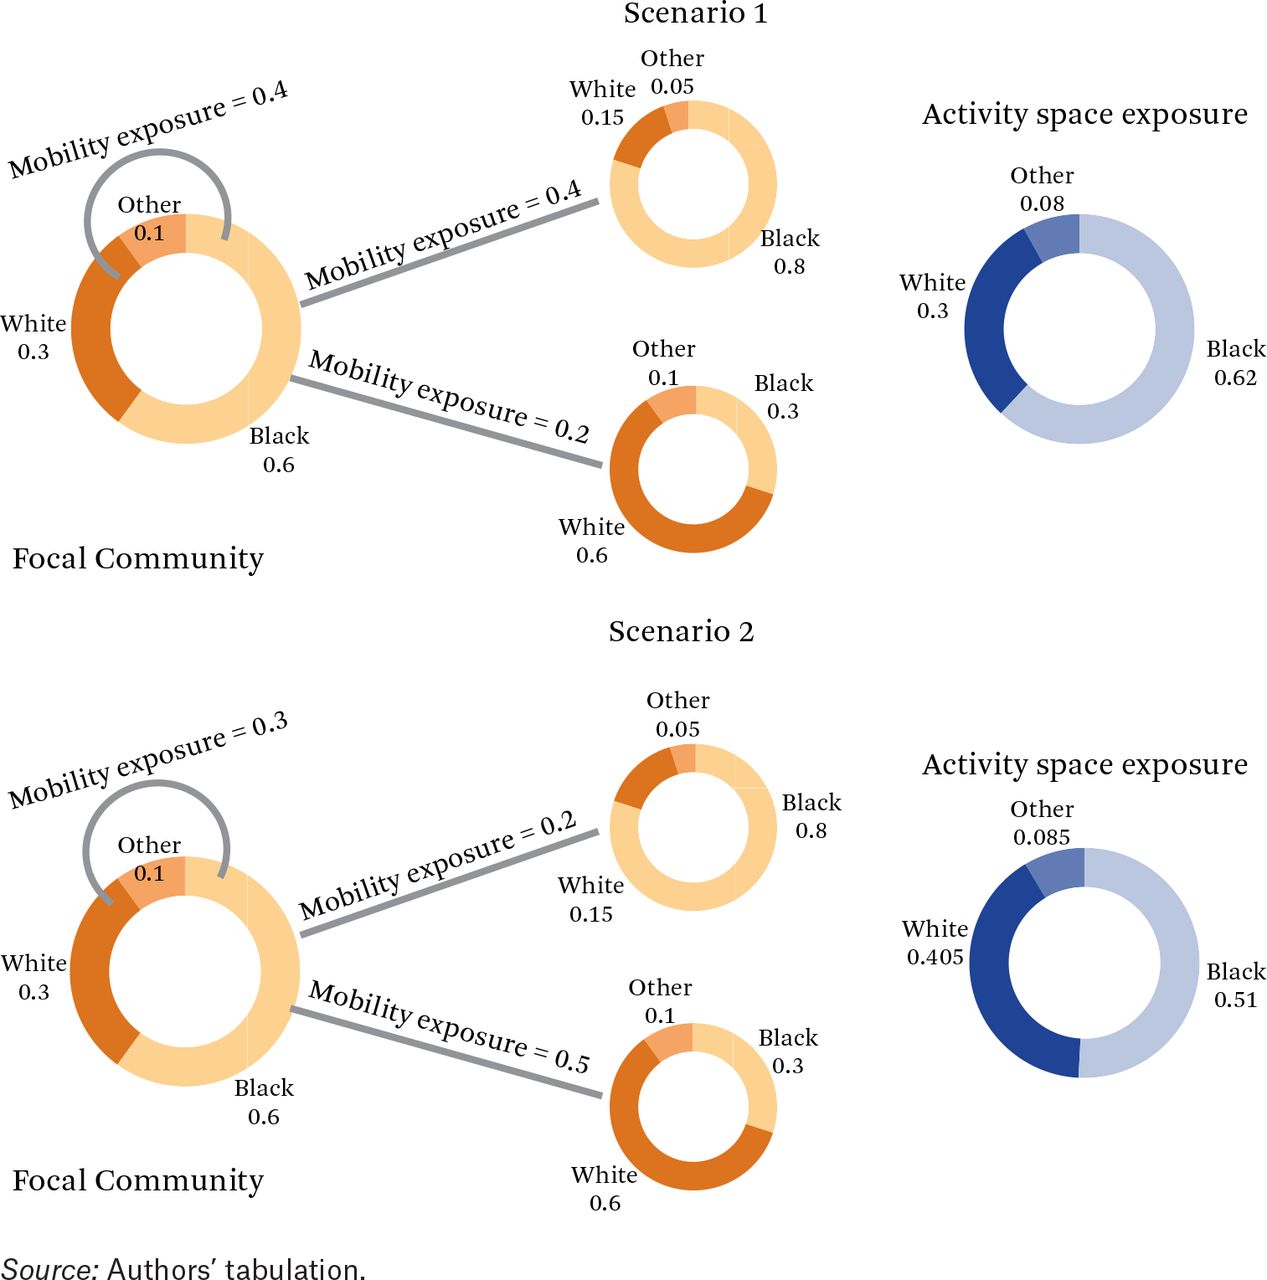
To introduce our key measures, we begin with a graphical illustration for mobility-based group exposure in two scenarios (figure 1). The plots depict the racial makeup of a focal community alongside two others visited by its residents. The intensity of within- and between-community travel, labeled mobility exposure, is indicated by the thickness of the lines linking these communities. The plots on the right represent each individual’s exposure to racial groups in the activity space, calculated as the weighted average of the racial compositions of the three communities, with weights corresponding to mobility exposure levels. The two hypothetical scenarios shown in this figure involve the same communities but vary in the patterns of mobility. Scenario 1 shows a marked tendency to travel to a community with a higher percentage of Black residents, resulting in increased exposure to Black individuals in activity space relative to residential space (0.62 versus 0.6). Conversely, Scenario 2 depicts greater tendency to travel to a majority White community, leading to reduced exposure to Black individuals (0.51 versus 0.6). This comparison underscores the fundamental aspect of our mobility-based segregation measures, highlighting how individuals with similar residential environments may encounter different racial group exposures based on their mobility patterns.

Graphic Illustration of Mobility-Based Measures of Group Exposure
Source: Authors’ tabulation.
We now describe the formalization of the mobility-based exposure measures illustrated in figure 1. First, to capture mobility exposure, we use the Mobility connectedness index (MCI) between each pair of CBGs (p and q) in a given period T:
where p and q represent two CBGs, d denotes the d−th day, Visitspq indicates the daily visits from p to q, and devices denote the number of unique devices in a given CBG. We normalize MCI by dividing the maximum value of the raw MCI score so that it ranges from 0 to 1 (Zhang and Cheng 2024).
We then follow prior work (Reardon and O’Sullivan 2004; Zhang and Cheng 2024) and define a discrete measure of local mobility exposure  as
as
local mobility exposure
Here K is the number of communities in the mobility network (such as within an MSA), τ k is the population density of the k−th CBG, π km is the proportion of group m in the k−th CBG. LME to group m can be seen as a weighted average of the CBG-level proportion of group m (shown in the right plots of figure 1), where the weights are proportional to the mobility flows and population density of all communities visited by residents in the home community.
We highlight two important characteristics of our mobility-based exposure measures. First, it is crucial to interpret these metrics not as explicit indicators of interpersonal interactions, but as proxies of group-based exposure that allows for potential social interaction. Second, our measures rely on two assumptions (for a more in-depth discussion of these two assumptions, see Zhang and Cheng 2024). The nonselective mobility assumption is that within the same origin community, individuals traveling between CBGs are not systematically distinct from those who do not. The nonselective exposure assumption is that within the same destination community, individuals do not differ systematically in their exposure to varied racial and income groups. Although the lack of individual-level mobility data precludes direct assessment of these assumptions, at the end of empirical results, we will delve into a more detailed discussion regarding potential deviations from these assumptions. We also conduct sensitivity analysis to assess their potential impact on our findings.
Region-Wide Mobility Exposure
We define the region-wide mobility exposure as
Region-wide mobility exposure:

Here Nkm is the population of group m in the k−th CBG, and Nkm/Nm expresses it as a proportion of the total population of group m in the region. Our analysis defines a region as a metropolitan area. In addition, we also compare mobility-based segregation measures with distance-based group exposure measures. We describe our measure of distance-based group exposure in the methodological appendix.
Finally, to capture the degree of group isolation, two measures are considered. First, absolute isolation of group m captures the MSA-wide intragroup exposure of group m. For example, Blacks’ absolute isolation can be measured by the MSA-level exposure of Blacks to Blacks. However, this absolute measure does not take into account the marginal composition of group m in MSA. For example, a higher exposure of Black individuals to other Blacks may simply result from a high proportion of Blacks in the MSA. To adjust for compositional differences, we then construct relative isolation of group m, defined as the MSA-wide intragroup exposure of group m minus region-wide intergroup exposure between group m and n, as our preferred measure of group isolation. By taking the difference between these two quantities, relative isolation measures net out the influence of the MSA-level marginal composition. For example, Black’s relative isolation can be measured by the difference between Blacks’ exposure to Blacks and Whites’ exposure to Blacks in the same MSA. Relative isolation measures can be computed for both distance- and mobility-based segregation. We focus here on relative isolation as our key outcome measure.
GEOGRAPHIC VARIATIONS IN THE RELATIVE ISOLATION OF INCOME AND RACIAL GROUPS
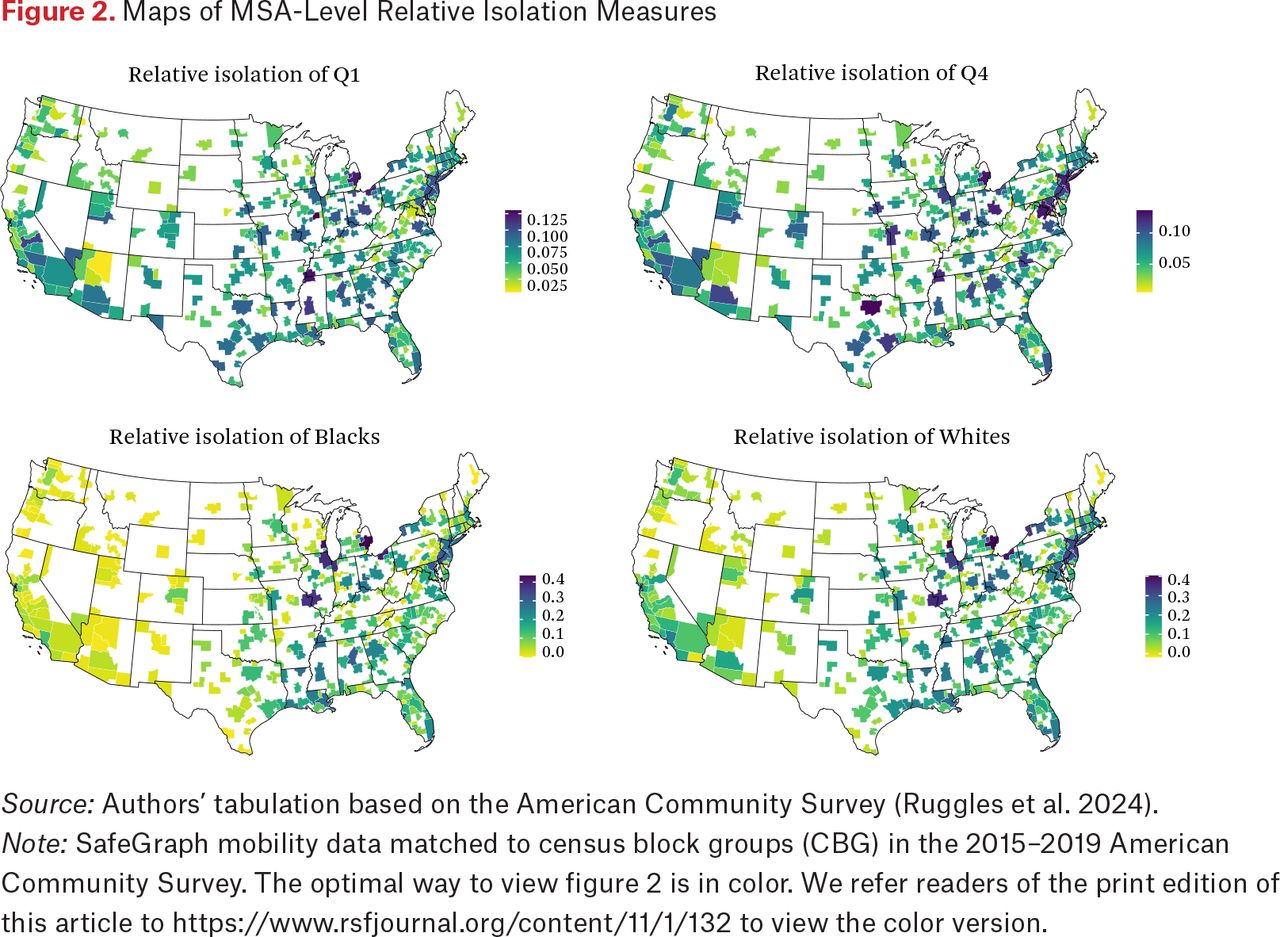
In figure 2, we present maps illustrating the geographic distribution of income and racial group isolation. These visualizations reveal significant differences in activity space isolation across metropolitan areas. Generally, regions where more advantaged groups (Q4 and Whites) experience higher levels of isolation also see greater isolation among more disadvantaged groups (Q1 and Blacks). However, the degree of this isolation varies considerably from one metropolitan area to another.

Maps of MSA-Level Relative Isolation Measures
Source: Authors’ tabulation based on the American Community Survey (Ruggles et al. 2024).
Note: SafeGraph mobility data matched to census block groups (CBG) in the 2015–2019 American Community Survey. The optimal way to view figure 2 is in color. We refer readers of the print edition of this article to https://www.rsfjournal.org/content/11/1/132 to view the color version.
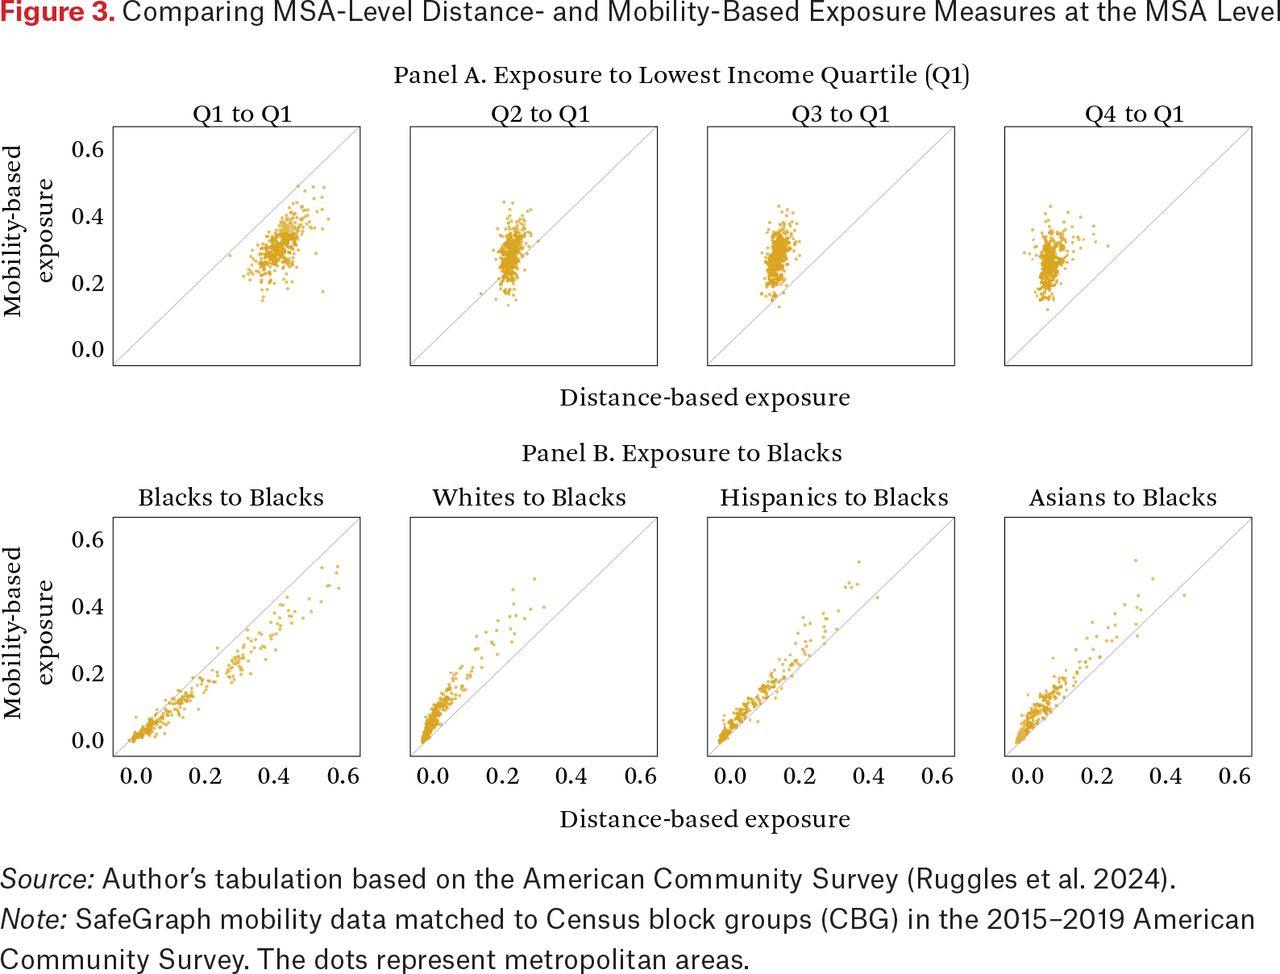
A core premise of our research is that an individual’s activity space offers a distinct perspective on both intra- and intergroup exposure, setting it apart from traditional distance-based segregation metrics. In our subsequent analysis, we delve deeper into the relationship and disparities between these measurement types at the MSA level. As shown in figure 3, the overall correlation is positive between distance-and mobility-based exposure measures, with the lines marking points where both measures are identical. For income groups, the link between mobility- and distance-based exposure metrics is generally weak, except in the case of intragroup exposure from Q1 to Q1. This implies that the daily mobility patterns of higher-income individuals are not tightly bound by spatial distance. Conversely, when it comes to race, both measurement types align more closely. MSAs with pronounced distance-based exposure to Blacks typically also show heightened mobility-based exposure. However, the strength of this alignment diminishes as distance-based exposure to Blacks increases.

Comparing MSA-Level Distance- and Mobility-Based Exposure Measures at the MSA Level
Source: Author’s tabulation based on the American Community Survey (Ruggles et al. 2024).
Note: SafeGraph mobility data matched to Census block groups (CBG) in the 2015–2019 American Community Survey. The dots represent metropolitan areas.
Another critical observation from the exposure patterns of both income and racial groups is the position of the dots in relation to the 45-degree lines. For intragroup exposure (leftmost plot), dots lie below this line, whereas for intergroup exposure (the other three plots), they are positioned above it. This indicates that individuals tend to experience less intragroup exposure in their daily activities than in their residential surroundings. In contrast, they have greater intergroup exposure in their daily activity spaces.3 Essentially, this suggests that although the lowest income group and Blacks might experience isolation within their physical communities, they often engage with more diverse income and racial groups in their daily activities, traveling beyond their immediate surroundings to do so.
ECONOMIC INEQUALITY AND ACTIVITY SPACE SEGREGATION
Next, we explore the association between MSA-level economic inequality and segregation of income and racial groups. We estimate regression models that predict relative isolation measures at the MSA level using various measures of economic inequality while controlling for a large set of MSA-level characteristics.4 We measure economic inequality in two ways: first, we use the Gini coefficient and the variance of log income to capture the overall dispersion of household income; second, we use the 90:50 ratio (the ratio between the 90th and 50th percentile of income) and 50:10 ratio (the ratio between the 50th and 10th percentile of income) to capture the potential asymmetric impact at the two ends of the income distribution. The MSA-level controls include median household income, percentage of different racial-ethnic groups, percentage of individuals with a college degree, percentage of individuals with an advanced degree, percentage unemployed, percentage of Black individuals unemployed, percentage of families with zero annual income, percentage of single-parent household, percentage of households with children under five years of age, percentage of households in poverty, percentage of Republican-leaning voters, average population density, percentage married, and percentage foreign born. The full regression results are reported in the online supplement.5

Coefficients from Regression Models Predicting Relative Isolation of Q1 and Q4 Income Groups
Source: Authors’ tabulations based on the American Community Survey (Ruggles et al. 2024).
Note: SafeGraph mobility data matched to census block groups (CBG) in the 2015–2019 American Community Survey. The error bars show 95 percent confidence intervals. All regression models are weighted by MSA population size. The full regression results are reported in the online supplement.
Figure 4 shows the coefficients from the regression models predicting relative exposure of Q1 and Q4. The two plots in the upper panel examine how overall dispersion of household income—measured using the Gini coefficient and the variance of log income—affects isolation at the top and bottom of the income distribution. Net of a host of MSA-level characteristics, higher income inequality significantly increases relative isolation of both Q1 and Q4. That is, high- and low-income individuals living in areas with a heightened level of income inequality have a greater tendency to be in contact with their group members during their daily activities.
Income gaps at the higher and lower ends of the spectrum have distinct effects on the segregation of activity spaces for disadvantaged and advantaged groups. To illuminate this asymmetry, the two plots at the bottom of the figure differentiate the impacts of income disparities at the upper (90th percentile) and lower (10th percentile) ends of the spectrum. Notably, larger income gaps at the top end positively increase the isolation of both the highest- and lowest-income groups. This can be attributed to heightened social closure at the top and the shifts of resources away from the bottom tiers. By contrast, income disparities at the lower end mainly affect the most disadvantaged group. Essentially, the wider the gap between the lowest earners and the median income, the more these disadvantaged groups are marginalized in their daily activities.
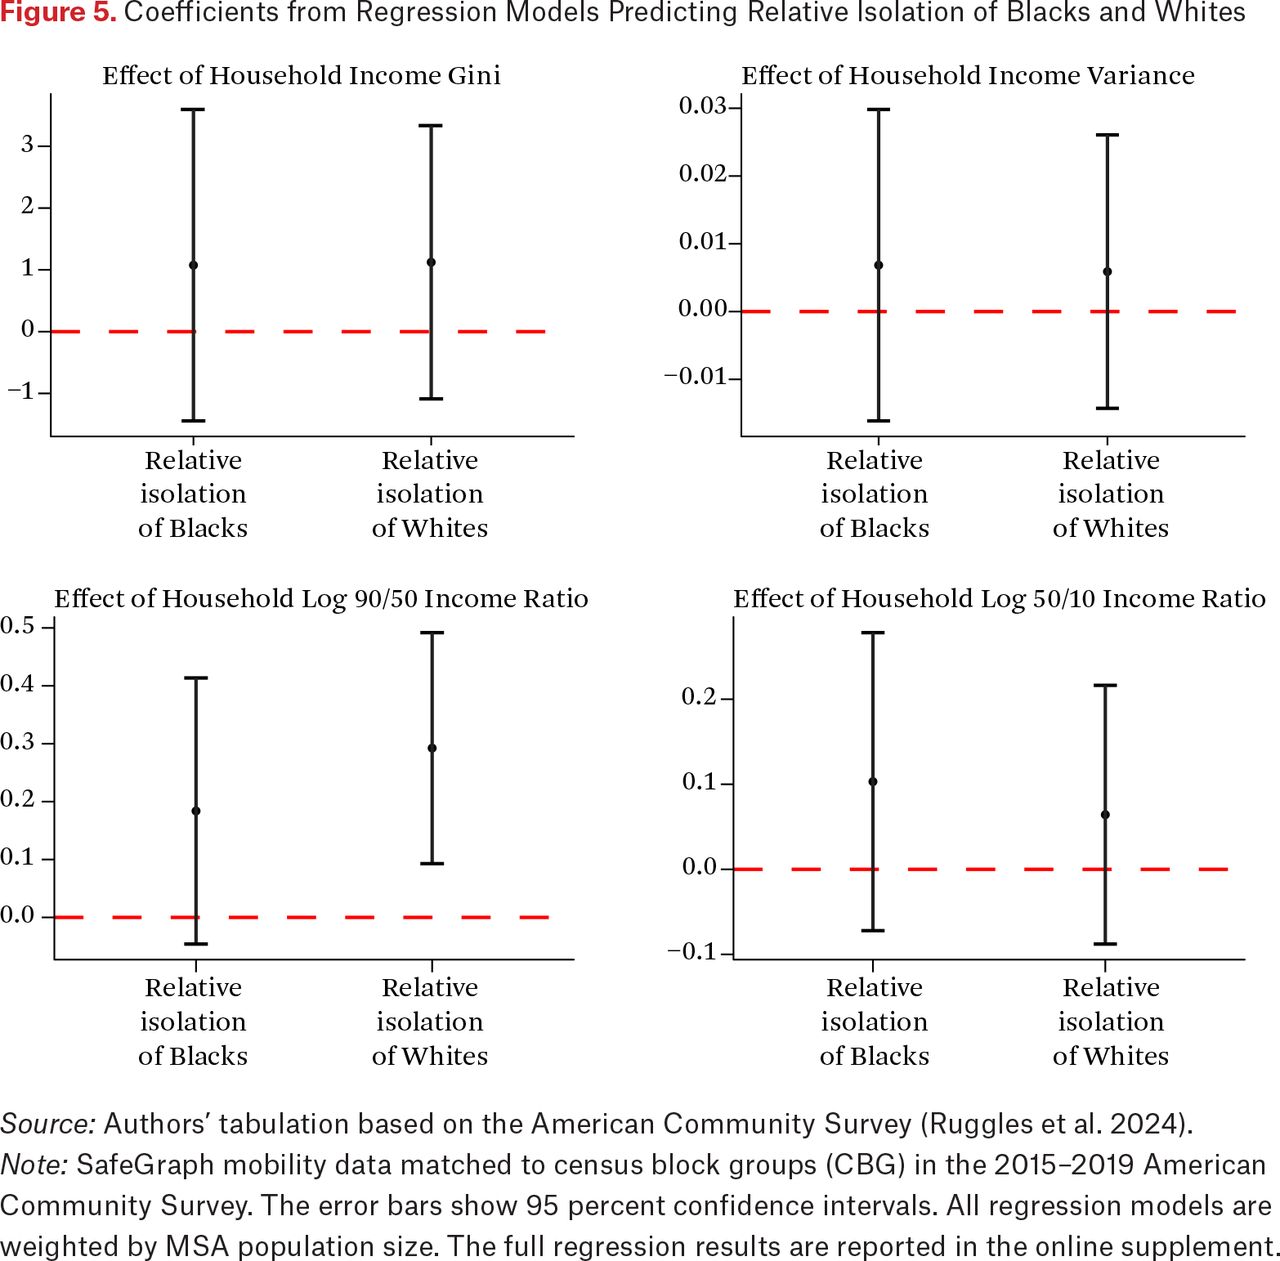
Figure 5 illustrates the impact of economic inequality on the isolation within the activity spaces of Black and White populations. Remarkably, overall income inequality does not exhibit a statistically significant influence on racial isolation. Nonetheless, this overall dispersion conceals the asymmetric effects observable at the upper and lower echelons of the income distribution. A pronounced income disparity at the upper end intensifies the relative isolation of White individuals but not of Black individuals. Combining these results with the preceding results concerning income segregation, the findings suggest that, although economic inequality amplifies the isolation of income groups within individuals’ activity spaces, the isolation encountered by racial groups remains substantially less influenced by such economic disparities. This also implies that reducing economic inequality alone is not enough to alleviate racial segregation in activity space.

Coefficients from Regression Models Predicting Relative Isolation of Blacks and Whites
Source: Authors’ tabulation based on the American Community Survey (Ruggles et al. 2024).
Note: SafeGraph mobility data matched to census block groups (CBG) in the 2015–2019 American Community Survey. The error bars show 95 percent confidence intervals. All regression models are weighted by MSA population size. The full regression results are reported in the online supplement.
Earlier we demonstrated that the isolation faced by income and racial groups is less pronounced in activity space than in residential space. However, it remains unclear whether economic inequality affects both segregation measures similarly. We now delve into the influence of economic inequality on these measures, with a focus on the impact on the lowest income group. Given the differing scales of mobility- and distance-based isolation metrics, we first normalize the inequality indicators and outcomes to achieve a mean of zero and a standard deviation of one. As depicted in figure 6, economic inequality exerts a greater impact on mobility-based isolation than on distance-based measures. Intriguingly, the effects on the distance-based metrics are not statistically significant when other MSA-level characteristics are controlled for. This indicates that, although the lowest-income bracket might increase their interaction with higher-income groups during daily activities to counterbalance residential isolation, their daily mobility-driven interactions with other groups are more significantly hindered by rising economic disparity than their interactions in residential areas.

Comparing Effects of Income Inequality on Distance- and Mobility-Based Measures of Group Isolation
Source: Authors’ tabulation based on the American Community Survey (Ruggles et al. 2024).
Note: SafeGraph mobility data matched to census block groups (CBG) in the 2015–2019 American Community Survey. The error bars show 95 percent confidence intervals. All regression models are weighted by MSA population size. The full regression results are reported in the online supplement.
SENSITIVITY ANALYSES: POTENTIAL DEVIATIONS FROM KEY ASSUMPTIONS
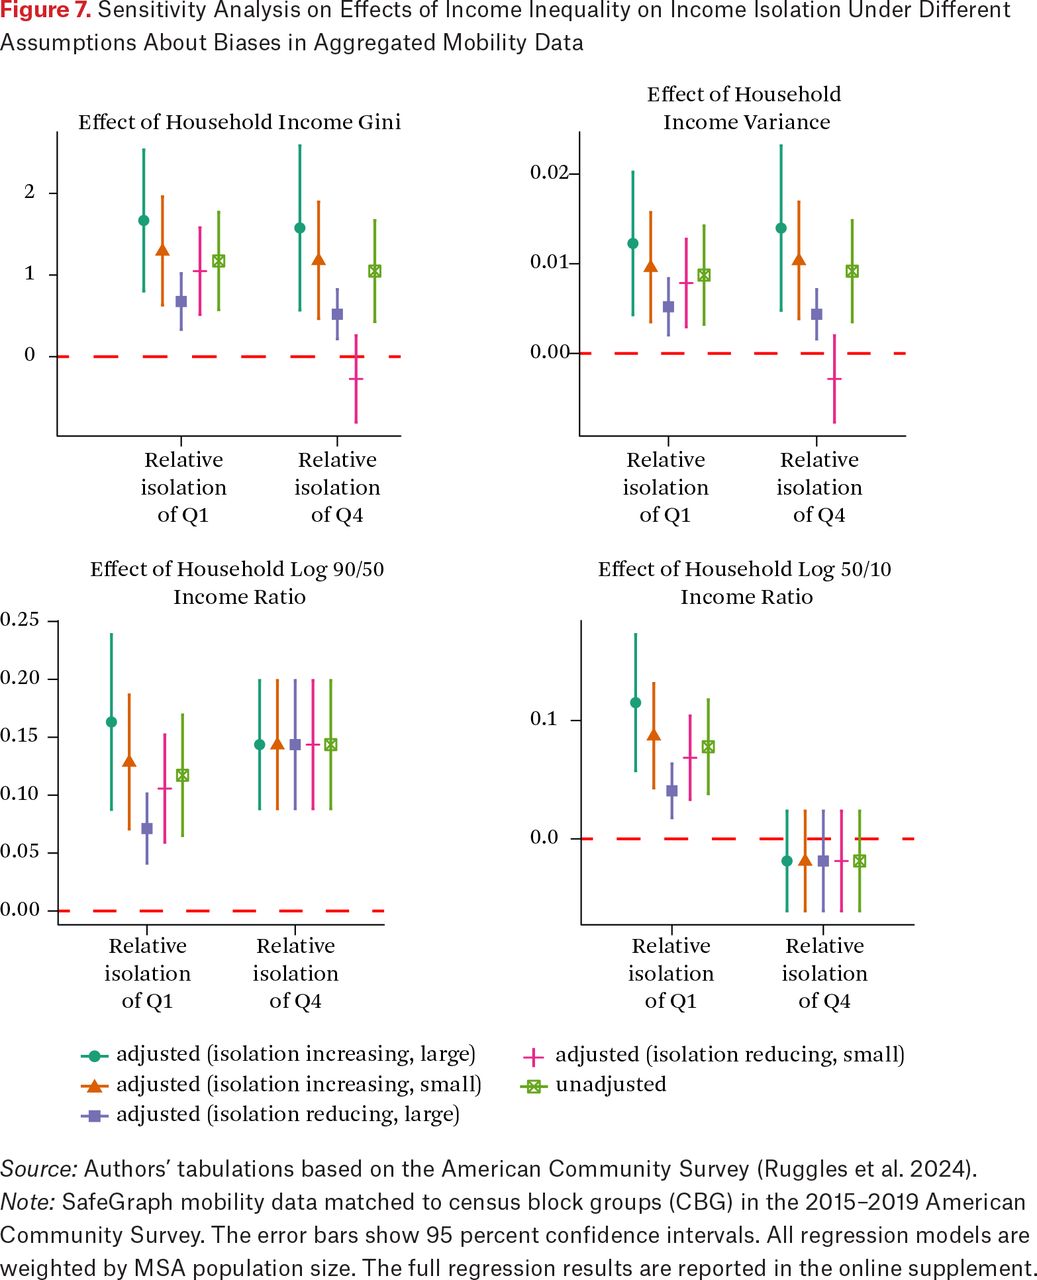
When we introduced our segregation measures, we stressed that measuring mobility patterns at the community level rather than the individual level may mask some important heterogeneity in mobility patterns within origin and destination communities. For example, it may be that, within low-income communities, those with lowest income levels are least likely to travel out of their communities. This deviates from the nonselective mobility assumption discussed earlier and may lead to an underestimation of the actual level of isolation among low-income individuals. On the other hand, if high-income individuals are more likely to be exposed to high-income groups in the destination community, this deviates from the nonselective exposure assumption and can also lead to an understatement of high-income group’s isolation in activity space. Table 2 summarizes some possible deviations from these two assumptions and their implications for group isolation, focusing specifically on the case of income. Without individual-level mobility data, we cannot directly assess the influence of such heterogeneity. Instead, as sensitivity analysis, we conduct simulations assuming that such selectivity has a greater influence on relative isolation in MSAs with a larger proportion of high-income households. Specifically, we formulate the influence on relative isolation as a linear function of the proportion of the lowest and highest income quartiles in each MSA. A small impact of selectivity on isolation is defined as a 0.5 percentage increase in relative isolation corresponding to 1 percentage point increase in the proportion of Q1 or Q4, and a large impact as a 2 percentage increase. Figure 7 shows the resulting coefficients on economic inequality assuming different directions (increasing versus decreasing isolation) and sizes (small versus large) of such impact. The figure suggests that the effect of economic inequality on isolation is greater when accounting for the possible isolation-increasing effects of within-community heterogeneity, and this effect gets smaller (but remains mostly statistically significant) when the within-community heterogeneity is assumed to have the effect of reducing isolation. Although our simulations remain speculative, we urge future research to further examine the within-community heterogeneity of mobility-based exposure, particularly when data on individual-level mobility patterns become available.
Possible Deviations from Assumptions and Their Implications

Sensitivity Analysis on Effects of Income Inequality on Income Isolation Under Different Assumptions About Biases in Aggregated Mobility Data
Source: Authors’ tabulations based on the American Community Survey (Ruggles et al. 2024).
Note: SafeGraph mobility data matched to census block groups (CBG) in the 2015–2019 American Community Survey. The error bars show 95 percent confidence intervals. All regression models are weighted by MSA population size. The full regression results are reported in the online supplement.
DISCUSSION
This study contributes to the literature on inequality and segregation by examining the geographic variations in the segregation of racial and income groups in their everyday activity space. Despite increasing racial diversity and policy efforts to combat income inequality, racial minorities and low-income individuals continue to live in segregated communities, and the degree and patterns of subgroup segregation vary from place to place. Studies on residential segregation have been conducted extensively, yet only recently have scholars started to incorporate information on experiences of individuals’ activity space into measures of intra- and intergroup exposure. Even though recent research has significantly advanced our understanding of activity space segregation patterns, to our knowledge, our study is the first to examine how geographic variations in activity space segregation are associated with economic inequality—a question that bears crucial policy implications in an era of escalating inequality.
Our empirical analyses, which combined large-scale data collected on mobile devices with recent data from the American Community Survey, yielded three major findings. First, the exposure of disadvantaged groups (that is, Blacks and low-income individuals) to their own group relative to more advantaged groups (Whites and high-income individuals) vary dramatically across metropolitan areas. Second, when we contrasted our mobility-based exposure measures with distance-based exposure measures across metropolitan areas, the degree of isolation experienced by Blacks and low-income individuals in their activity space was less than in their residential space. Relative to that of income groups, the correlation is stronger between Blacks’ exposure in their activity space and their exposure in residential space, which suggests that racial boundaries exert a greater constraint on individuals’ day-to-day activities than income differences do.
More importantly, our findings underscore that economic inequality intensifies activity space segregation. Net of a host of MSA-level characteristics, higher income inequality increases relative isolation of both the lowest- and highest-income groups. That is, high- and low-income individuals living in areas marked by high income inequality are more prone to be exposed to members of their own economic strata during daily activities. For low-income individuals, this implies that their everyday activities are more confined to comparably low-income communities amid pronounced income inequality. In contrast, high-income individuals manifest a form of social closure under heightened economic disparity, where their resources and social connections become increasingly concentrated in advantaged communities within their activity spaces. When examining income disparities at the upper and lower ends of the income distribution separately, we show that wider income gaps at the upper end amplify the isolation of both the highest- and lowest-income groups, whereas income disparities at the lower end only affect the most disadvantaged group. Additionally, we demonstrate that economic inequality exerts a more pronounced impact on low-income individuals’ activity spaces than on their residential spaces. In fact, after accounting for the full range of MSA-level characteristics, the effect on residential space loses statistical significance but the impact on activity space persists. This finding draws attention to activity space segregation as an especially pivotal outcome amidst rising economic inequality.
Synthesizing these findings, our study illuminates that the segregation of activity space by income and race is deeply rooted in their surrounding socioeconomic context. Although individuals generally exhibit reduced exposure to in-group members and greater exposure to out-group members within their activity spaces relative to their residential spaces, group segregation in activity space proves to be more susceptible to local levels of economic inequality. Therefore, a sole focus on residential space in segregation research might overlook a vital mechanism through which economic inequality influences the life chances of disadvantaged groups. More broadly, our findings advocate for policies aimed at reducing racial and income segregation to encompass not only interventions alleviating the impacts of inequality on individuals and families as separate entities but also strategies counteracting the disruptive effects of inequality on the connections (or lack of) between individuals, families, and socioeconomic groups.
METHODOLOGICAL APPENDIX
Here we provide a more detailed discussion of the data limitations and outline how they affect our analytic strategies.
SafeGraph Daily Mobility Data
SafeGraph data collections relies on location-based services from apps that have consented to having their location tracked. Software development kits (SDKs) installed in apps were used to source data from partnerships with more than 120 privacy compliant mobile applications, such as weather and dating apps. The SafeGraph data have been used to analyze patterns of human mobility and their associated socioeconomic consequences (Bonaccorsi et al. 2020; Kang et al. 2020; Xiong et al. 2020; Zhang and Cheng 2024). At the point-of-interest (POI) level, when compared with the well-established industry benchmark in the United States—Google—the SafeGraph covers approximately 89 percent for an urban zip code and 62 percent for a rural zip code (SafeGraph 2023). On the level of mobile device users, the SafeGraph data represents approximate 10 percent of the entire U.S. population (Kang et al. 2020), and the number of sampled devices was strongly correlated with the census population at the level of counties and metropolitan areas over the last five years (Kang et al. 2020; Li et al. 2023). SafeGraph’s coverage rate also fluctuates over time, ranging from 4.5 percent to 14.5 percent between 2018 and 2022, with the most stable period being year 2019 (Li et al. 2023). Hence we focus on 2019 in our analysis to avoid the data coverage inconsistencies and to avoid the impact of the COVID-19 pandemic on mobility patterns.
One limitation of the SafeGraph data sample is the issue of under- and overrepresentation. For example, SafeGraph mobility data are less likely to capture older, low socioeconomic status, and non-White individuals (Coston et al. 2021; Li et al. 2023; Zhang et al. 2023), and the bias also varies by location, time, urbanization, and geographic scale. To mitigate these issues, we focus on urban areas and stratifies communities by racial and income composition. Another limitation is that SafeGraph excludes any information of individual-level mobility patterns, which is necessary to preserve privacy of individual mobile phone users.
Distance-Based Exposure Measures
Much like our mobility-based measure, the distance-based exposure is defined as the local spatial exposure:
Local spatial exposure to group m:

where φ(p, q) is defined as the inverse of the Euclidean distance between communities p and q. Hence it takes into account spatial proximity in defining group-specific exposure in the local environment. The weights  , imply that locations that have a higher population density and or are closer to the focal point p are assigned greater importance in determining the group proportion of the local environment of the focal location.
FOOTNOTES
↵1. We use the marginal household income distribution instead of the median household income. Based on the ACS five-year estimate and national income distribution in 2019, we compute the rate for income groups including 0–29,999 (Q1), 30,000–59,999 (Q2), 60,000–99,999 (Q3), and 100,000 or more (Q4).
↵2. We follow existing work (Athey et al. 2021; Zhang and Cheng 2024) in using the residential composition in the destination community as the proxy for individuals’ potential exposure in their daily travels. We acknowledge that specific locations within the community, such as restaurants, grocery stores, and libraries, might attract visitors whose demographics differ significantly from those of the community at large. In a recent working paper, Zhang and Cheng (2024) compare group exposure patterns using the composition of residents in a destination community versus using the composition of visitors to specific places. Their analysis suggests that using these two proxies yielded similar findings about mobility patterns in terms of income and racial group exposure.
↵3. These findings are consistent with recent studies that suggested a lower level of experienced racial isolation relative to residential isolation (Athey et al. 2021), but we extended the analysis to a broader set of racial and income groups.
4. Given the limitation that not all MSA can be identified in the ACS data from which we construct MSA-level covariates, we estimate our regression models on the subsample of 258 MSAs that have complete data on all covariates.
↵5. For the online supplement, see https://www.rsfjournal.org/content/11/1/132/tab-supplemental.
- © 2025 Russell Sage Foundation. Cheng, Siwei, Yongjun Zhang, and Jenna Shaw. 2025. “Economic Inequality and the Geography of Activity Space Segregation: Combining Mobile Device Data and Census Data.” RSF: The Russell Sage Foundation Journal of the Social Sciences 11(1): 132–52. https://doi.org/10.7758/RSF.2025.11.1.07. Direct correspondence to: Siwei Cheng, siwei.cheng{at}nyu.edu, 295 Lafayette St, 4th Fl, New York, New York 10012, United States.
Open Access Policy: RSF: The Russell Sage Foundation Journal of the Social Sciences is an open access journal. This article is published under a Creative Commons Attribution-NonCommercial-NoDerivs 3.0 Unported License.
REFERENCES
In this issue


Jump to section
- Article
- Abstract
- FROM RESIDENTIAL SEGREGATION TO ACTIVITY SPACE SEGREGATION
- THE GEOGRAPHIC VARIATIONS OF ACTIVITY SPACE SEGREGATION
- ECONOMIC INEQUALITY AND ACTIVITY SPACE SEGREGATION
- RESEARCH QUESTIONS
- GEOGRAPHIC VARIATIONS IN THE RELATIVE ISOLATION OF INCOME AND RACIAL GROUPS
- ECONOMIC INEQUALITY AND ACTIVITY SPACE SEGREGATION
- SENSITIVITY ANALYSES: POTENTIAL DEVIATIONS FROM KEY ASSUMPTIONS
- DISCUSSION
- METHODOLOGICAL APPENDIX
- FOOTNOTES
- REFERENCES
- Figures & Data
- Additional
- Info & Metrics
- References
Related Articles
Cited By...
- No citing articles found.