
Article Figures & Data
Figures
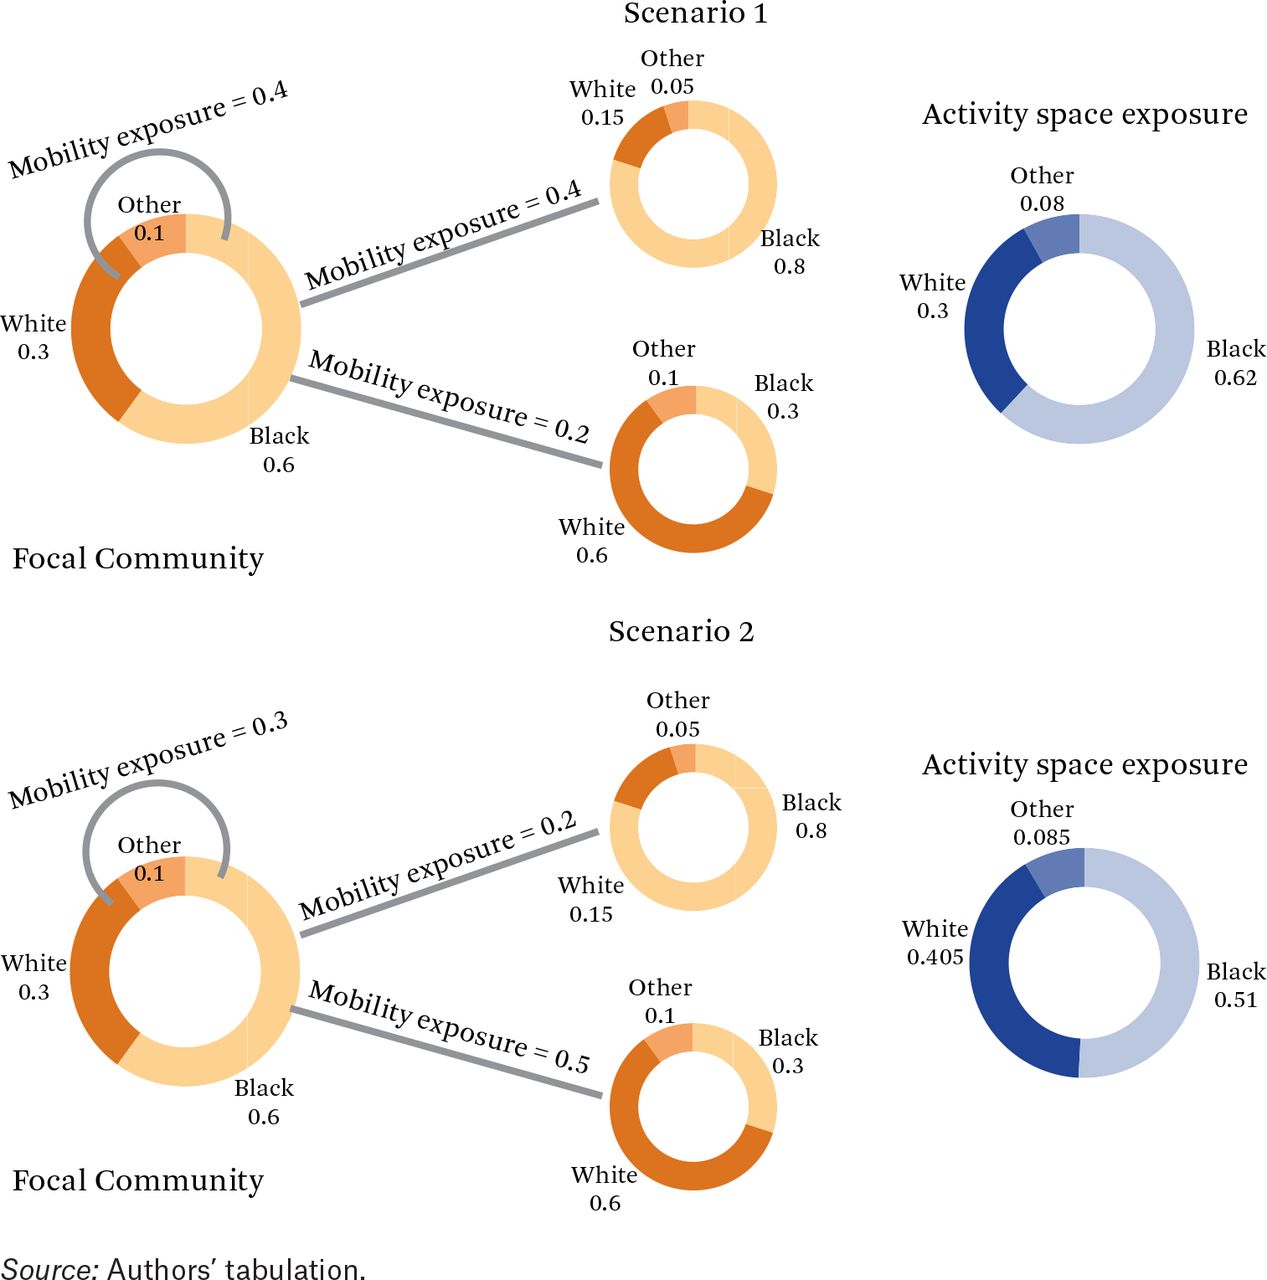
- Figure 1.
Graphic Illustration of Mobility-Based Measures of Group Exposure
Source: Authors’ tabulation.
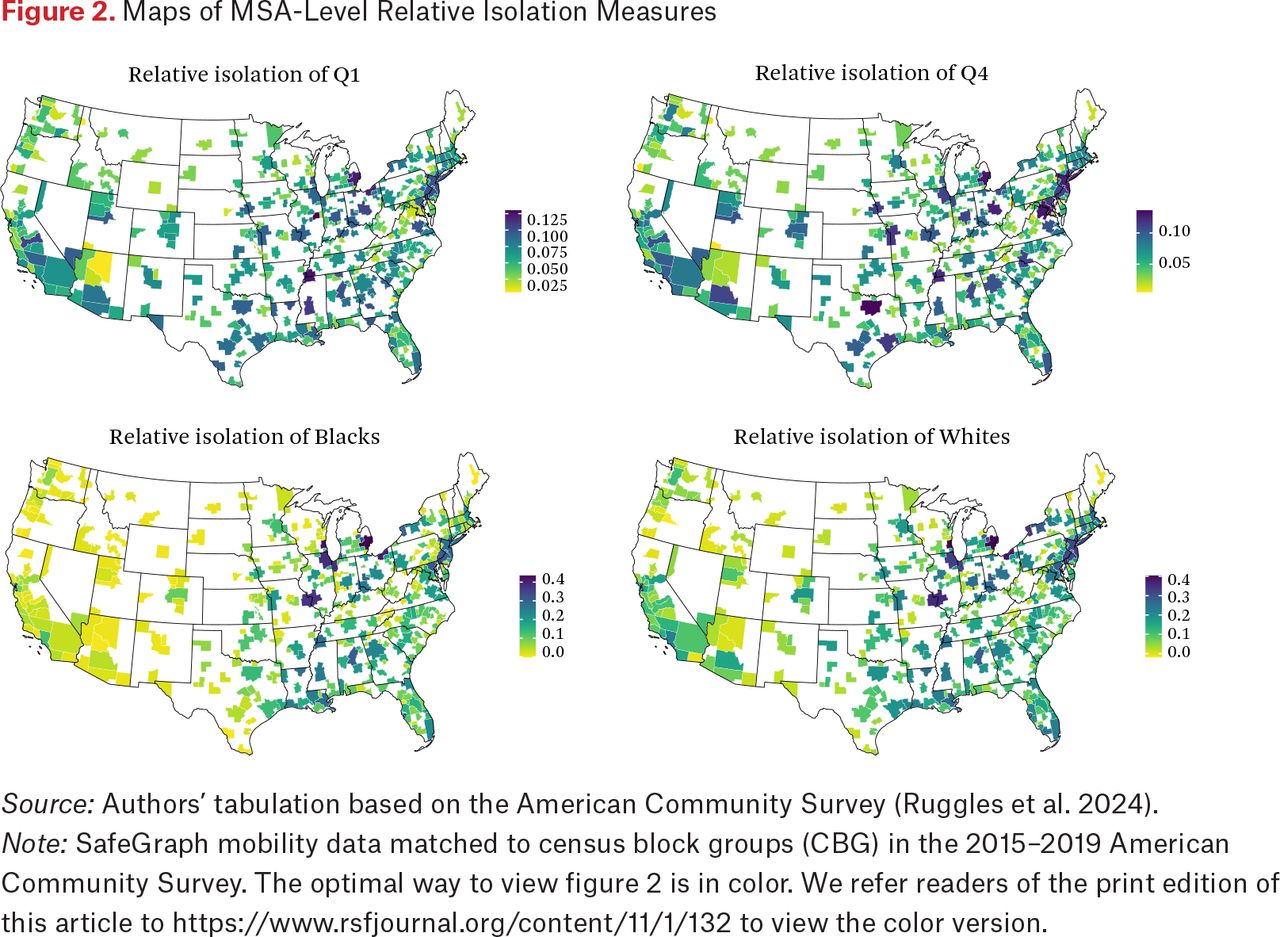
- Figure 2.
Maps of MSA-Level Relative Isolation Measures
Source: Authors’ tabulation based on the American Community Survey (Ruggles et al. 2024).
Note: SafeGraph mobility data matched to census block groups (CBG) in the 2015–2019 American Community Survey. The optimal way to view figure 2 is in color. We refer readers of the print edition of this article to https://www.rsfjournal.org/content/11/1/132 to view the color version.
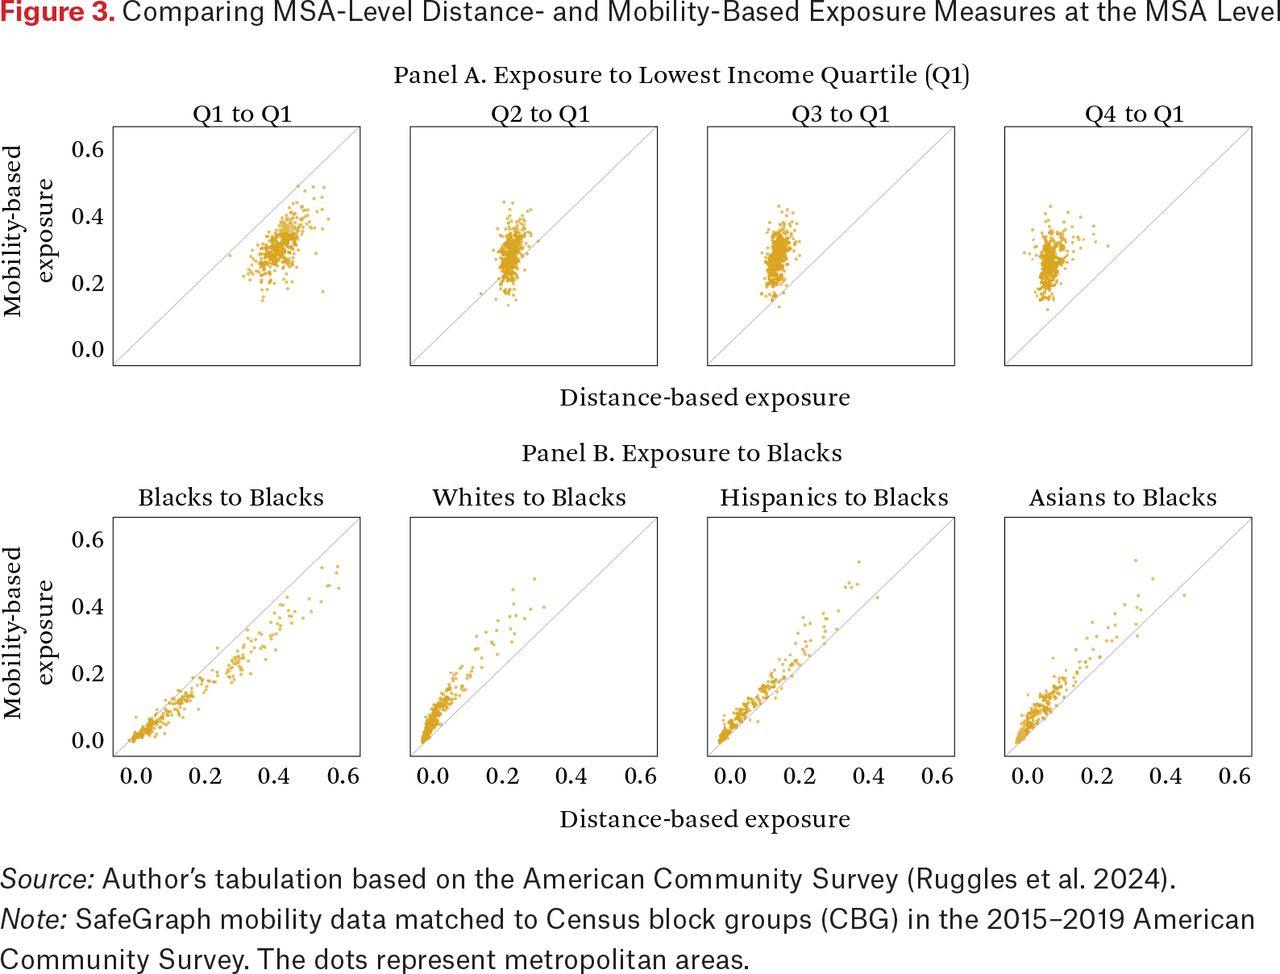
- Figure 3.
Comparing MSA-Level Distance- and Mobility-Based Exposure Measures at the MSA Level
Source: Author’s tabulation based on the American Community Survey (Ruggles et al. 2024).
Note: SafeGraph mobility data matched to Census block groups (CBG) in the 2015–2019 American Community Survey. The dots represent metropolitan areas.
- Figure 4.
Coefficients from Regression Models Predicting Relative Isolation of Q1 and Q4 Income Groups
Source: Authors’ tabulations based on the American Community Survey (Ruggles et al. 2024).
Note: SafeGraph mobility data matched to census block groups (CBG) in the 2015–2019 American Community Survey. The error bars show 95 percent confidence intervals. All regression models are weighted by MSA population size. The full regression results are reported in the online supplement.
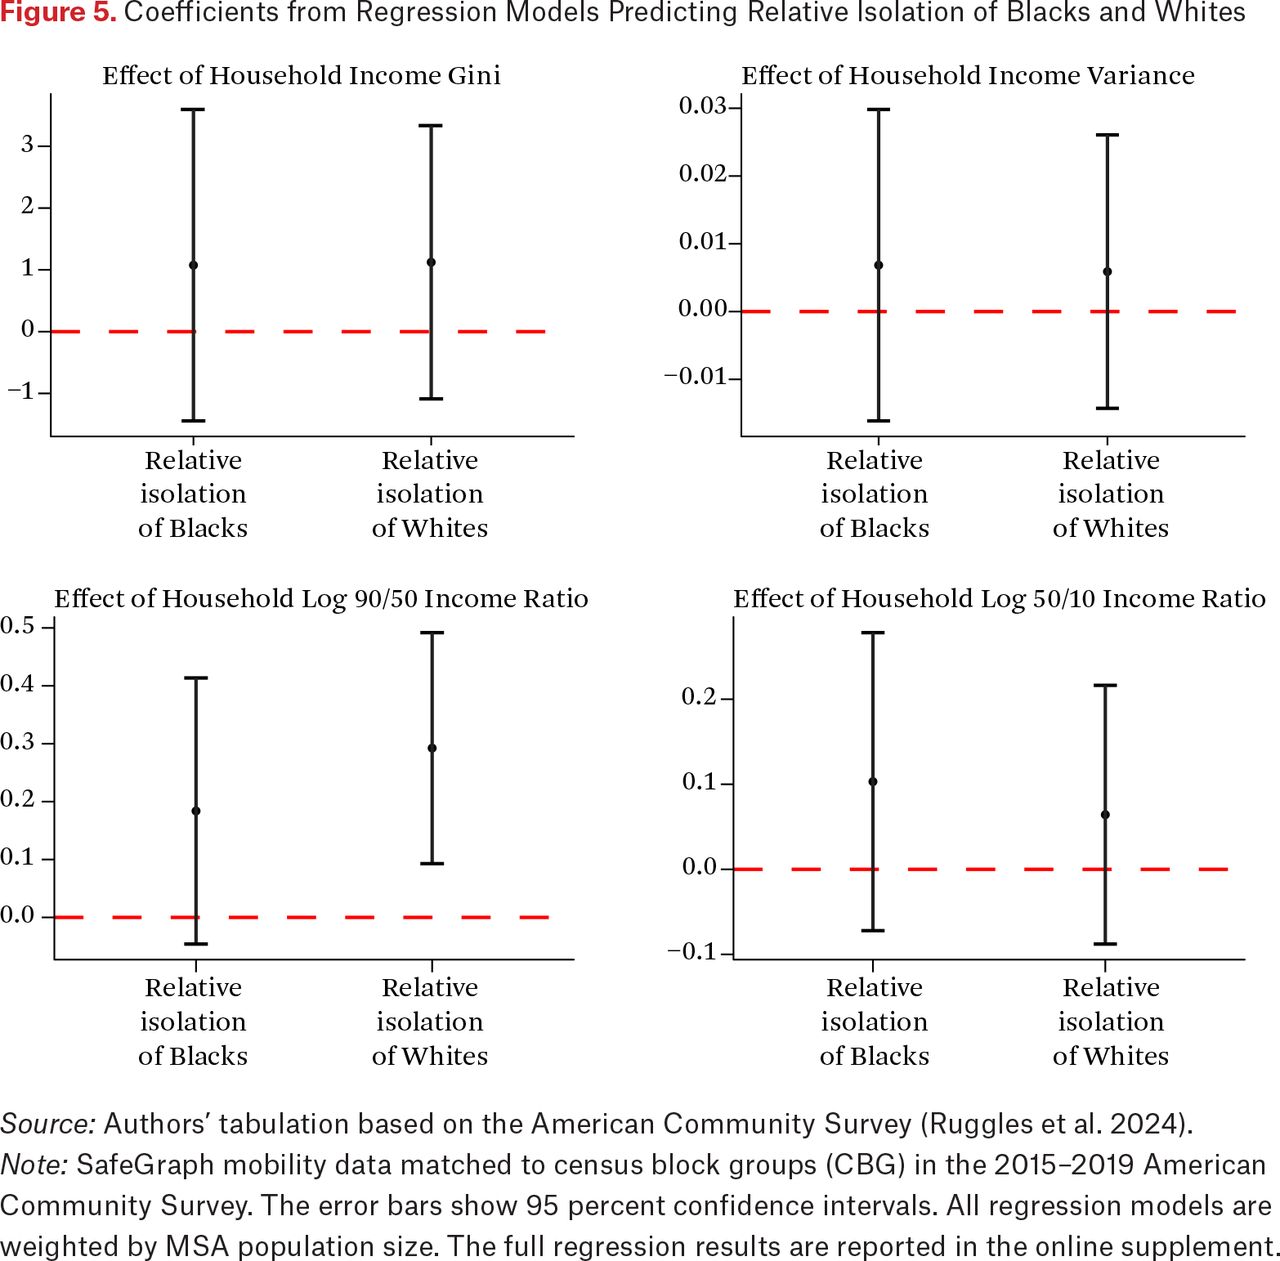
- Figure 5.
Coefficients from Regression Models Predicting Relative Isolation of Blacks and Whites
Source: Authors’ tabulation based on the American Community Survey (Ruggles et al. 2024).
Note: SafeGraph mobility data matched to census block groups (CBG) in the 2015–2019 American Community Survey. The error bars show 95 percent confidence intervals. All regression models are weighted by MSA population size. The full regression results are reported in the online supplement.
- Figure 6.
Comparing Effects of Income Inequality on Distance- and Mobility-Based Measures of Group Isolation
Source: Authors’ tabulation based on the American Community Survey (Ruggles et al. 2024).
Note: SafeGraph mobility data matched to census block groups (CBG) in the 2015–2019 American Community Survey. The error bars show 95 percent confidence intervals. All regression models are weighted by MSA population size. The full regression results are reported in the online supplement.
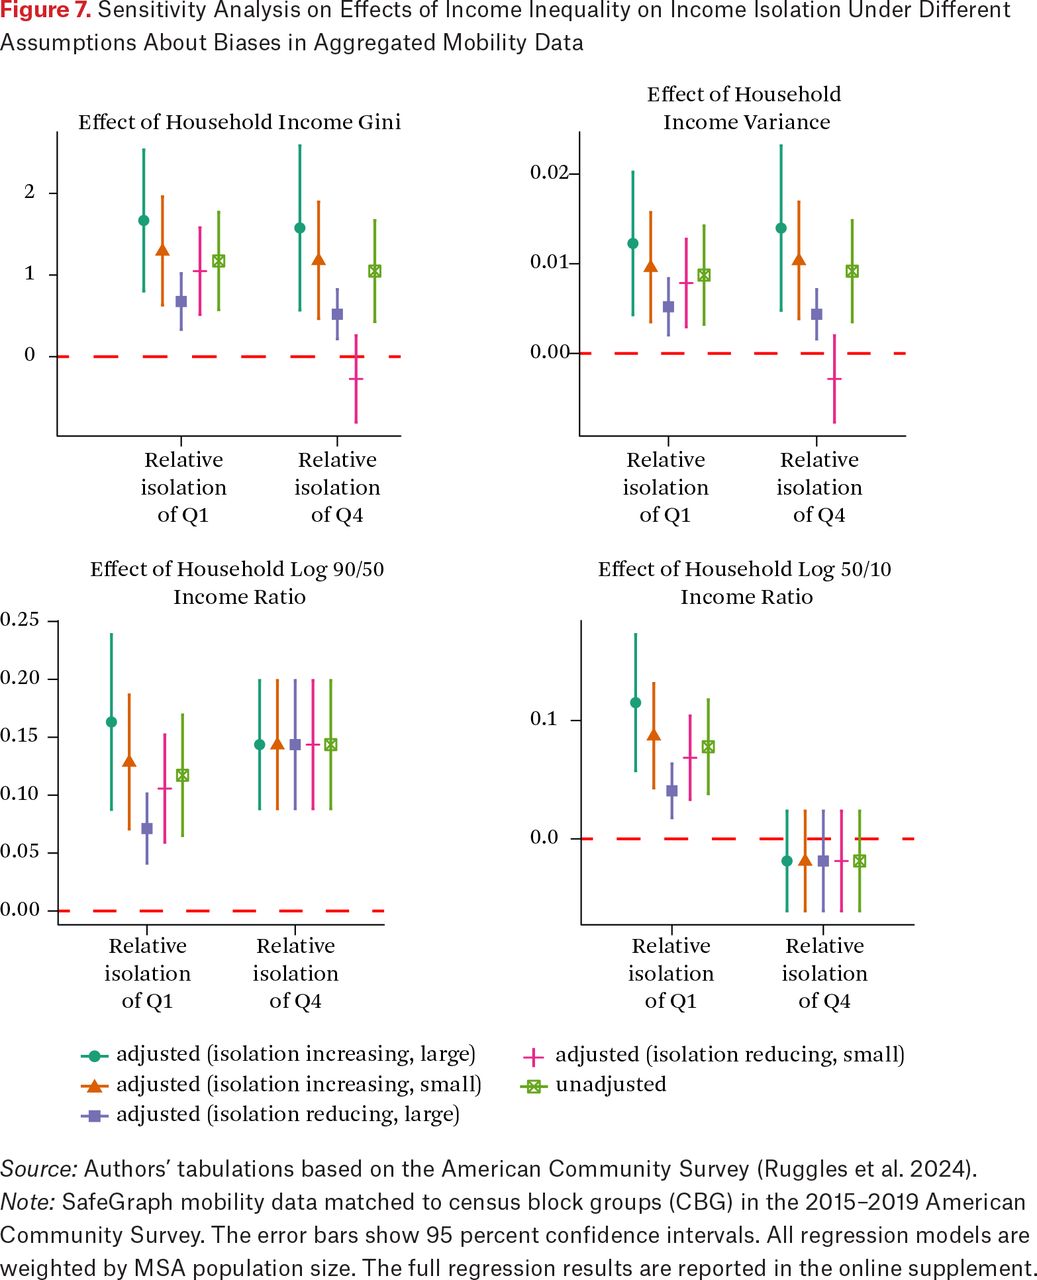
- Figure 7.
Sensitivity Analysis on Effects of Income Inequality on Income Isolation Under Different Assumptions About Biases in Aggregated Mobility Data
Source: Authors’ tabulations based on the American Community Survey (Ruggles et al. 2024).
Note: SafeGraph mobility data matched to census block groups (CBG) in the 2015–2019 American Community Survey. The error bars show 95 percent confidence intervals. All regression models are weighted by MSA population size. The full regression results are reported in the online supplement.


Tables
Appendix
Appendix
Files in this Data Supplement:
- Adobe PDF - Cheng_Online_Appendix.pdf - Appendix
In this issue


Jump to section
- Article
- Abstract
- FROM RESIDENTIAL SEGREGATION TO ACTIVITY SPACE SEGREGATION
- THE GEOGRAPHIC VARIATIONS OF ACTIVITY SPACE SEGREGATION
- ECONOMIC INEQUALITY AND ACTIVITY SPACE SEGREGATION
- RESEARCH QUESTIONS
- GEOGRAPHIC VARIATIONS IN THE RELATIVE ISOLATION OF INCOME AND RACIAL GROUPS
- ECONOMIC INEQUALITY AND ACTIVITY SPACE SEGREGATION
- SENSITIVITY ANALYSES: POTENTIAL DEVIATIONS FROM KEY ASSUMPTIONS
- DISCUSSION
- METHODOLOGICAL APPENDIX
- FOOTNOTES
- REFERENCES
- Figures & Data
- Additional
- Info & Metrics
- References
Related Articles
Cited By...
- No citing articles found.