
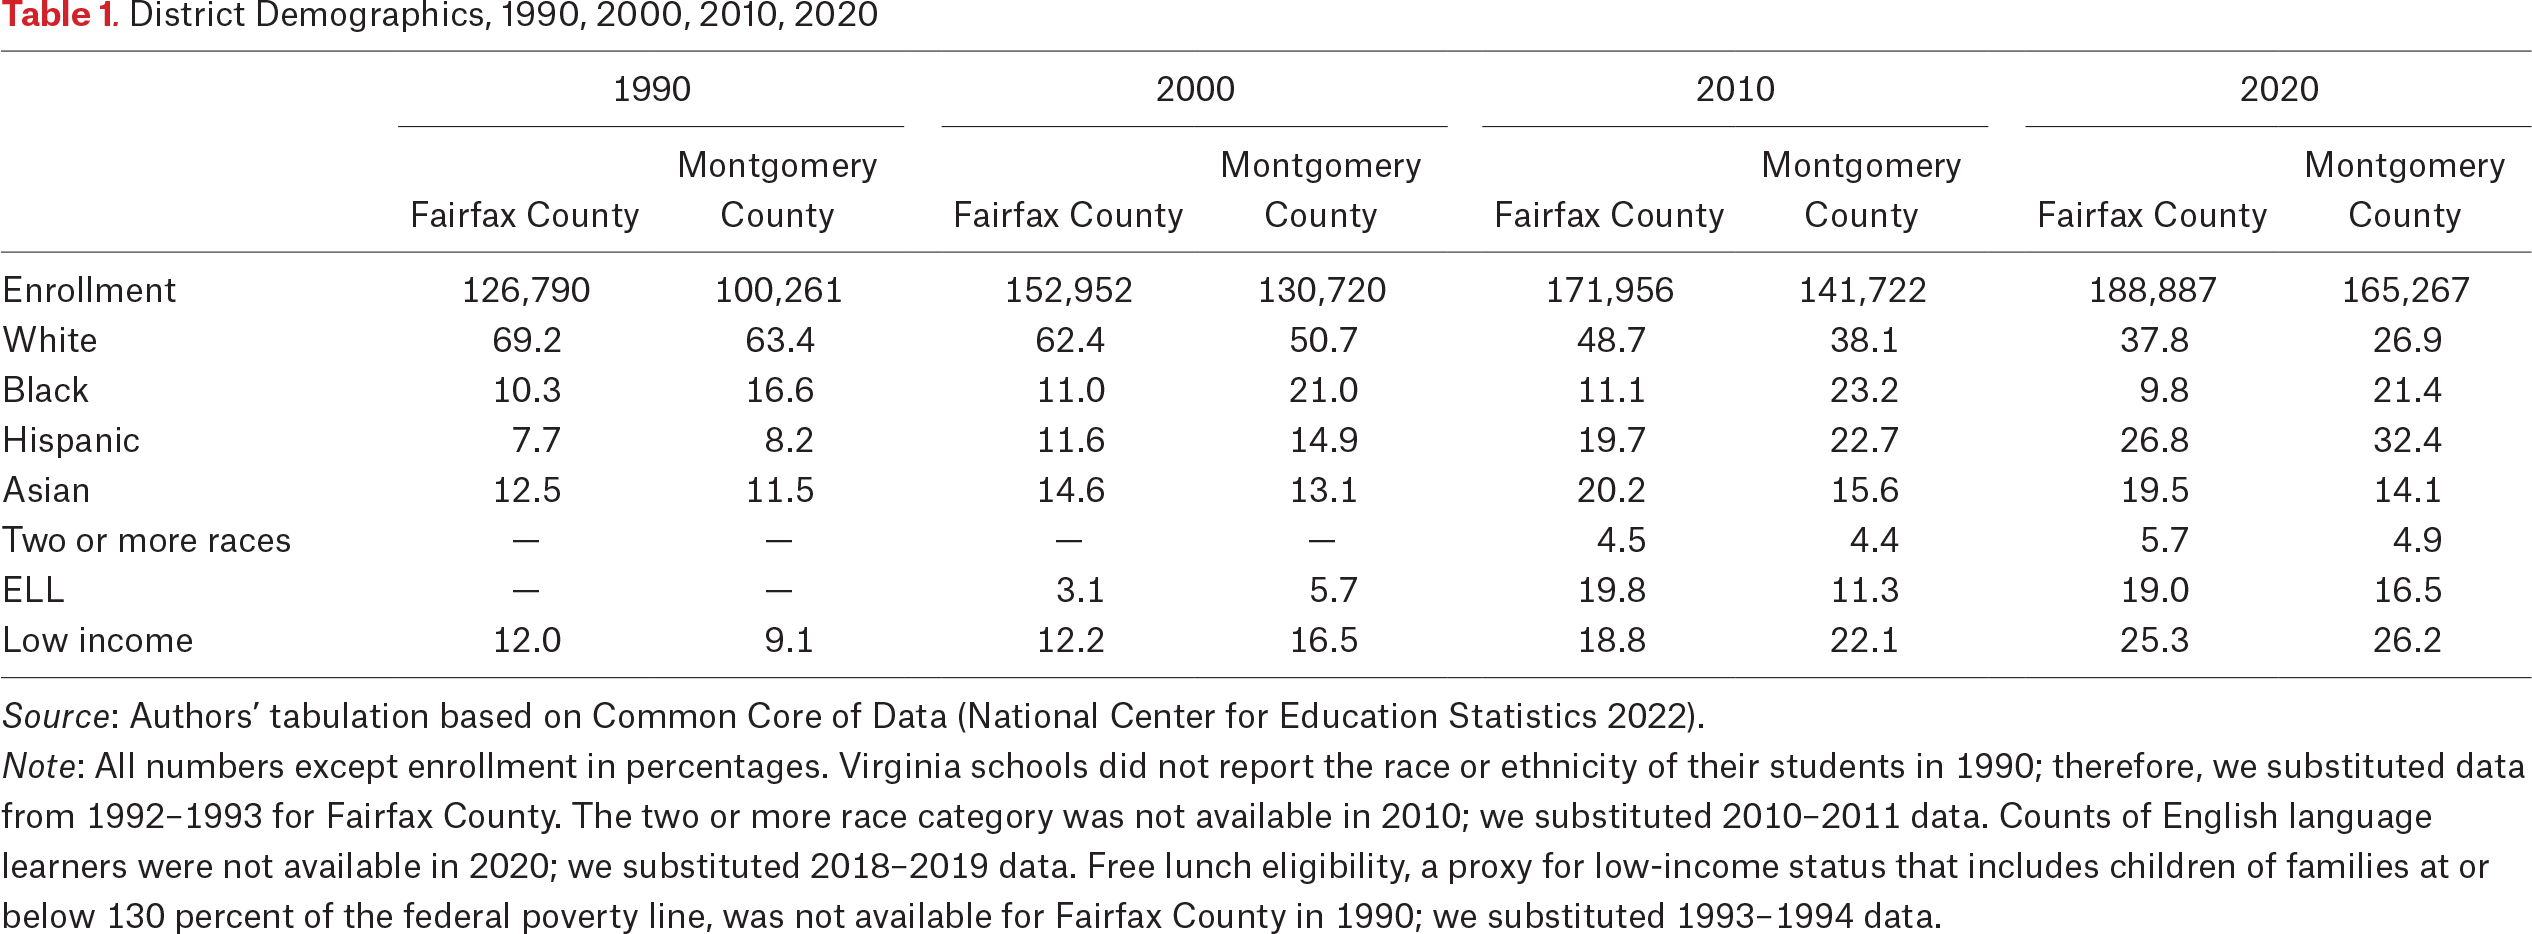
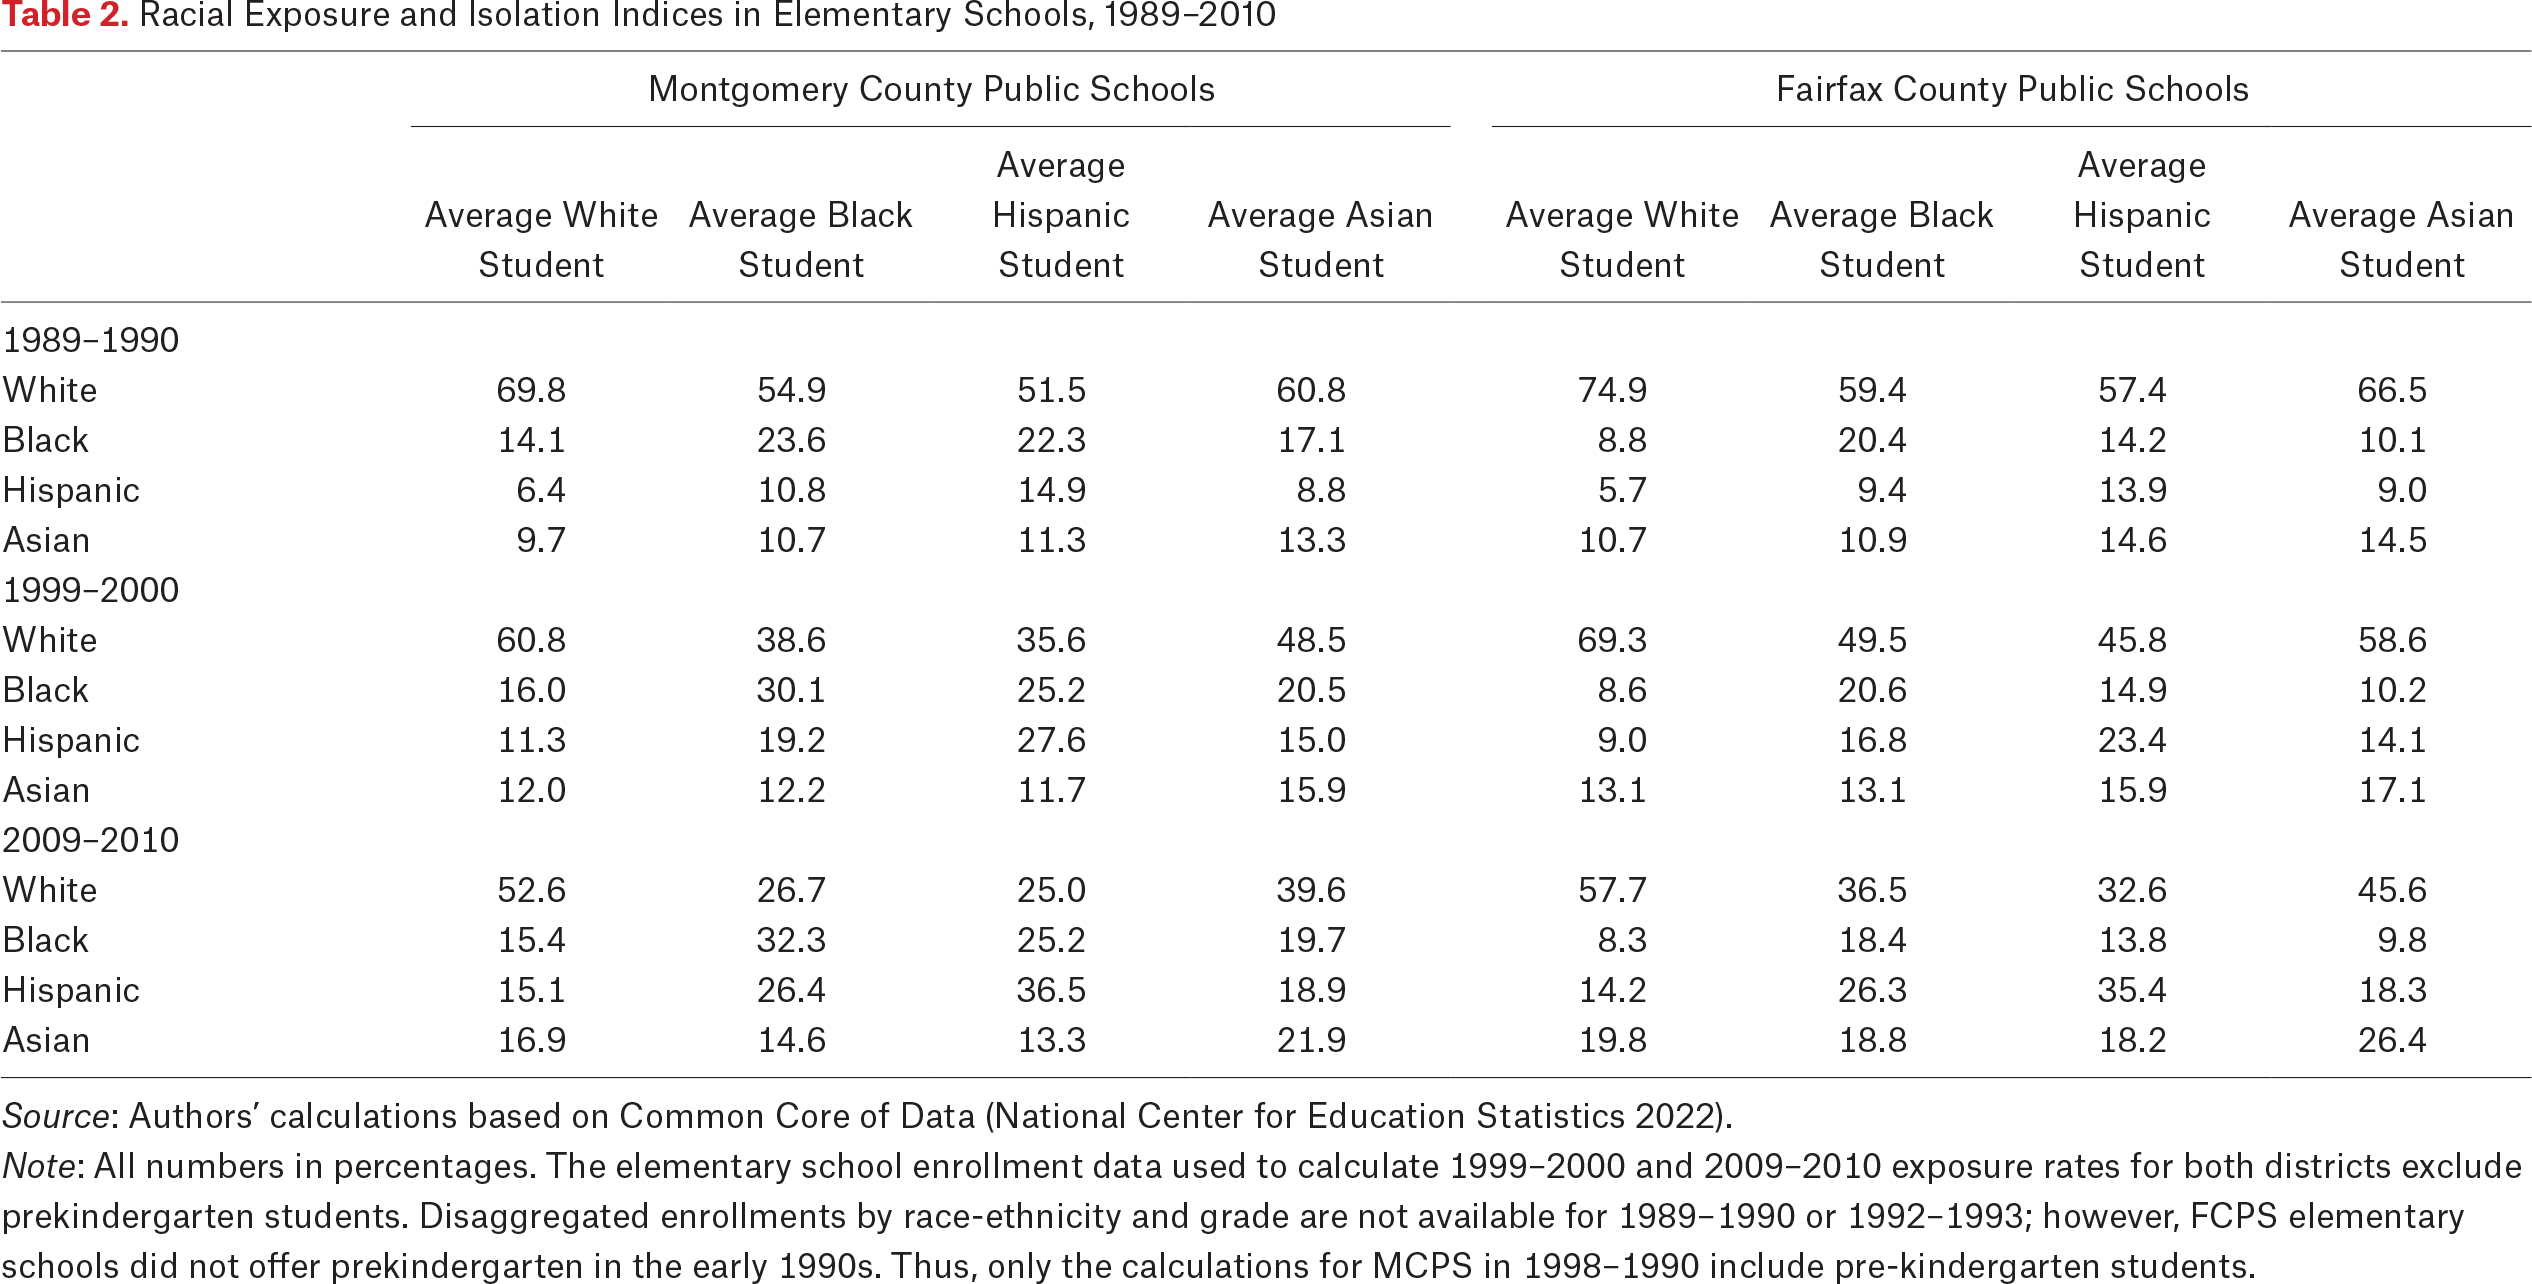
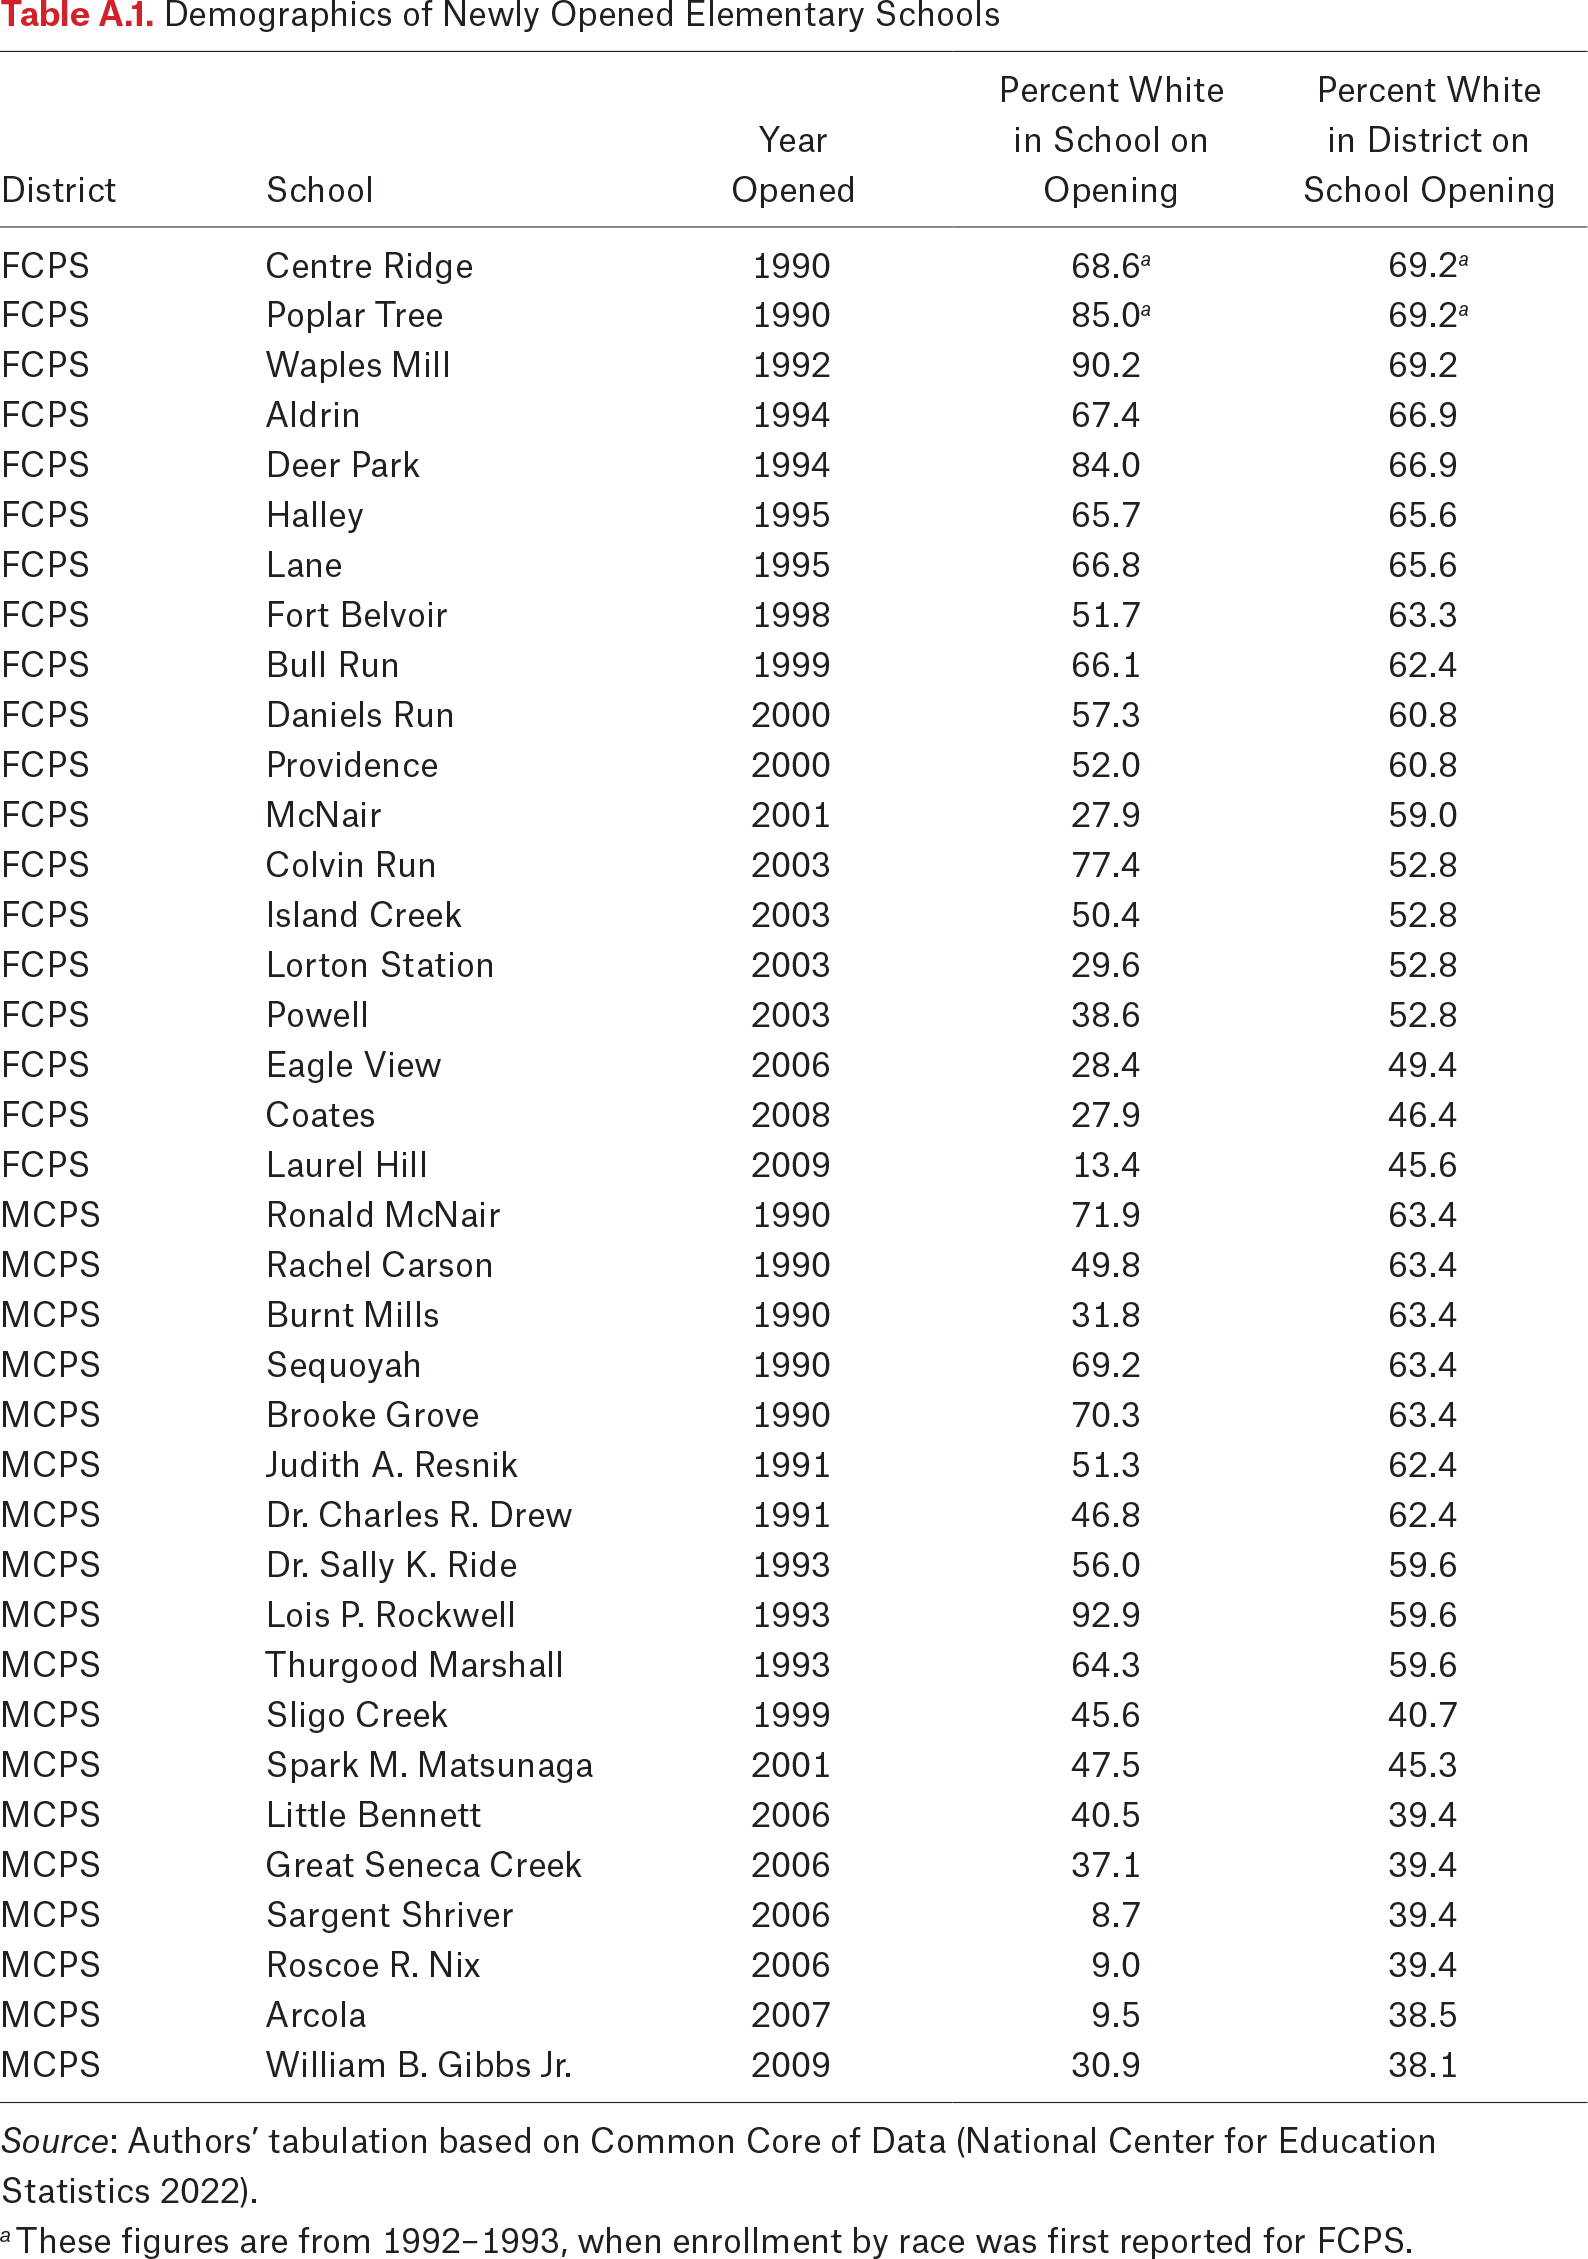
Article Figures & Data
Figures
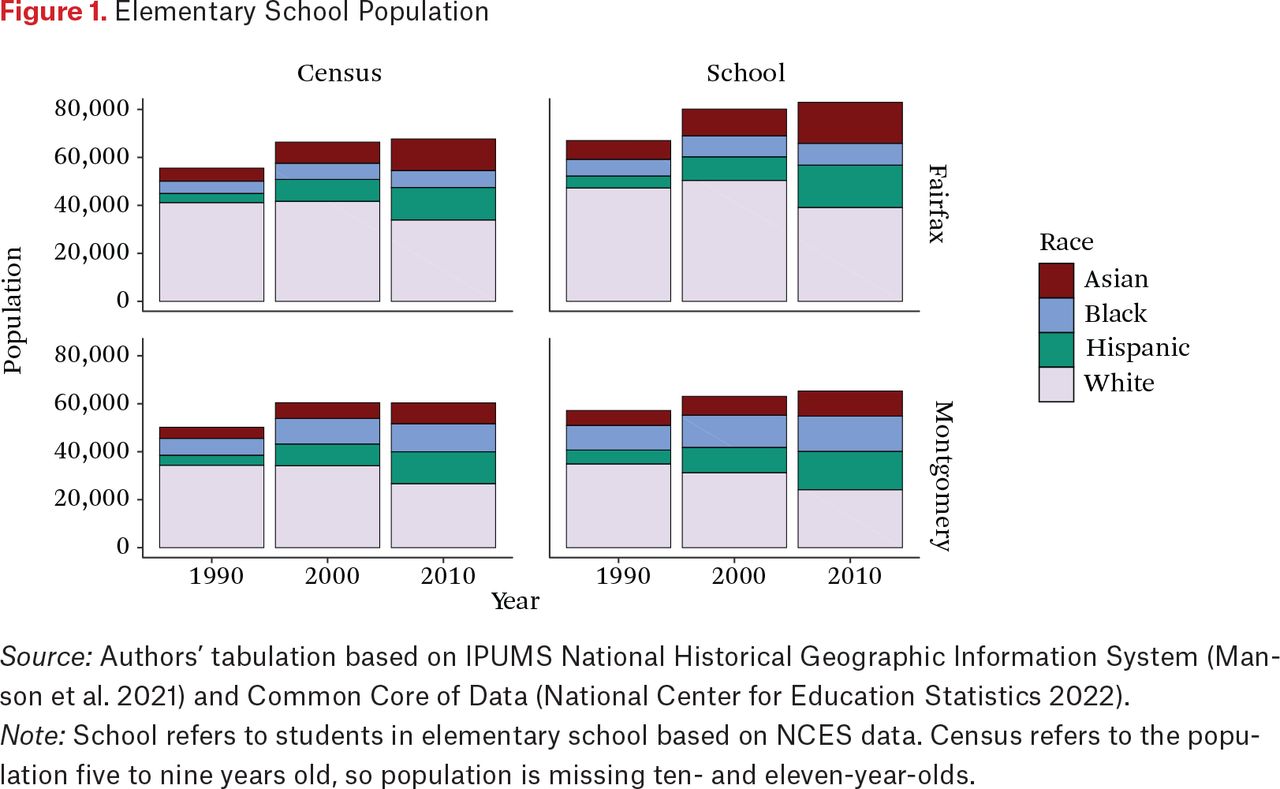
- Figure 1.
Elementary School Population
Source: Authors’ tabulation based on IPUMS National Historical Geographic Information System (Manson et al. 2021) and Common Core of Data (National Center for Education Statistics 2022).
Note: School refers to students in elementary school based on NCES data. Census refers to the population five to nine years old, so population is missing ten- and eleven-year-olds.
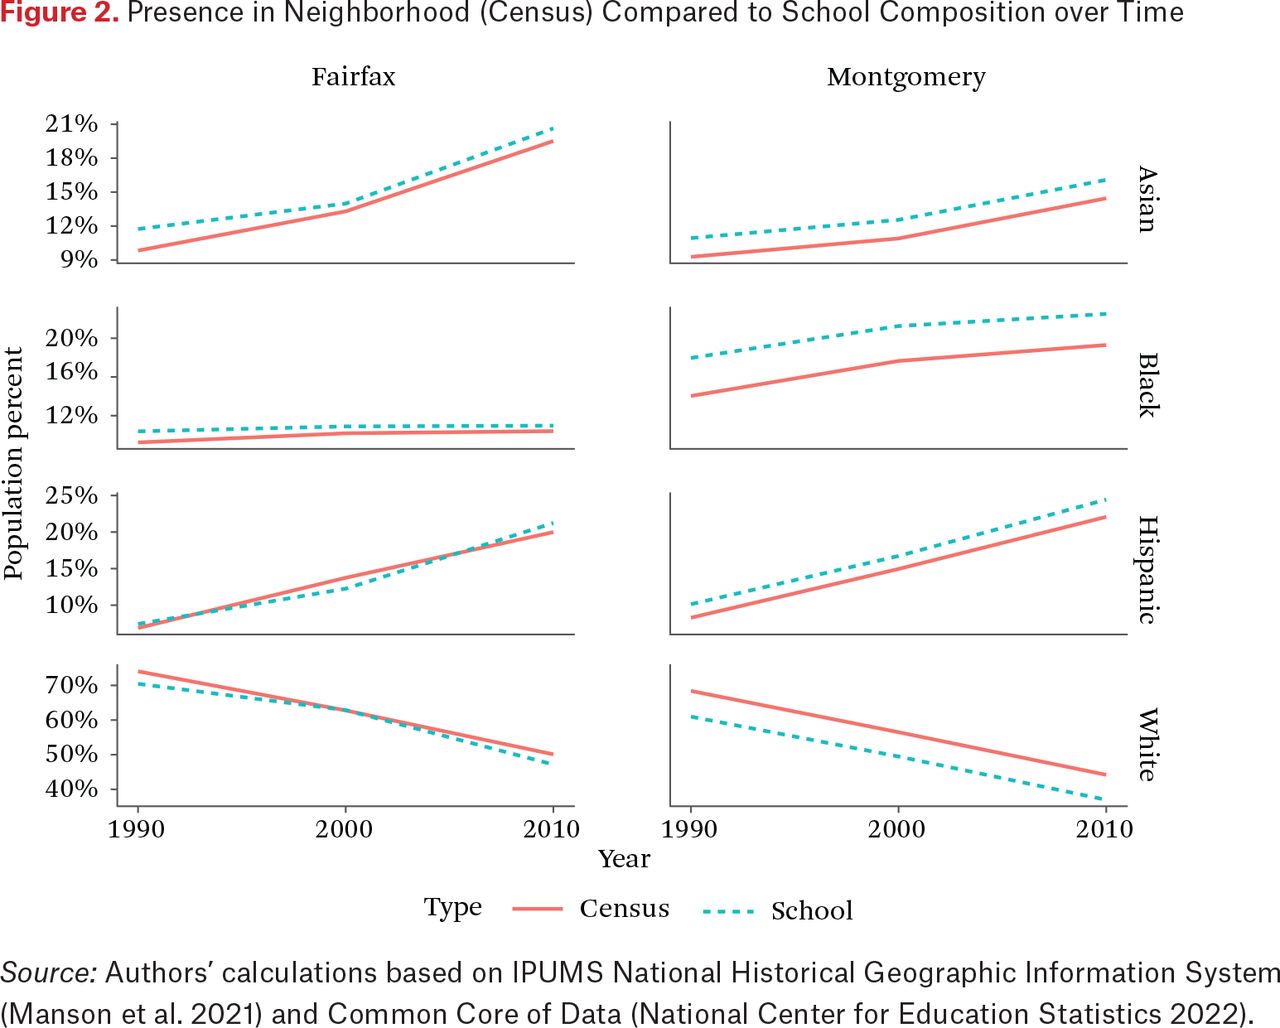
- Figure 2.
Presence in Neighborhood (Census) Compared to School Composition over Time
Source: Authors’ calculations based on IPUMS National Historical Geographic Information System (Manson et al. 2021) and Common Core of Data (National Center for Education Statistics 2022).
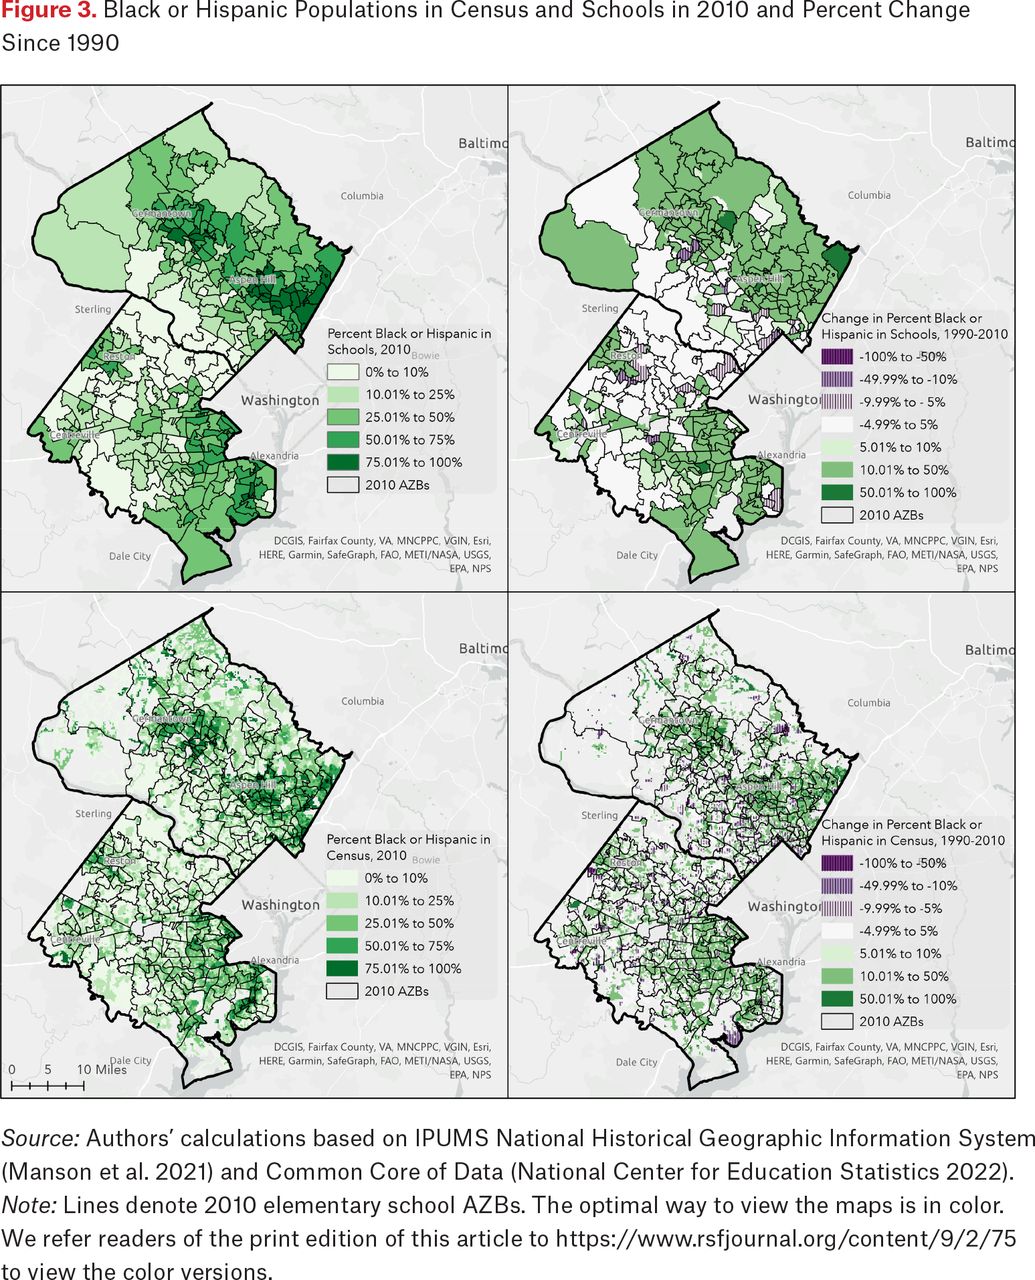
- Figure 3.
Black or Hispanic Populations in Census and Schools in 2010 and Percent Change Since 1990
Source: Authors’ calculations based on IPUMS National Historical Geographic Information System (Manson et al. 2021) and Common Core of Data (National Center for Education Statistics 2022).
Note: Lines denote 2010 elementary school AZBs. The optimal way to view the maps is in color. We refer readers of the print edition of this article to https://www.rsfjournal.org/content/9/2/75 to view the color versions.
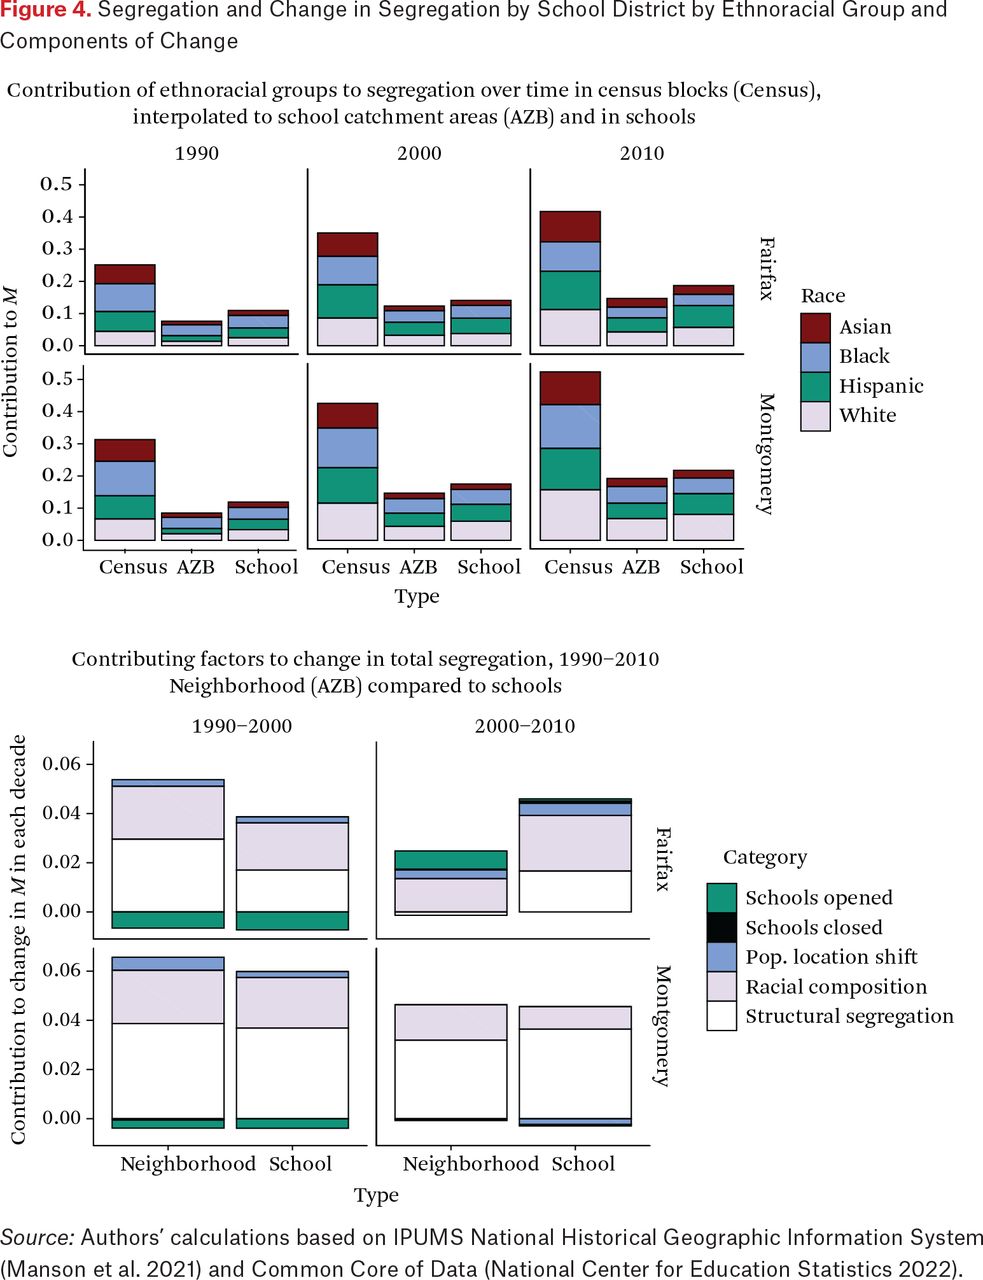
- Figure 4.
Segregation and Change in Segregation by School District by Ethnoracial Group and Components of Change
Source: Authors’ calculations based on IPUMS National Historical Geographic Information System (Manson et al. 2021) and Common Core of Data (National Center for Education Statistics 2022).
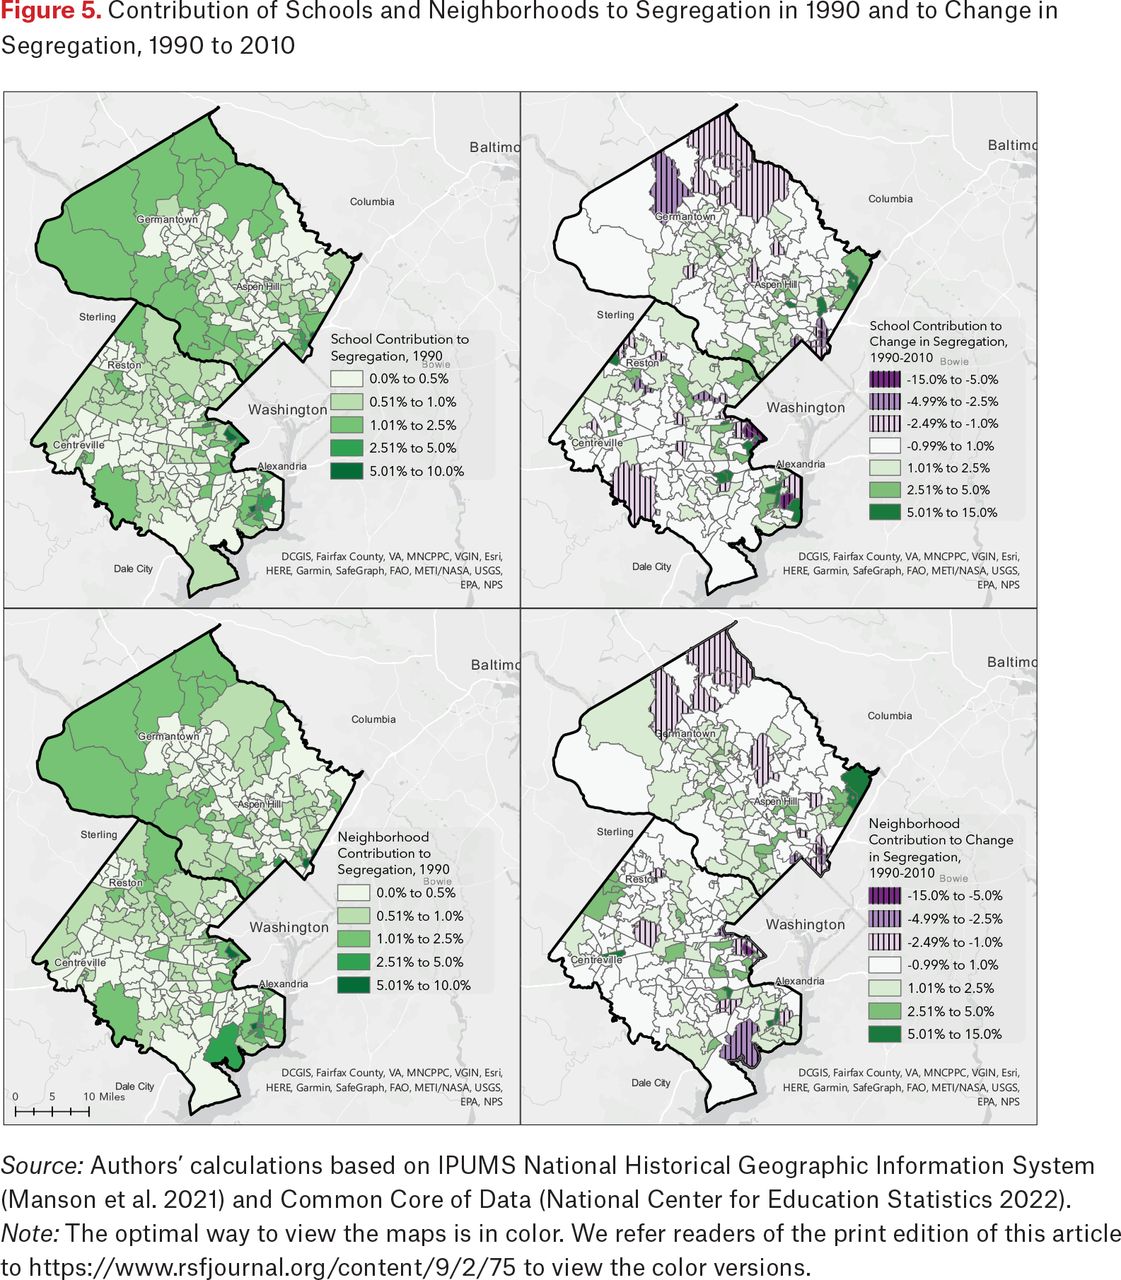
- Figure 5.
Contribution of Schools and Neighborhoods to Segregation in 1990 and to Change in Segregation, 1990 to 2010
Source: Authors’ calculations based on IPUMS National Historical Geographic Information System (Manson et al. 2021) and Common Core of Data (National Center for Education Statistics 2022). Note: The optimal way to view the maps is in color. We refer readers of the print edition of this article to https://www.rsfjournal.org/content/9/2/75 to view the color versions.
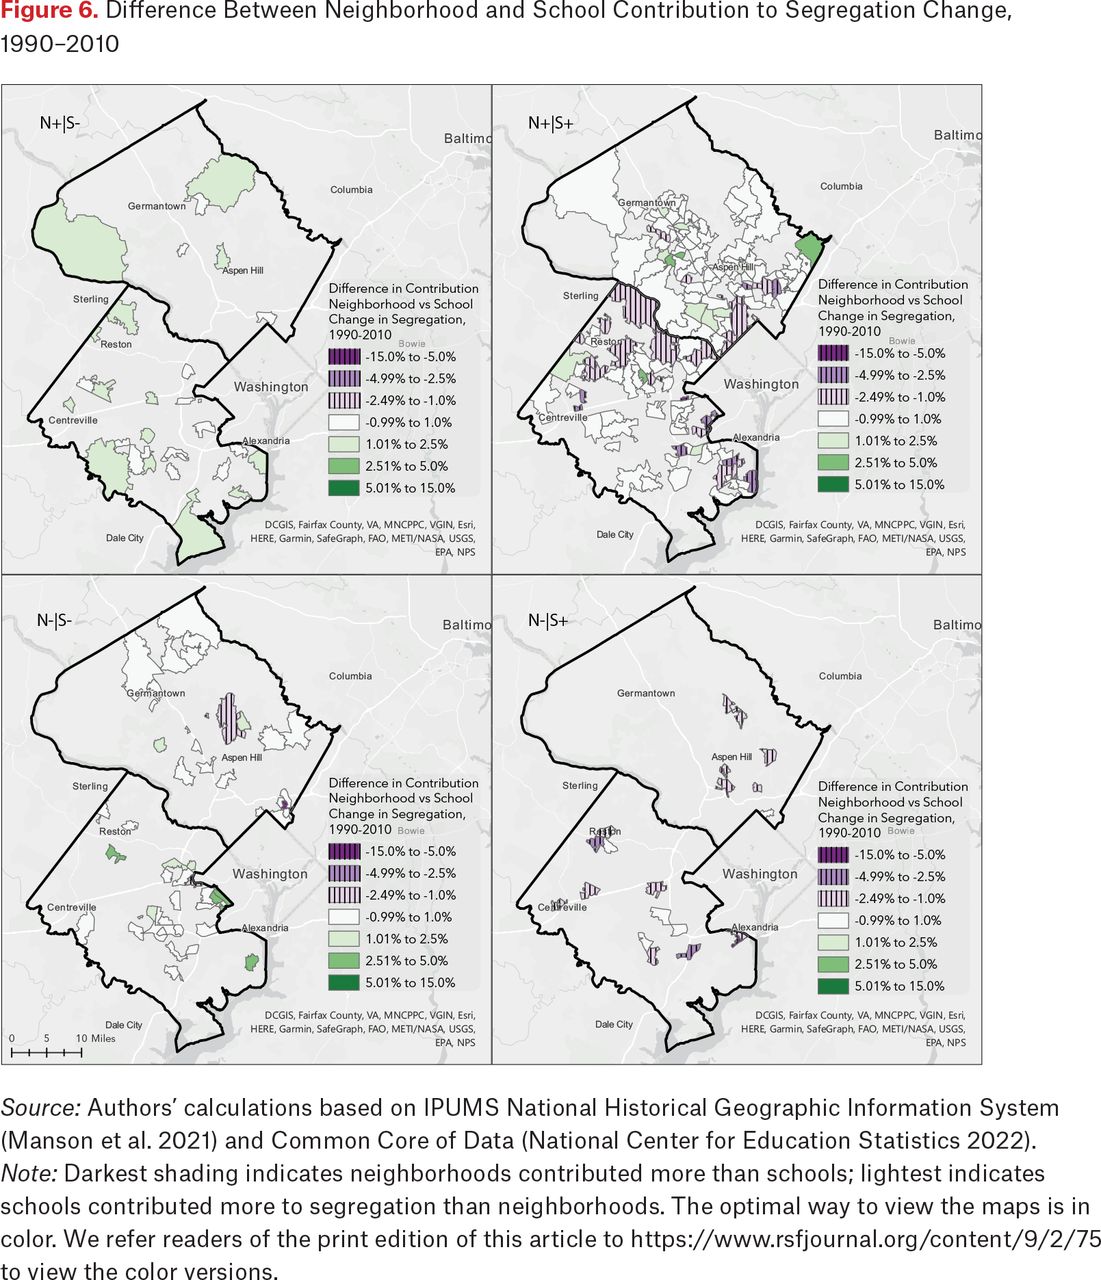
- Figure 6.
Difference Between Neighborhood and School Contribution to Segregation Change, 1990–2010
Source: Authors’ calculations based on IPUMS National Historical Geographic Information System (Manson et al. 2021) and Common Core of Data (National Center for Education Statistics 2022).
Note: Darkest shading indicates neighborhoods contributed more than schools; lightest indicates schools contributed more to segregation than neighborhoods. The optimal way to view the maps is in color. We refer readers of the print edition of this article to https://www.rsfjournal.org/content/9/2/75 to view the color versions.
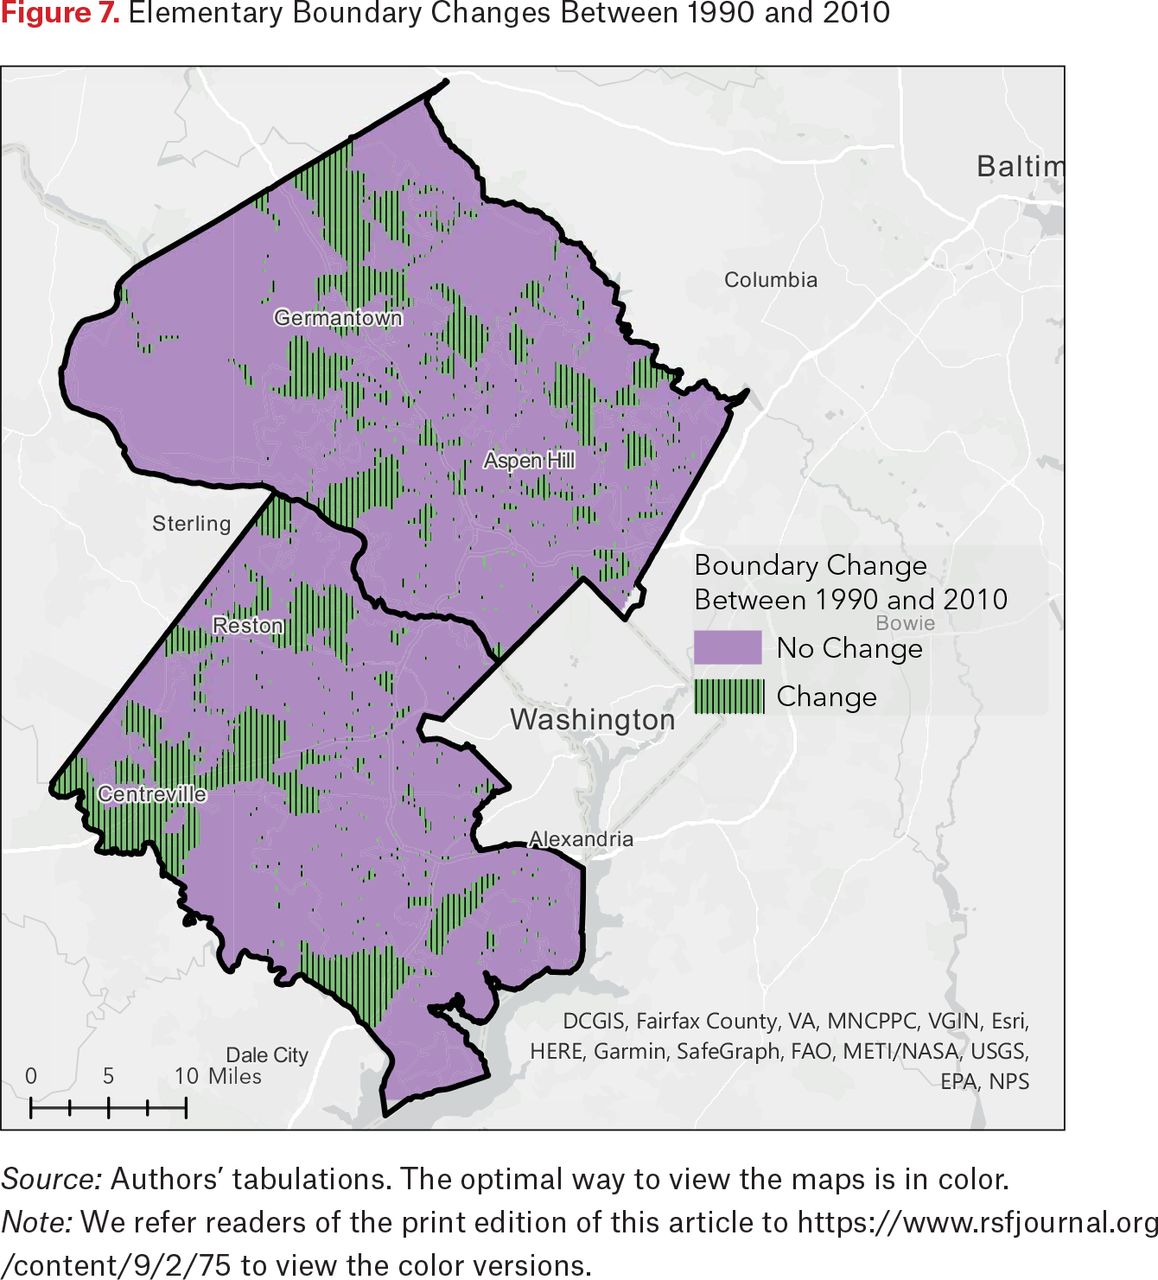
- Figure 7.
Elementary Boundary Changes Between 1990 and 2010
Source: Authors’ tabulations. The optimal way to view the maps is in color.
Note: We refer readers of the print edition of this article to https://www.rsfjournal.org/content/9/2/75 to view the color versions.
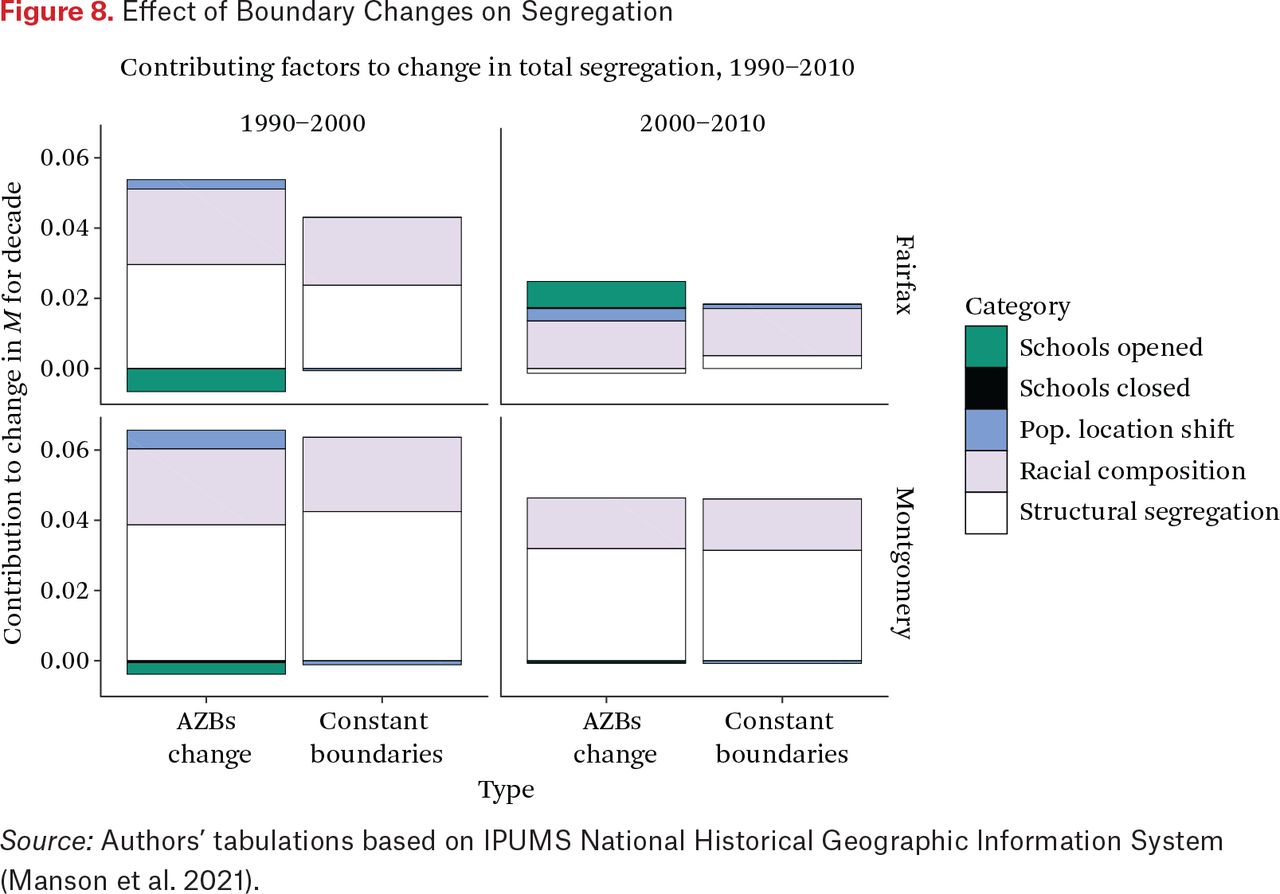
- Figure 8.
Effect of Boundary Changes on Segregation
Source: Authors’ tabulations based on IPUMS National Historical Geographic Information System (Manson et al. 2021).
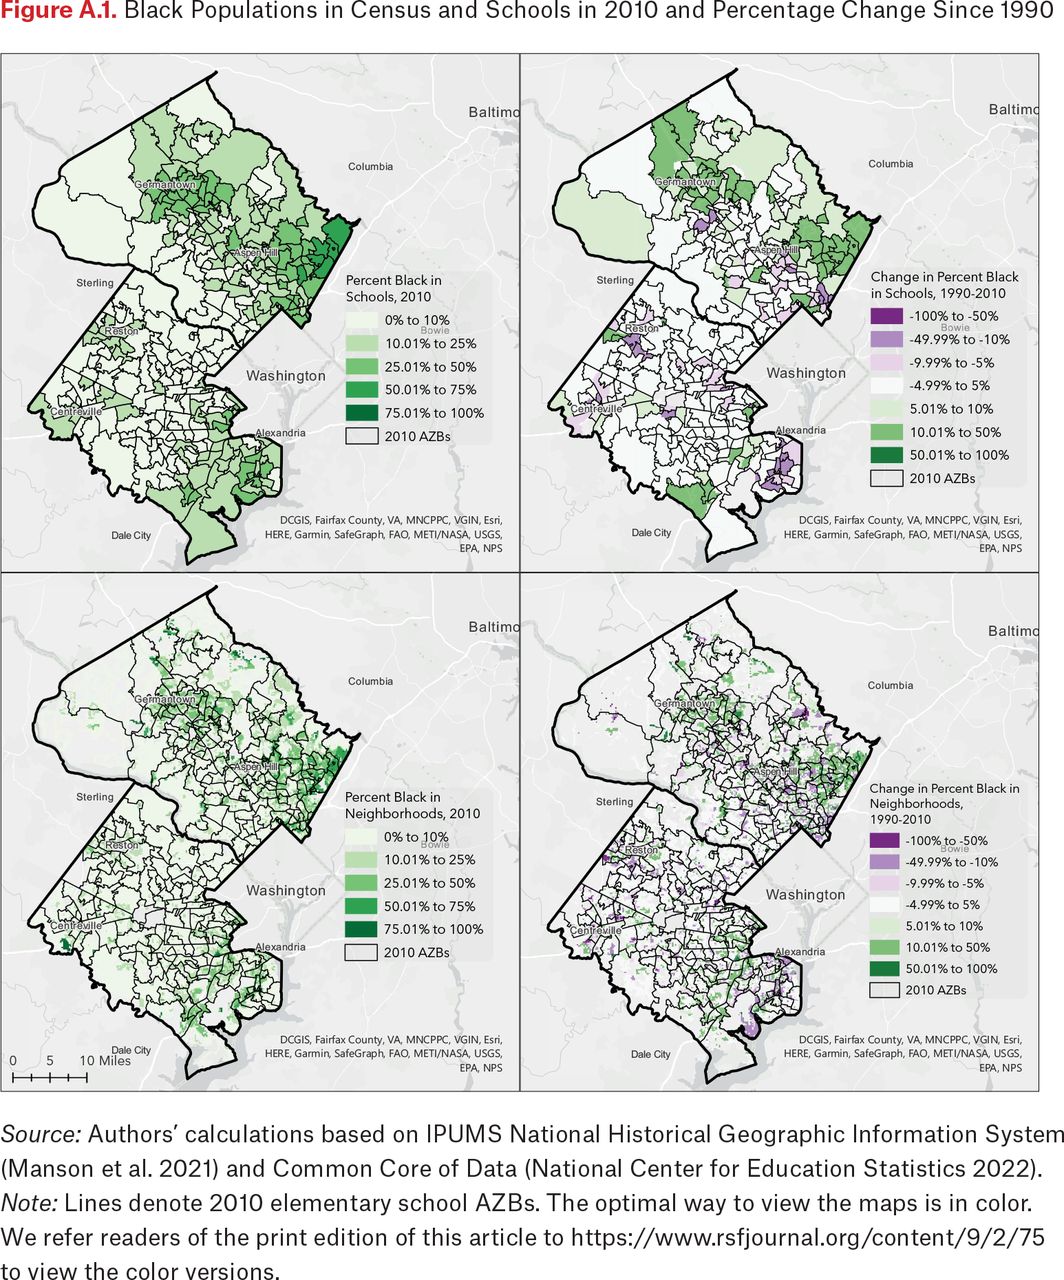
- Figure A.1.
Black Populations in Census and Schools in 2010 and Percentage Change Since 1990
Source: Authors’ calculations based on IPUMS National Historical Geographic Information System (Manson et al. 2021) and Common Core of Data (National Center for Education Statistics 2022).
Note: Lines denote 2010 elementary school AZBs. The optimal way to view the maps is in color. We refer readers of the print edition of this article to https://www.rsfjournal.org/content/9/2/75 to view the color versions.
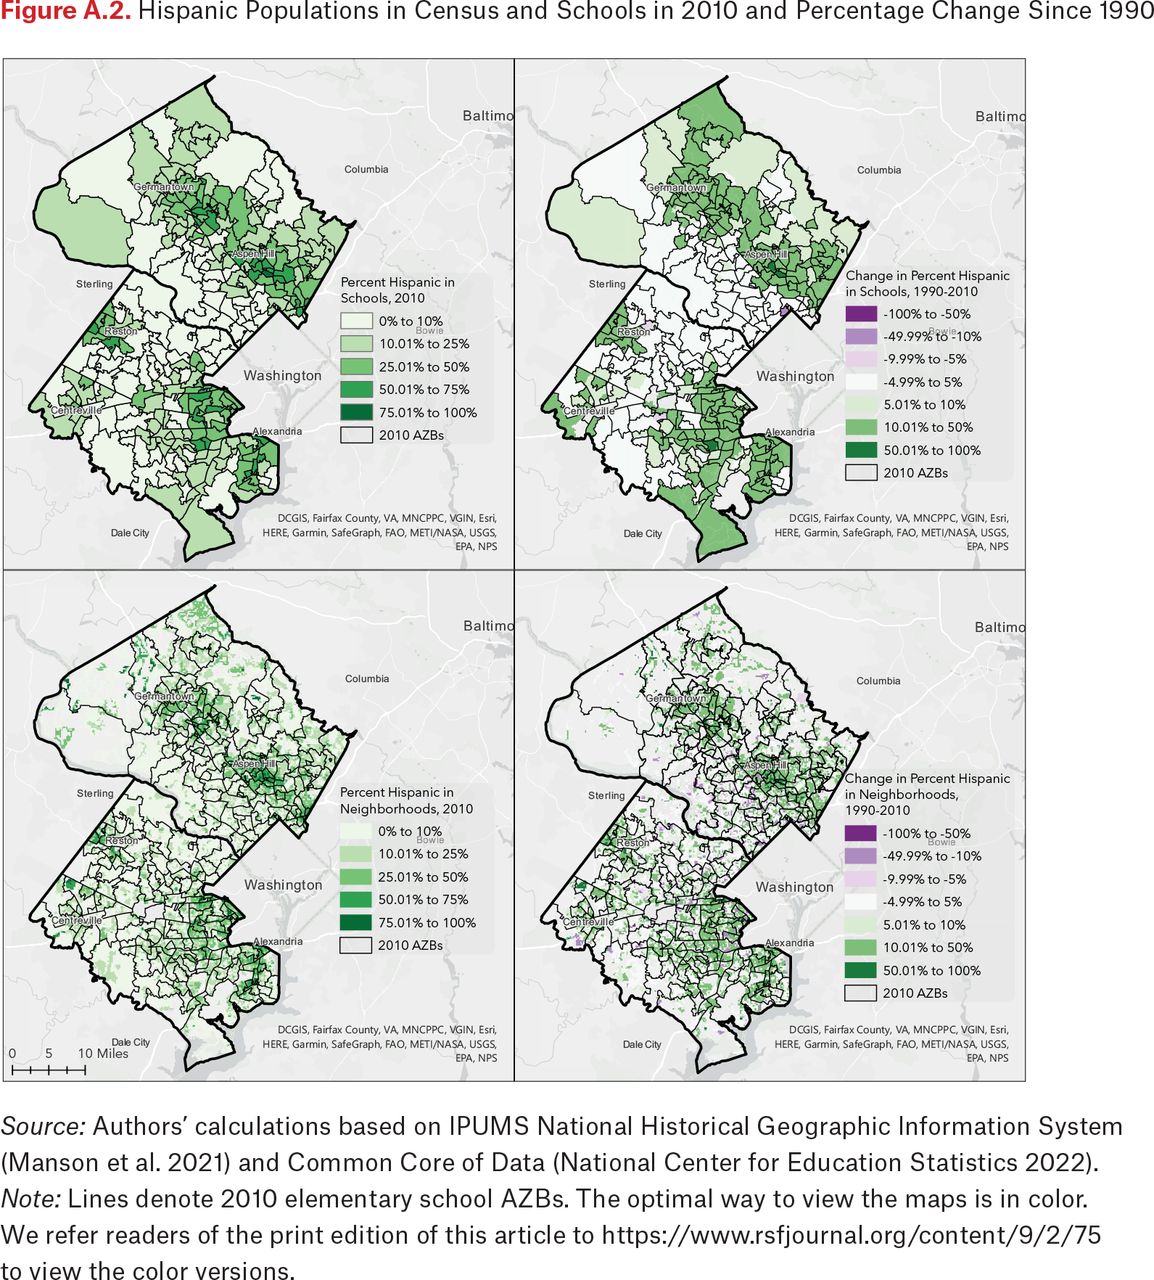
- Figure A.2.
Hispanic Populations in Census and Schools in 2010 and Percentage Change Since 1990
Source: Authors’ calculations based on IPUMS National Historical Geographic Information System (Manson et al. 2021) and Common Core of Data (National Center for Education Statistics 2022).
Note: Lines denote 2010 elementary school AZBs. The optimal way to view the maps is in color. We refer readers of the print edition of this article to https://www.rsfjournal.org/content/9/2/75 to view the color versions.


Tables
In this issue


Jump to section
Related Articles
Cited By...
- No citing articles found.