
Article Figures & Data
Figures
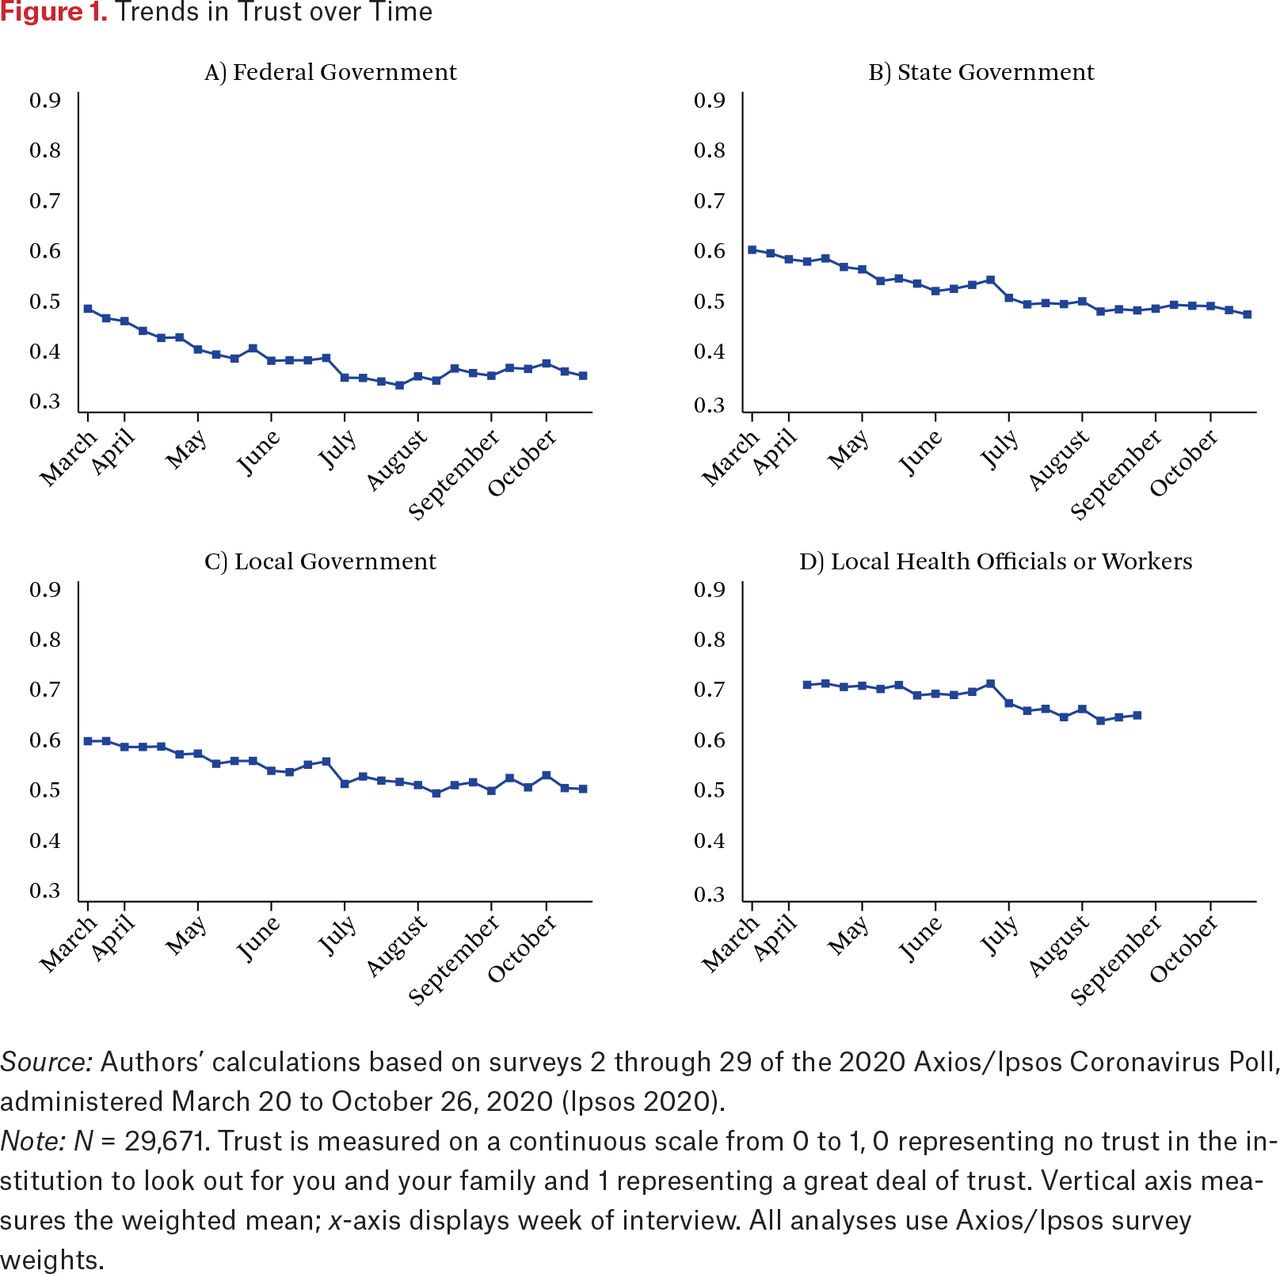
- Figure 1.
Trends in Trust over Time
Source: Authors’ calculations based on surveys 2 through 29 of the 2020 Axios/Ipsos Coronavirus Poll, administered March 20 to October 26, 2020 (Ipsos 2020).
Note: N = 29,671. Trust is measured on a continuous scale from 0 to 1, 0 representing no trust in the institution to look out for you and your family and 1 representing a great deal of trust. Vertical axis measures the weighted mean; x-axis displays week of interview. All analyses use Axios/Ipsos survey weights.
- Figure 2.
Association Between Time, Sociodemographic Characteristics, and Trust (Coefficient Plots)
Source: Authors’ calculations based on surveys 2 through 29 of the 2020 Axios/Ipsos Coronavirus Poll, administered March 20 to October 26, 2020 (Ipsos 2020).
Note: Each figure presents point estimates and 95 percent confidence intervals from a different regression. Trust is measured on a continuous scale from 0 to 1, 0 representing no trust in the institution to look out for you and your family, and 1 representing a great deal of trust. All regressions also include state-level pandemic severity and policy responses and state fixed effects and use Axios/Ipsos survey weights. “Survey” is a continuous variable ranging from 0 (first survey) to 1 (final survey), indicating change over time. The variables “Independent” party ID, “Less than high school” educational attainment, “Income 400-800% FPL,” “White, non-Hispanic” race, and age “40–64” are omitted as base categories. For full regression results, see table A.3.
- Figure 3.
Association Between Trust and Protective Health Behaviors (Coefficient Plots)
Source: Authors’ calculations based on surveys 5 through 23 of the 2020 Axios/Ipsos Coronavirus Poll, administered April 10 to August 31, 2020 (Ipsos 2020).
Note: Each figure presents point estimates and 95 percent confidence intervals from a different regression. Trust is measured on a continuous scale from 0 to 1, 0 representing no trust in the institution to look out for you and your family and 1 representing a great deal of trust. All regressions also include each sociodemographic characteristics, state pandemic severity (logged case rate and logged death rate), state pandemic policy responses (mask mandate, business reopening, and stay-at-home order), state fixed effects, survey fixed effects and use Axios/Ipsos survey weights. For full regression results, see table A.14.
- Figure 4.
Association Between Trust and Protective Health Behaviors (Coefficient Plots), Separately by Partisanship
Source: Authors’ calculations based on Surveys 5 through 23 of the 2020 Axios/Ipsos Coronavirus Poll, administered April 10 to August 31, 2020 (Ipsos 2020).
Note: Each figure presents point estimates and 95 percent confidence intervals from a different regression. Trust is measured on a continuous scale from 0 to 1, 0 representing no trust in the institution to look out for you and your family and 1 representing a great deal of trust. All regressions also include each sociodemographic characteristics, state pandemic severity (logged case rate and logged death rate), state pandemic policy responses (mask mandate, business reopening, and stay at home order), state fixed effects, survey fixed effects and use Axios/Ipsos survey weights. For full regression results, see table A.17.


Tables

Online Appendix
Files in this Data Supplement:
In this issue


Jump to section
Related Articles
Cited By...
- No citing articles found.