
Article Figures & Data
Figures
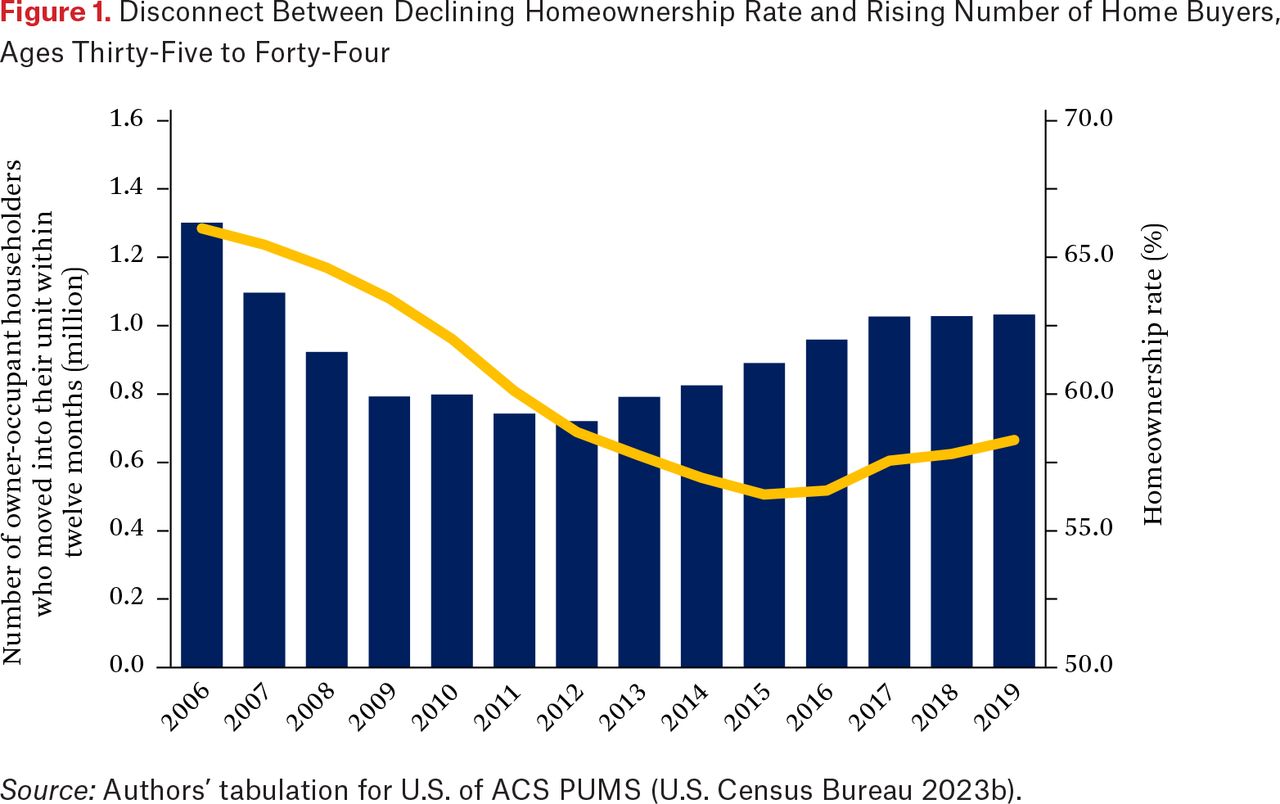
- Figure 1.
Disconnect Between Declining Homeownership Rate and Rising Number of Home Buyers, Ages Thirty-Five to Forty-Four
Source: Authors’ tabulation for U.S. of ACS PUMS (U.S. Census Bureau 2023b).
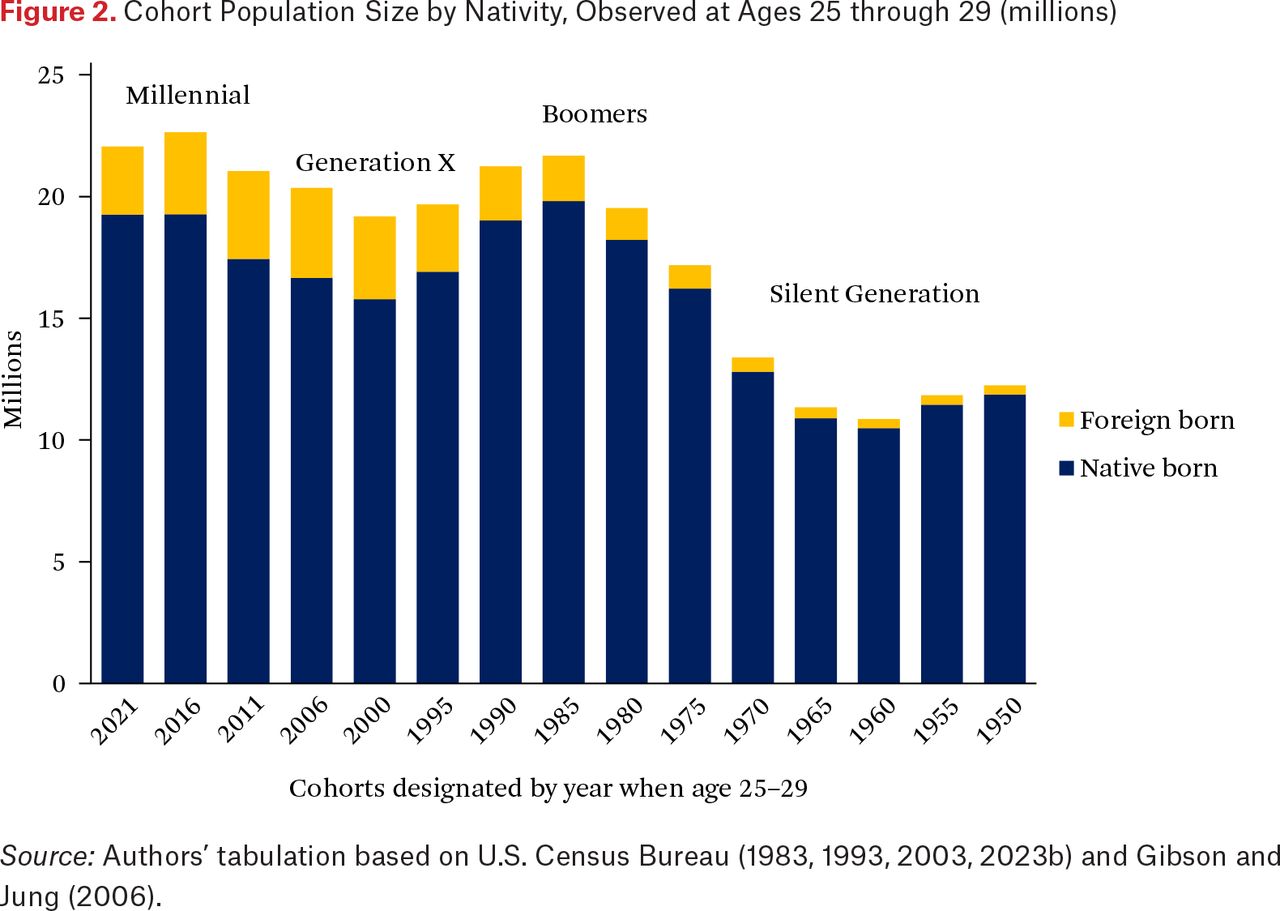
- Figure 2.
Cohort Population Size by Nativity, Observed at Ages 25 through 29 (millions)
Source: Authors’ tabulation based on U.S. Census Bureau (1983, 1993, 2003, 2023b) and Gibson and Jung (2006).
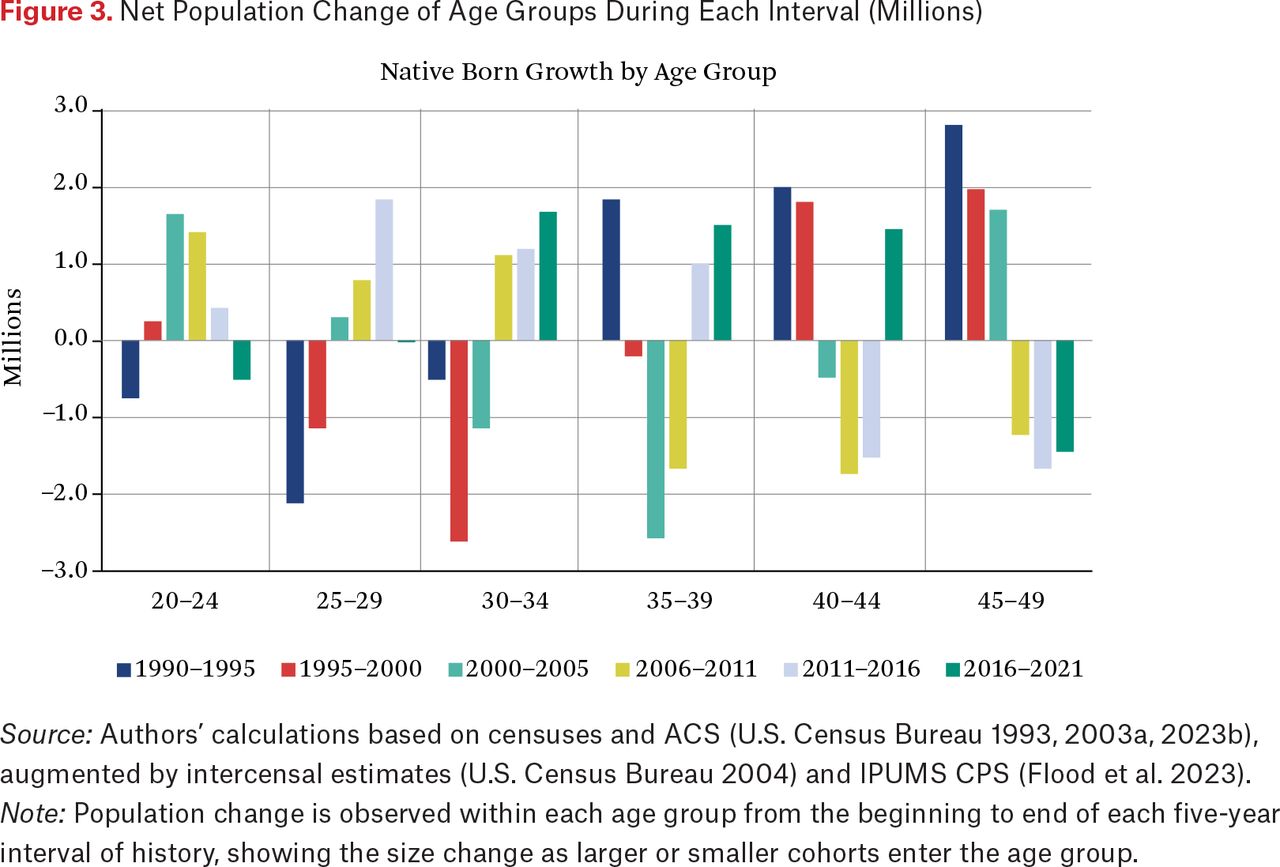
- Figure 3.
Net Population Change of Age Groups During Each Interval (Millions)
Source: Authors’ calculations based on censuses and ACS (U.S. Census Bureau 1993, 2003a, 2023b), augmented by intercensal estimates (U.S. Census Bureau 2004) and IPUMS CPS (Flood et al. 2023).
Note: Population change is observed within each age group from the beginning to end of each five-year interval of history, showing the size change as larger or smaller cohorts enter the age group.
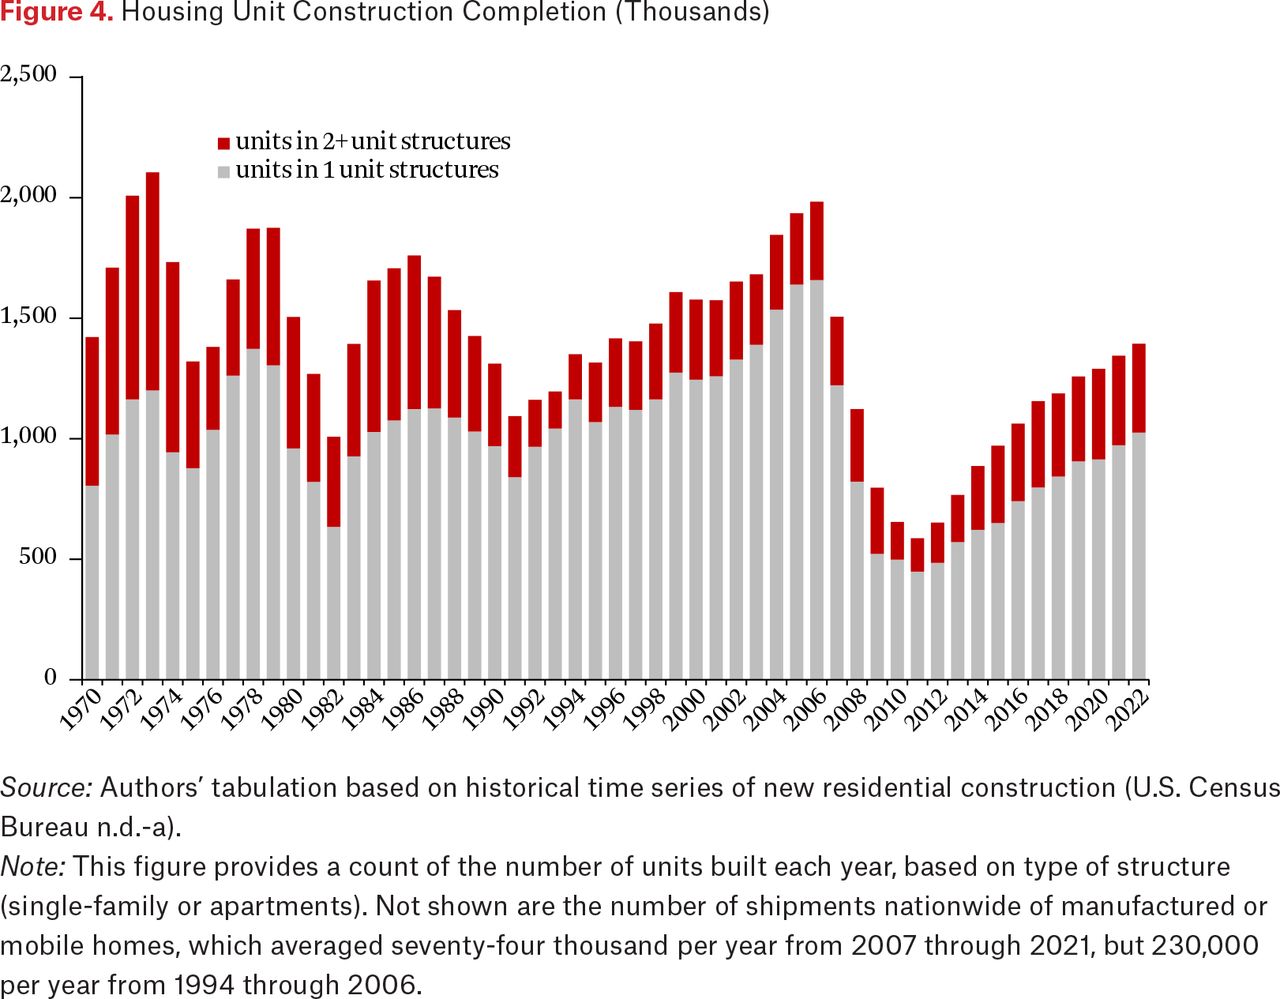
- Figure 4.
Housing Unit Construction Completion (Thousands)
Source: Authors’ tabulation based on historical time series of new residential construction (U.S. Census Bureau n.d.-a).
Note: This figure provides a count of the number of units built each year, based on type of structure (single-family or apartments). Not shown are the number of shipments nationwide of manufactured or mobile homes, which averaged seventy-four thousand per year from 2007 through 2021, but 230,000 per year from 1994 through 2006.
- Figure 5.
Homeownership Trend in Quarterly Press Release Through 2016
Source: U.S. Census Bureau 2016, figure 4.
Note: This figure, example taken from 2016, is a standard part of the press release for the Housing Vacancies and Homeownership report. The figure was repeated quarterly in identical format from 2010 through 2023 (updated three months each time).
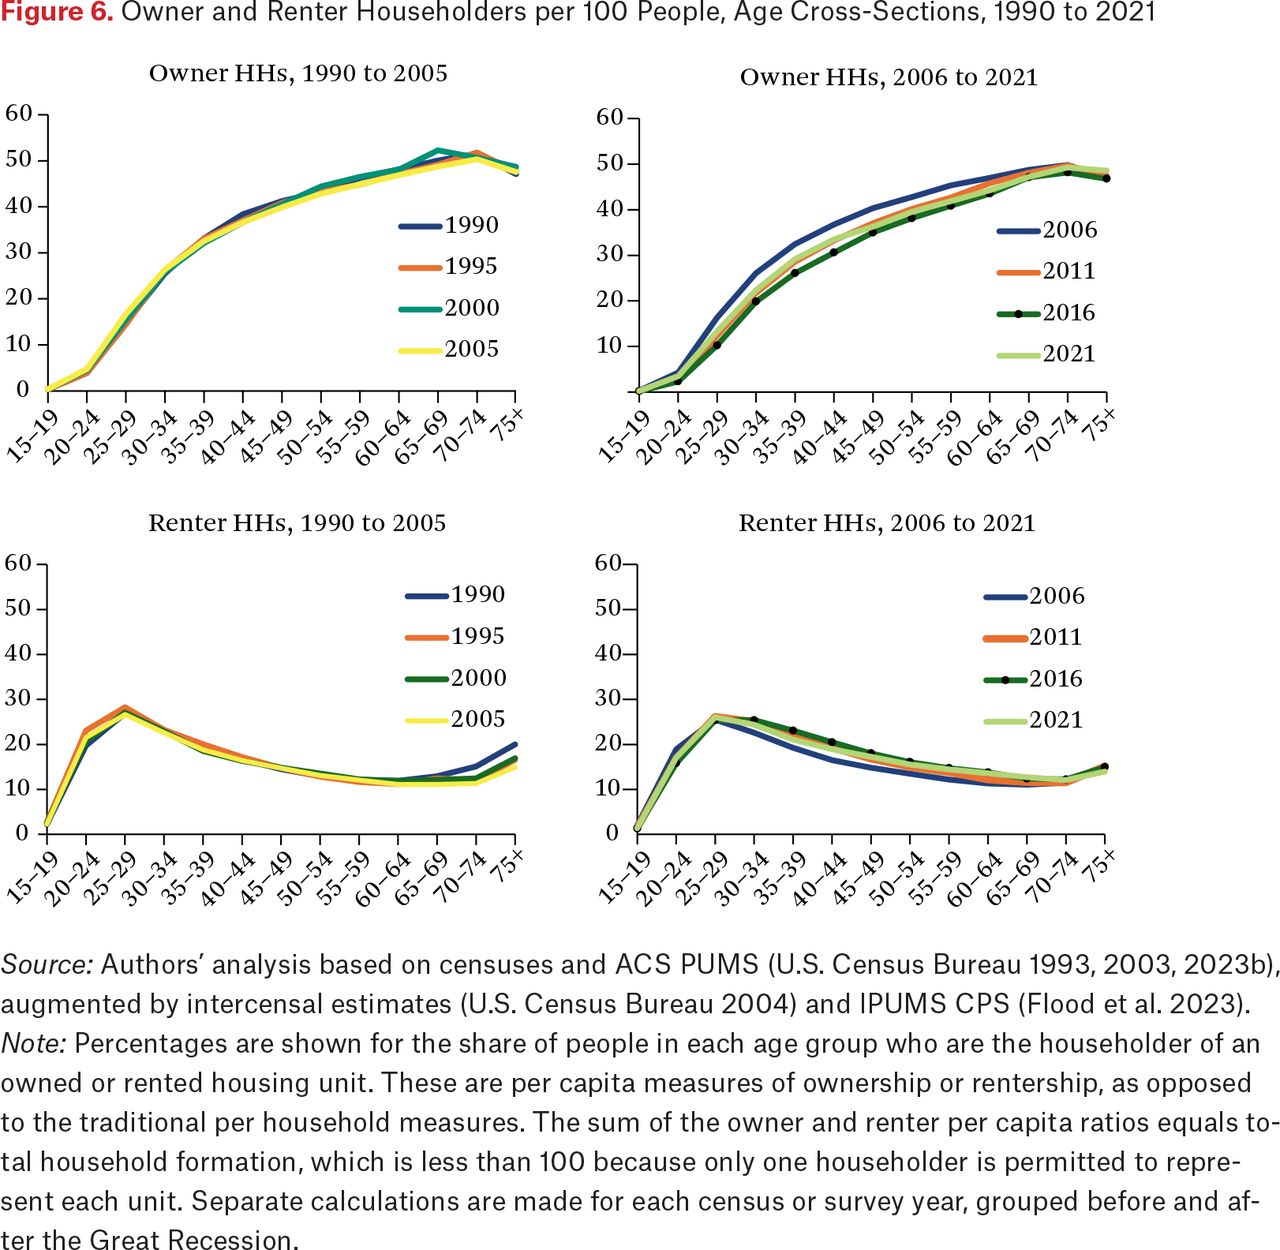
- Figure 6.
Owner and Renter Householders per 100 People, Age Cross-Sections, 1990 to 2021
Source: Authors’ analysis based on censuses and ACS PUMS (U.S. Census Bureau 1993, 2003, 2023b), augmented by intercensal estimates (U.S. Census Bureau 2004) and IPUMS CPS (Flood et al. 2023).
Note: Percentages are shown for the share of people in each age group who are the householder of an owned or rented housing unit. These are per capita measures of ownership or rentership, as opposed to the traditional per household measures. The sum of the owner and renter per capita ratios equals total household formation, which is less than 100 because only one householder is permitted to represent each unit. Separate calculations are made for each census or survey year, grouped before and after the Great Recession.
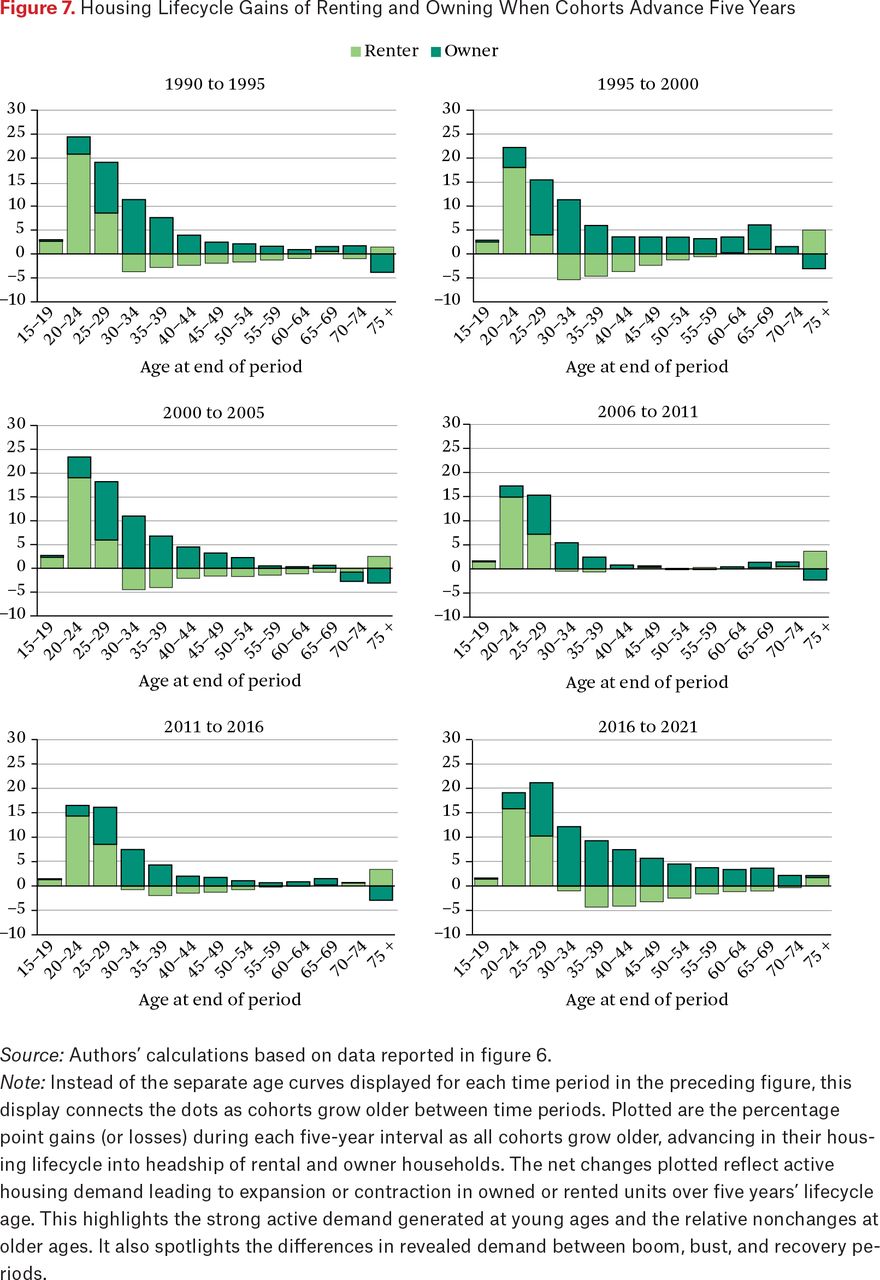
- Figure 7.
Housing Lifecycle Gains of Renting and Owning When Cohorts Advance Five Years
Source: Authors’ calculations based on data reported in figure 6.
Note: Instead of the separate age curves displayed for each time period in the preceding figure, this display connects the dots as cohorts grow older between time periods. Plotted are the percentage point gains (or losses) during each five-year interval as all cohorts grow older, advancing in their housing lifecycle into headship of rental and owner households. The net changes plotted reflect active housing demand leading to expansion or contraction in owned or rented units over five years’ lifecycle age. This highlights the strong active demand generated at young ages and the relative nonchanges at older ages. It also spotlights the differences in revealed demand between boom, bust, and recovery periods.
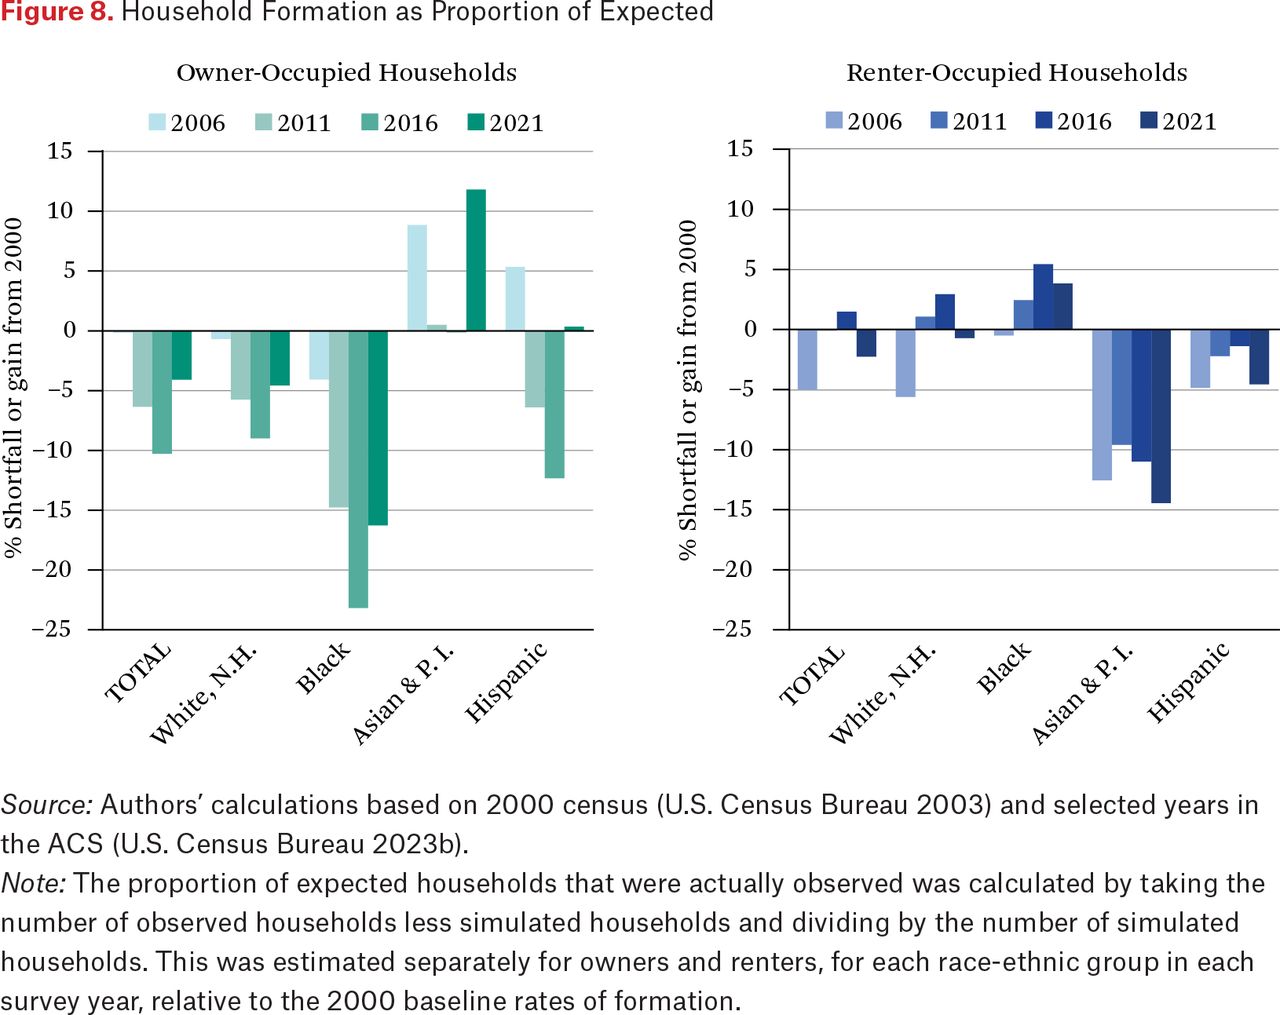
- Figure 8.
Household Formation as Proportion of Expected
Source: Authors’ calculations based on 2000 census (U.S. Census Bureau 2003) and selected years in the ACS (U.S. Census Bureau 2023b).
Note: The proportion of expected households that were actually observed was calculated by taking the number of observed households less simulated households and dividing by the number of simulated households. This was estimated separately for owners and renters, for each race-ethnic group in each survey year, relative to the 2000 baseline rates of formation.


Tables
Appendix
Appendix
Files in this Data Supplement:
In this issue


Jump to section
Related Articles
Cited By...
- No citing articles found.