
Abstract
This paper finds that U.S. employment changed differently relative to output in the Great Recession and recovery than in most other advanced countries or in the United States in earlier recessions. Instead of hoarding labor, U.S. firms reduced employment proportionately more than output in the Great Recession, with establishments that survived the downturn contracting jobs massively. Diverging from the aggregate pattern, U.S. manufacturers reduced employment less than output while the elasticity of employment to gross output varied widely among establishments. In the recovery, growth of employment was dominated by job creation in new establishments. The variegated responses of employment to output challenges extant models of how enterprises adjust employment over the business cycle.
How did the U.S. labor market, widely viewed as the most market-driven and flexible among advanced countries, weather the Great Recession and ensuing recovery? The preceding decades’ ballyhoo about the great American jobs machine notwithstanding, employment fell sharply in the Great Recession and increased slowly in the recovery so that in 2015, six years into the recovery, the employment-population ratio was 3.6 points lower than in 2007.1
This paper combines establishment datasets from Census Research Centers—the Longitudinal Business Data Base (LBD) and the Census and Survey of Manufacturers—with decennial census long-form data on the characteristics of employees in establishments and National Science Foundation data on the research spending of firms to analyze the establishment level underpinnings of employment changes in the Great Recession and during recovery.2 Appendix A summarizes the characteristics of the LBD and of the other datasets that we combined with the LBD establishment data for our analysis.
The paper finds the following:
In the Great Recession U.S. firms reduced labor usage proportionately more than GDP, producing countercyclic changes in productivity, in contrast to labor hoarding in past U.S. recessions and labor hoarding in other advanced countries in the Great Recession.
Recession job loss was driven by contraction of jobs in establishments that survived the downturn, whereas recovery job gains came largely from new establishments entering the economy.
U.S. manufacturing diverged from the bulk of the economy by hoarding labor in the Great Recession.
Manufacturing establishments with observably similar characteristics had widely varying responses of employment to output in the downturn and recovery.3
The findings show a substantial gap between models of employment in a flexible labor market and actual employment determination in the aftermath of the Great Recession.
EMPLOYMENT CHANGES DIFFERED THIS TIME
Figures 1 and 2 compare GDP and employment in the Great Recession/recovery and in the three preceding cycles relative to their pre-recession values.
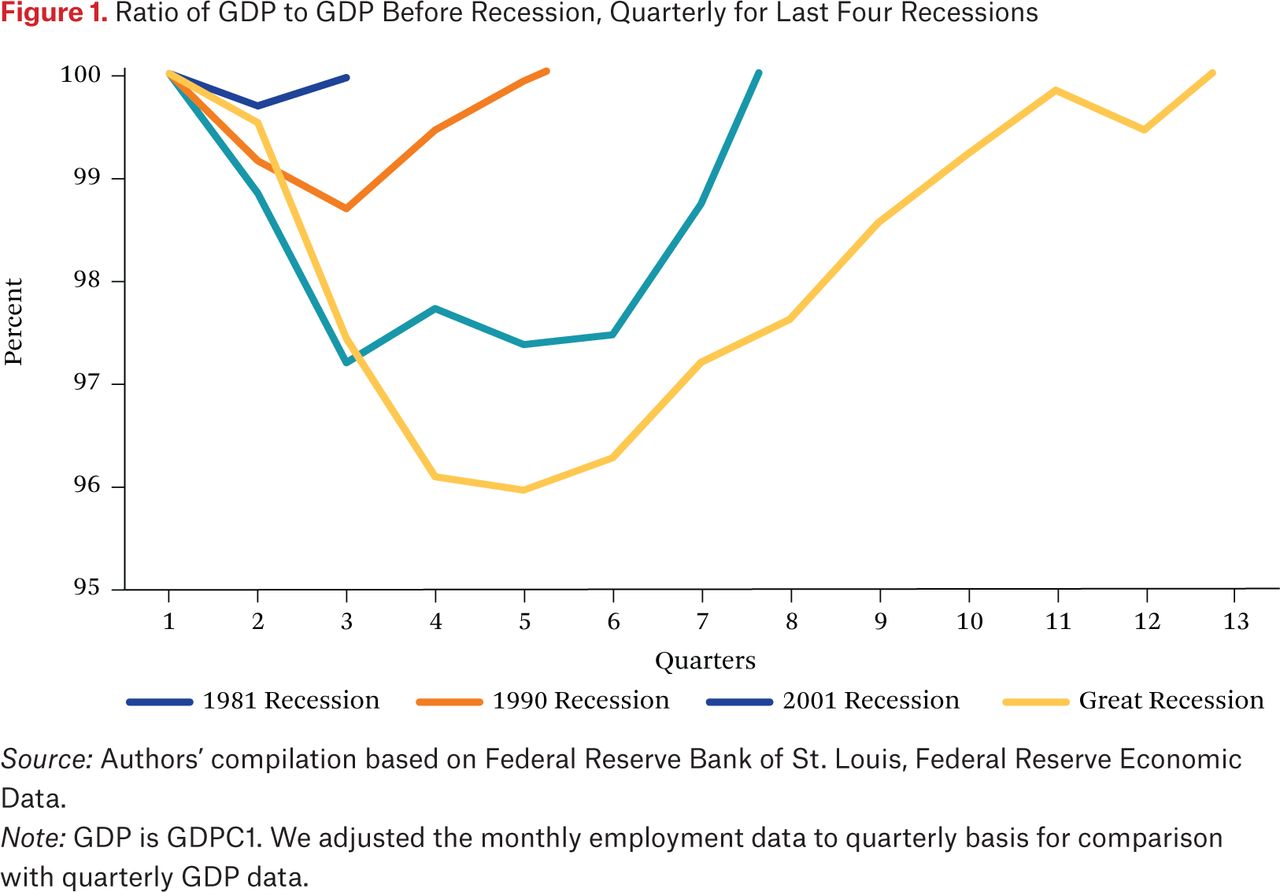
Ratio of GDP to GDP Before Recession, Quarterly for Last Four Recessions
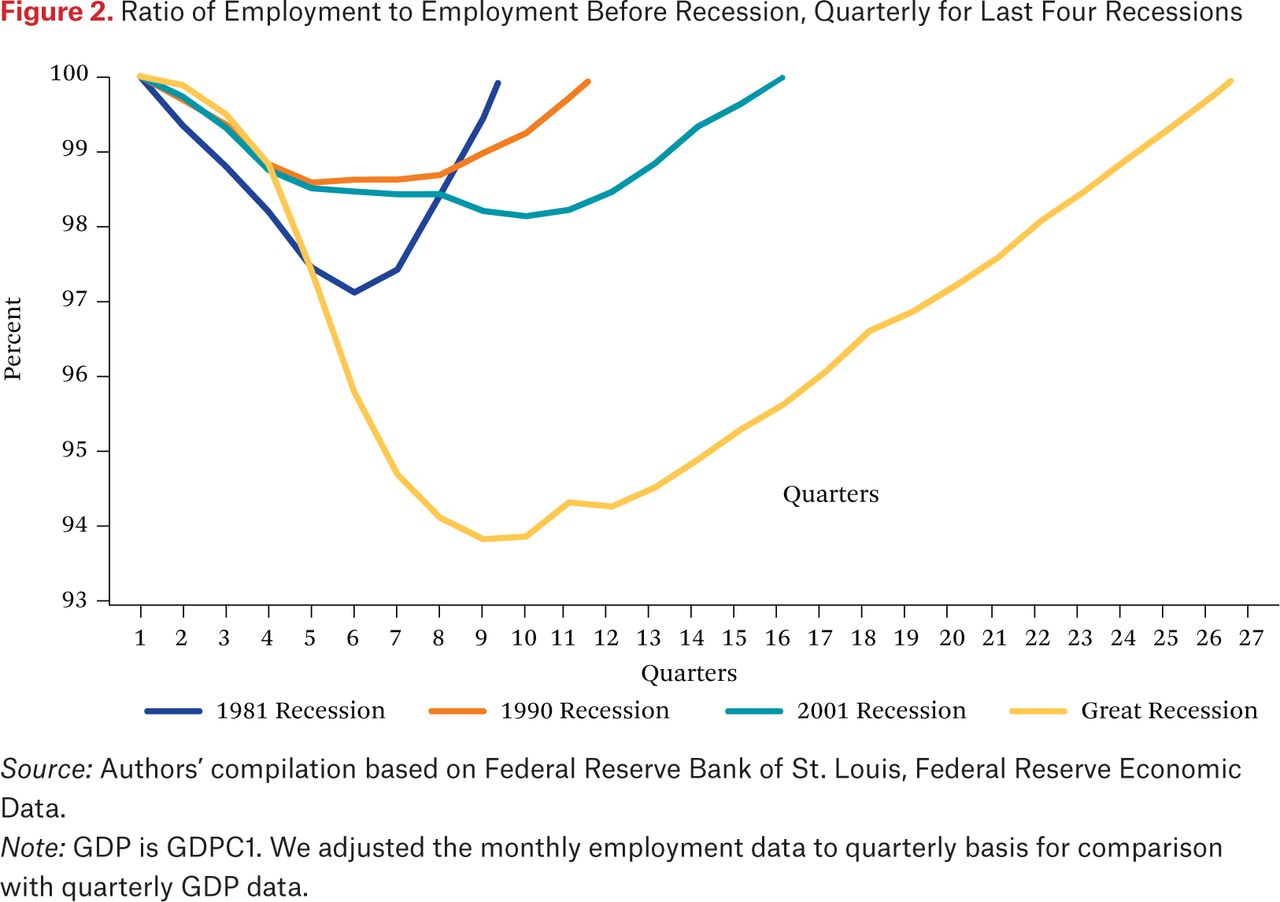
Ratio of Employment to Employment Before Recession, Quarterly for Last Four Recessions
Figure 1 displays the ratio of GDP to pre-recession peak GDP by the number of quarters in each of the recessions. The decline in GDP relative to pre-recession GDP shows that the Great Recession was deeper and longer than the previous three recessions. Befitting its name, the Great Recession’s loss of output was the largest since the Great Depression.
Figure 2 displays the ratio of the number of jobs before the recession to the number afterward by number of quarters in each recession, where we calculated the quarterly averages from monthly payroll employment data. Given the big decline in output in the Great Recession, it is no surprise that quarterly employment fell more than in the earlier recessions: an over 6 percent loss of jobs from pre-recession quarterly employment to the quarter when employment bottomed out compared to an average loss of below 3 percent in the other recessions depicted in the figure. The finer grained monthly data shows a drop in employment of 5.3 percent from December 2007, when the NBER (National Bureau of Economic Research) dated the beginning of the recession, to June 2009, when it dated the end of the recession. But employment fell for the first eight months of the recovery, bottoming out in February 2010 at 6.3 percent below its pre-recession peak. Employment in the Great Recession was below its previous peak for 26 quarters, substantially exceeding that for the other recessions.
Comparing the two panels, the link between changes in employment and changes in output as employment weakened, indicating that employment had moved from being a coincident indicator of the cycle to a laggard indicator. In the 1981 recession, employment recovery tracked GDP recovery closely. In the 2001 recession, the GDP decline was short but employment kept shrinking after GDP recovered. In the Great Recession, employment fell proportionately more than output and did not begin to recover until three quarters after output increased. The 4.2 percent drop in real GDP from peak to trough and the 5.3 percent fall in employment over the same period produces an implicit employment-to-GDP elasticity of 1.26 (= 5.3/4.2). In the recovery, by contrast, GDP’s 7.8 percent increase through Q1 of 2015 exceeded employment’s 4.8 percent increase, with an implicit employment-to-GDP elasticity of 0.62 (= 4.8/7.8). The rapid drop in labor usage and the slow recovery produced countercyclic labor productivity, contrary to the pro-cyclic labor productivity in earlier recessions (Okun 1970; Solow 1964; Biddle 2014) that led economists to develop labor hoarding models of firms’ employment decisions.4
LABOR PRODUCTIVITY AND HOARDING
Studies of employment adjustments in the business cycle began with the premise that productivity should vary countercyclically (Biddle (2014). The reason is clear. Recession reductions in employment should raise labor productivity due to the increase in the marginal productivity of variable labor relative to fixed capital. In a recession, workers who remain employed have more capital with which to work and thus should have higher productivity. Recovery increases in employment, by contrast, ought to reduce labor productivity as additional employees lower the capital-to-employee ratio. In addition, selectivity in hiring or firing (which macro models generally ignore) also suggests a countercyclical movement of labor productivity, as firms lay off the least productive workers in a recession and hire them back in recovery. To explain the surprising pro-cyclic movement of labor productivity in the business cycles from the 1960s to the 1990s, analysts developed “labor hoarding” models in which the costs of adjusting employment made workers a quasi-fixed rather than variable factor of production.5
In the Great Recession, however, U.S. productivity did not show the drop predicted by labor hoarding. This contrasted with the situation in almost all other advanced countries, where productivity fell in the recession. Table 1 documents the Great Recession pattern of changes in GDP per hour with data on GDP per hour worked for major countries from the Conference Board’s International Labor Comparisons (ILC) program. Columns 1 to 3 give the estimated GDP per hour worked in 2007, 2009, and 2012. Column 4 shows the annualized rate of change of productivity in the recession (2007 to 2009), and column 5 gives the annualized rate in the recovery (2009 to 2012). The last column records the difference between annualized productivity growth in the recovery and the recession. Positive differences imply pro-cyclic productivity. Negative differences imply the opposite.
Level and Percentage Changes of Real GDP per Hour Worked in the Great Recession (2007–2009) and Recovery (2009–2012)
All of the countries save the United States and Japan, which was mired in its lost decade of economic stagnation, had positive recovery-recession differences, implying pro-cyclic movements of productivity. The decline in productivity in most countries came, however, not only from the “normal” costs of adjustments at the heart of hoarding models but also from explicit collective bargaining or government policies to save jobs in the Great Recession. In Sweden, unions and employers negotiated agreements that maintained many jobs during the recession. In Germany, the government introduced a short-term work program and work allowance that subsidized part of labor cost in firms whose receipts had decreased by 10 percent. The Netherlands paid 70 percent of the wages for the nonwork hours of employees whom firms kept “on the job.” And so on (Freeman 2013). Absent agreements and policies, European firms would likely have terminated more workers in the recession and hired more in the recovery, attenuating if not reversing the pro-cyclic movement of labor productivity.
Employment adjustments relative to output in U.S. manufacturing, however, looked more like adjustments in non-U.S. OECD (Organization for Economic Cooperation and Development) countries than those in the aggregate United States. Bureau of Labor Statistics data show manufacturing employment declining proportionately less than output in the downturn—a sign of labor hoarding absent substantial bargaining or government policies pressuring or rewarding firms to maintain employment. As a result, from Q1 2008 to Q4 2009 real value added per hour in manufacturing fell by 24 percent while in the recovery real value added per hour increased by 27 percent through Q4 2012.6 However, Conference Board data tell a different story for real gross output per hour worked, where gross output includes intermediate goods and materials as well as value added. The data for gross output per hour show increased manufacturing productivity in the Great Recession.7 The difference between the ILC and BLS measures reflects a divergent movement of the price deflator for real gross output and the price deflator for real value added, whose resolution lies beyond this study.8
To better identify the role of the Great Recession and recovery on changes in employment from the long-term effects of technological change and capital-labor substitution on employment9 requires a micro-level analysis of employment, to which we turn next.
CHANGES IN CONTINUING, EXITING, AND ENTERING ESTABLISHMENTS
To probe the micro-underpinnings of the United States’ Great Recession employment experience, we decomposed changes in employment into the changes that occur in continuing establishments—those that operated before the downturn and kept operating through the recession—and changes that result from the exit and entry of establishments. Let E(t) be employment in year t; Ec(t) be employment in t in establishments operating in t and t–1; Eb(t) be employment in establishments that entered the market in year t (operated in t but not in t–1); and Ed(t–1) be employment in establishments that exited the market in year t (operated in t–1 but not in t). Then the change in employment from t–1 to t is:
where [Ec(t) – Ec(t–1)] is the change among continuers and [Eb(t) – Ed(t–1)] is the change due to job creation in entering establishments minus job destruction in exiting establishments.
Dividing both sides of the equation by E(t) – E(t–1) gives the relative contribution of changes in continuers and of exit and entry to each part to the total change from (t –1 to t).
Table 2 presents this decomposition for one-digit-sector private sector industries and the entire private sector in the recession and ensuing recovery.10 Accepting the NBER dating whereby the end of the recession occurred in June 2009, we treat 2009 as the year when the recession ended and the recovery began in the BDS (Business Dynamics Statistics of the U.S. Census Bureau) annual data. The recession-period “All” line in table 1 shows a net loss of jobs of 5.007 million and a larger loss of 5.748 million among establishments that continued operating. The 0.741-million-job difference implies that in the Great Recession, entering establishments hired more employees than exiting establishments terminated. The one-digit-industry data locate one third of the recession job loss in manufacturing and almost 1/4th in construction for 58 percent of all job losses. In two other sectors with large declines in employment, retail trade and services, the decline occurred despite large net employment gains from exit and entry as continuing establishments contracted jobs massively.
Decomposition of Changes in Employment Among Continuing, Entering, and Exiting Establishments in the Great Recession (2007–2009) and the Recovery (2009–2012)
The recovery line labeled “All” in table 2 shows a different pattern. Changes in employment are dominated by exit and entry rather than by continuing establishments. Of the 2.187 million net gain of jobs, 1.385 million (63 percent) was due to new entrants creating more jobs than exiting establishments destroyed. Manufacturing and construction shed jobs through the recovery, with exit and entry accounting for 36 percent of the recovery job loss in manufacturing and 59 percent of the recovery job loss in construction. The importance of exit-entry in the recovery does not contravene the finding that the continuing establishments who make up the majority of establishments dominate changes in employment at all phases of the cycle. Appendix B shows that changes among continuers are the major component of job creation and destruction in the recovery and recession in the LBD data. What is distinct about our exit-and-entry analysis is that it organizes data around net changes in jobs, which depend on differences in job gain and loss among continuers relative to differences in job creation in entering establishments and job destruction in exiting establishments, rather than on the contributions of changes among these types of establishments to total job creation or destruction.
To illuminate further the dominance of continuers in recession job changes compared to exit and entry in recovery job changes, we decomposed employment changes into the changed number of establishments in the continuer, entrant, and exiting groups, and the average number of jobs gained or lost per establishment for each group. The “All” figures for the recession in table 3 show that continuing establishments dominated recession job loss because continuing establishments made up about 80 percent of all establishments.11 In the recession more establishments exited than entered, but an entering establishment created on average 1.2 jobs per job than the exiting establishments eliminated, so that exit and entry produced a modest net gain in employment. In manufacturing, by contrast, nearly 40 percent more establishments exited than entered the market and there was little difference in the average size of entering and exiting establishments, so that exit and entry contributed net to job loss. Still, continuers dominated job loss in manufacturing because of their large 6.4 decline in average employment.
Number and Average Employment Size of Exiting and Entering Establishments and Number of Continuing Establishments and Average Change in Employment of Continuers, Great Recession (2007–2009) and the Recovery (2009–2012)
The “All” changes in the recovery section of table 3 tell a different story. The dominance of entry-exit in the recovery is due primarily to the difference between the average gain in employment in entering establishments and the average loss in employment among exiting establishments.12 Again, however, manufacturing is different. Even in the recovery, more establishments exited than entered in manufacturing (and construction), and the average employment in exiting establishments exceeded the average employment of entrants.
To the extent that establishments that enter the market better fit existing economic conditions than establishments that exit, differences in their characteristics provide insight into the selectivity of technological and market forces. Figures 3 and 4 display the mean 2007 physical and human capital characteristics of manufacturing establishments that entered or exited in the recession or recovery.13 A characteristic that is more (less) frequent among entering than exiting establishments suggests that the characteristic’s economic value has increased (decreased) over time. The figure shows that entering establishments had larger capital-to-employee ratios, college shares of the work force, and made greater investment in computer per employee than exiting establishments but had similar ratios of non-production employees. These differences are consistent with technological upgrading and capital-human capital complementarity in the technology that affects employment.
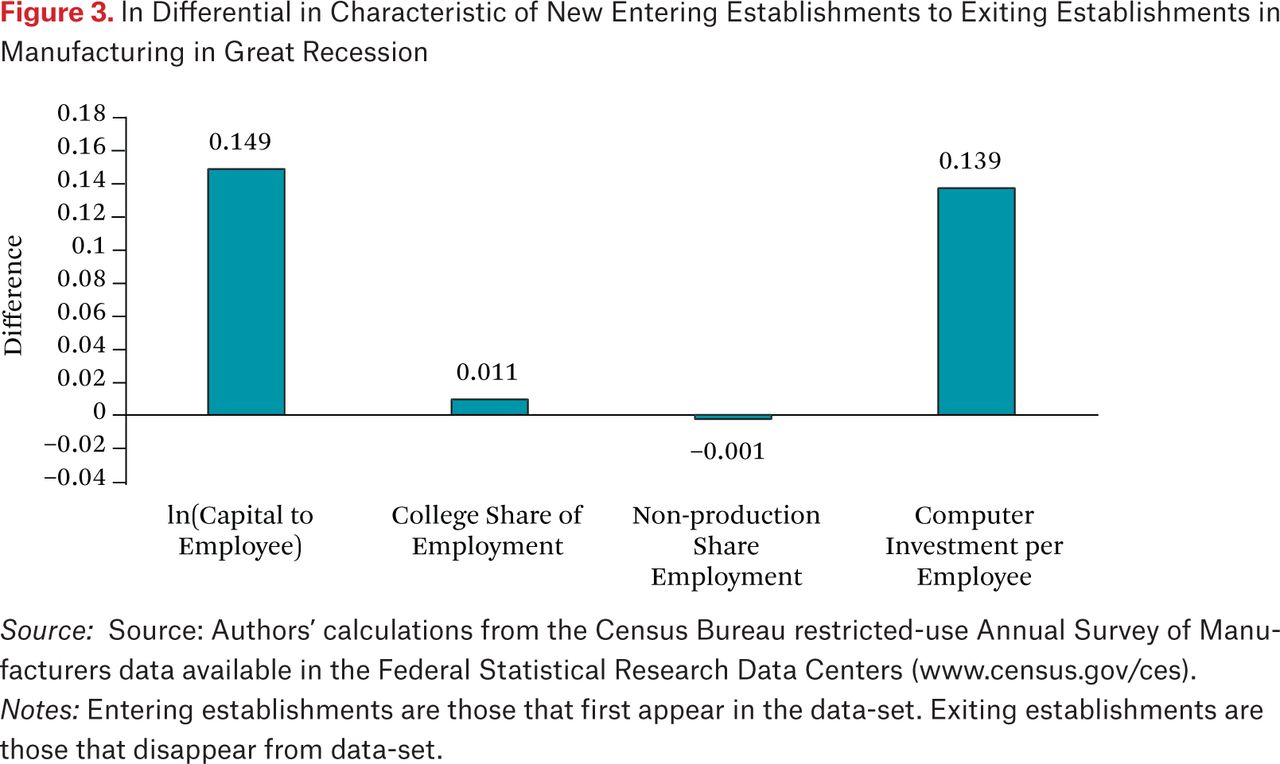
ln Differential in Characteristic of New Entering Establishments to Exiting Establishments in Manufacturing in Great Recession
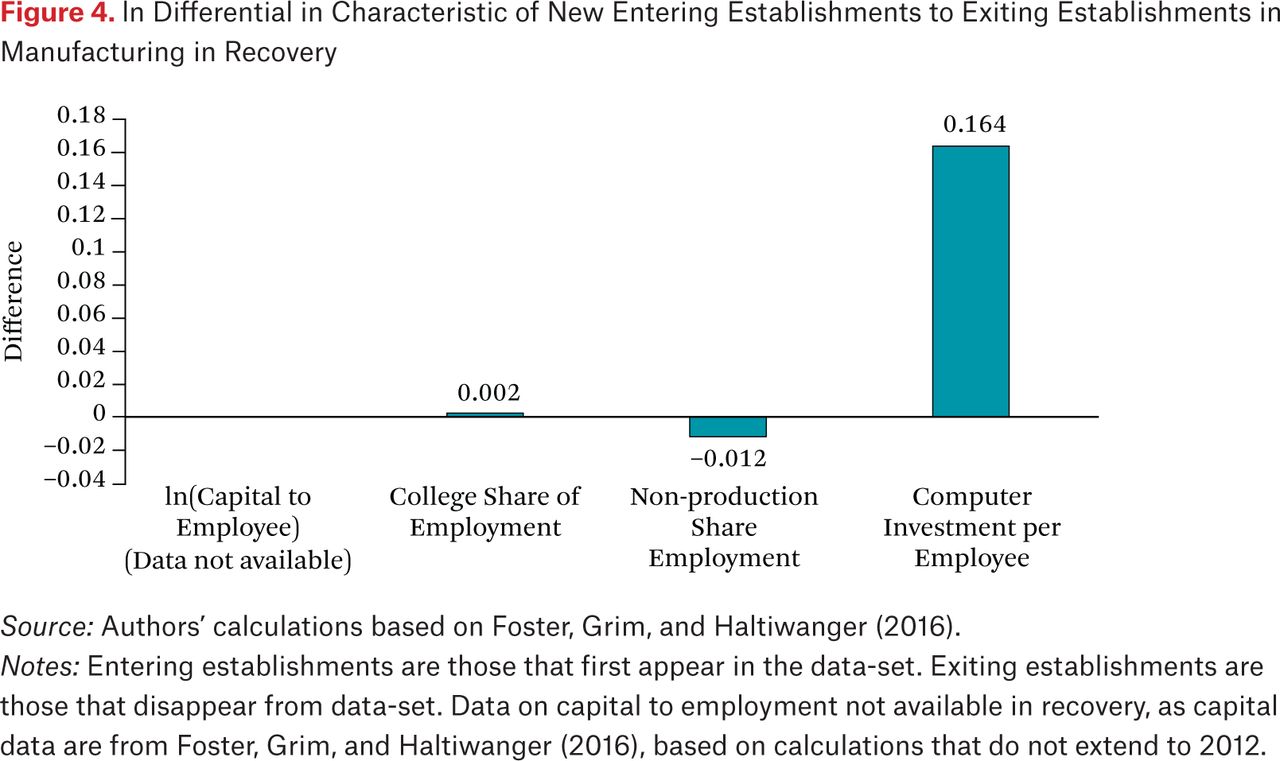
ln Differential in Characteristic of New Entering Establishments to Exiting Establishments in Manufacturing in Recovery
HETEROGENEITY IN RESPONSES TO OUTPUT SHOCKS
Behind average changes in employment lie distributions in which some establishments change employment more than the average and others less than the average because the market conditions they face differ from the average or their technologies differ, or because they respond differently than other establishments to the same conditions. Regardless of the cause, heterogeneity of responses among establishments is potentially important in the micro-underpinnings of aggregate employment changes in the business cycle.
Next we examine changes in employment relative to output among continuing establishments in manufacturing.14 We limit our analysis to manufacturing because the yearly production data in the Census Bureau’s Annual Survey of Manufacturers allows us to differentiate recession from recovery, whereas production data in the quinquennial Censuses of Production for other sectors lacks the time detail to distinguish the two parts of the cycle. We follow Census Bureau procedures and measure changes in employment relative to average establishment employment in the starting and ending period, in order to reduce the risk that large relative changes in employment for small establishments unduly affects the estimates.15
Table 4 shows the average annual changes in employment and output for all establishments and those in the 0–20th, 40th–60th, and the 80th–100th quintiles of changes ranked by rate of increase from lowest to highest. The natural measure of variation in these statistics is the inter-quintile range, defined as the difference between the top quintile’s mean change in employment and the bottom quintile’s mean change in employment. In the Great Recession, manufacturing employment declined on average by 13 percent while output declined by 18.6 percent, for an implicit employment-to-output elasticity of 0.70, per labor-hoarding behavior. The quintile changes reveal large increases in employment and output at the upper end of the distributions and large decreases at the lower end: a top-quintile employment increase of 42.1 percent compared to a bottom-quintile decrease of 90 percent, giving an inter-quintile range of 132 points; a top-quintile average increase in output of 33.8 percent and a bottom-quintile average decrease in output by 93 percent, giving an inter-quintile range of 127 points.
Changes in the Distribution of Employment and Output (Measured by Sales) of Continuing Manufacturing Establishments in the Great Recession (2007–2009) and Recovery (2009–2012), Compared to Three Earlier Recession and Recoveries
In the recovery, manufacturing employment fell by 3.8 percent while output increased by 13.1 percent, producing a 16.9 percent increase in productivity. But, as in the recession, the averages masque huge variation: a 78 percent employment drop in the bottom quintile compared to a 57.7 percent increase in the top quintile; a 63.2 percent output drop in the lowest quintile compared to a 72.1 percent increase in the top quintile. The large recession gain in employment and output in the highest quintile of establishments as compared to the large recovery loss of employment and output for the lowest quintile highlights the heterogeneous experience of establishments. Some establishments expand even in a huge recession and some contract even in a recovery.
To see whether the heterogeneity was exceptional to the Great Recession or normal for recent recessions, we computed inter-quintile ranges of change in employment and output in the 2000-to-2002, 1989-to-1991, and 1979-to-1981 recessions. The bottom panel of table 4 shows smaller inter-quintile ranges of changes in those recessions than in the Great Recession and smaller inter-quintile ranges in changes in the recovery phases than in the recovery from the Great Recession. But, the ranges still give evidence of huge heterogeneity.16
TECHNOLOGICAL CHANGE AND CAPITAL-LABOR SUBSTITUTION
Like comparisons of the characteristics of entering and exiting establishments, changes in employment or output associated with the characteristics of continuing establishments offer insight into the direction of economic and technological forces. A characteristic that raises growth of output or employment in a regression indicates that market forces favor that characteristic. To see how the attributes of establishments affect employment and output, we regressed changes in employment and output in the Great Recession and in the recovery separately, on a range of factors, including the share of college graduates; capital per employee; computer investment per employee; and whether the firm that owns the establishment did R&D, among others.17 The regressions include a vector of three-digit NACE level industry dummies interacted with the state location of the establishment, so the estimates come from variation within industry-state cells. To ease interpretation of the regressions, we normalized the variables to their average 2007 value so that the constants measure change for an establishment with average characteristics.
Column 1 of table 5 shows the estimated coefficients from OLS (ordinary least squares) regressions of changes in output in the Great Recession on the characteristics. The estimated constant shows that revenue in the average establishment declined 19.2 percent from 2007 to 2009. Column 2 records the estimated coefficients for regressions of changes in employment in the recession on the characteristics. The estimated constant shows that employment declined by 14.7 percent. The smaller change of employment than of output to the recession reflects “labor hoarding” for establishments with similar characteristics. The characteristics that differentiated entering from exiting establishments in figures 3 and 4 affect output and employment in table 5 in a similar manner: establishments with relatively more college graduates, capital per employee, and computer investment per employee had higher growth than other establishments in the same industry and state during the recession. By contrast, establishments in firms that do R&D averaged a 3.9 point greater increase in output than establishments in non-R&D firms and had a 0.8 point smaller change in employment. This likely reflects the fact that R&D-based technology creates process as well as product innovation. New and improved products add to output and employment whereas new production processes are often labor-saving and can reduce employment.
Regression Coefficients and Standard Errors for the Relation of Establishment Characteristics on Change in Output (Measured by Sales) and Change in Employment in the Recession (2007–2009) and the Recovery (2009–2012)
Columns 3 and 4 examine the relation between establishment characteristics and changes in output and employment in the recovery. An establishment with average characteristics had output growth of 16.9 percent but employment growth of just 3.4 percent reflecting the “jobless recovery.” The estimated impacts of establishment characteristics on output and employment in the recovery differ markedly from columns 1 and 2, estimated impacts of characteristics in the recession. The coefficients for the share of college employees and computer investment per employee change from positive in the recession to negative in the recovery. The estimated coefficients on R&D-performing firms shift from positive to negative on output and become more negative on employment. Only the estimated coefficients on capital-to-labor ratios show similar patterns in both phases of the cycle, with capital-intensive firms expanding more in output and employment.18
A plausible explanation for the general pattern of sign reversal is labor-hoarding behavior, with establishments that were more negatively impacted by the recession being commensurately less positively impacted by the upturn; and conversely for those less impacted by the recession. Since firms hoard labor in recessions to avoid recruiting labor in recoveries, the hoarding firm will reduce employment less in the recession and increase employment less in the recovery than the firm that does not hoard labor. Technological change and capital-labor substitution aside, a firm that hoarded completely would lay off no one in a recession and would not have to hire anyone in a recovery to bring output to its pre-recession level. By contrast a firm that treated labor as completely variable would lay off 10 percent of its work force when output fell by 10 percent and rehire all those workers when output regained the pre-recession level.
To assess the extent of job hoarding behavior at the establishment level, we estimate equations linking ln changes in establishment employment to ln changes in establishment output in the recession and recovery periods. Hoarding at the establishment level would show up in an estimated coefficient of the change in employment on the change in output below 1.0. Column 1 of table 6 gives an estimated coefficient on output of 0.389 in the recession period, indicative of considerable hoarding. Column 2 of table 6 gives an estimated coefficient on output of 0.473 in the recovery period, far below the 1.0 that one would get if labor was a completely variable input.
Regression Coefficients (Standard Errors) for Changes in Employment on Changes in Output in Manufacturing Establishments in the Recession (2007–2009) and Recovery (2009–2012)
Taking the analysis a step further, the establishment data allow us to make a direct test of the proposition that labor hoarding in recession reduces growth of employment in the recovery. Using the information on the changes in establishment employment and output in the recession, we estimate a “recession hoarding” variable for each establishment and add that measure to the regression of employment changes on output changes in the recovery. Our recession hoarding measure is the residual from the column 1 estimate of the change in employment on output in the recession. The larger the change in employment relative to its predicted level from the regression, the larger is the estimated amount of hoarding.19 Column 3 shows that this measure obtains a large significant negative effect in the regression for the change in employment in the recovery. Hoarding evinces itself in the adjustments of employment throughout the distribution of employment and output changes as well as in the different average changes in employment and output in recession and recovery.
Finally, we examine the hoarding notion by contrasting the actual pattern of changes in employment and output to a well-specified counterfactual that abstracts from the business cycle. Assume that absent the recession output, employment would have changed smoothly from 2007 to 2012. This identifies the impact of the cycle as the difference between the actual changes and the counterfactual smooth change. Columns 1 and 2 in table 7 give the regression coefficients of the growth of output and employment on the characteristics of establishments in the 2007–2012 period smooth growth counterfactual.20 These regressions show that the college-educated share of the workforce had little relation to growth of output or employment over the entire period; that R&D of the firm is associated with increased output but reduced employment; whereas capital-to-employee ratios and computer investments per employee are positively associated with output and employment. Column 3 gives the annual change in output per employee associated with each characteristic obtained by dividing the difference between the columns 1 and 2 coefficients by 5 for the five years covered.
Estimated Regression Coefficients (and Standard Errors) for Relation Between Change in Employment and Output and Establishment Characteristics, 2007–2012, Average Annual Changes in Output per Employee and Recession and Recovery Deviations from Average Changes
Columns 4 and 5 record the deviations of productivity measured by output per employee in the recession and in the recovery from the smooth change. For an establishment with average characteristics, productivity increased by 7.1 ln points more in the recession than in the benchmark smooth adjustment. By contrast, the average establishment fell short of the smooth benchmark by 9.5 points in the recovery. Since changes in recession and recovery are deviations from smooth growth, the estimated effects for independent variables in recession and recovery necessarily alternate in sign. The biggest differences in the coefficients are for the share of college graduates. Establishments with high college-educated shares stabilized productivity over the cycle more than other establishments.21
CONCLUSION
Our analysis of aggregate, sectoral, and establishment-level changes in employment and productivity in the Great Recession and recovery document that employment responses differed greatly to changes in output between the United States and other advanced countries, between U.S. manufacturing and the bulk of the U.S. private sector, and among U.S. manufacturing establishments. Taking the economy as a whole, U.S. firms reduced employment proportionately more than output in the Great Recession, in contrast to the labor hoarding behavior in most advanced economies and in earlier U.S. recessions. The main pathway for the huge reduction in U.S. employment was massive contractions of employment by existing establishments. The pathway for job growth in the recovery, by contrast, was dominated by the exit-and-entry of establishments, with new entrants to the market adding greatly to employment. Manufacturing establishments, however, behaved differently, hoarding labor in the recession while evincing widely varying elasticity of employment to gross output in recession and in recovery.
These differences in employment responses challenge simple models of how enterprises adjust employment in downturns and recoveries. Given that labor institutions are generally stronger in the European Union than in the United States, it is natural to attribute U.S.-EU differences in employment responses to the different institutional settings, in particular to greater employment protection legislation and higher density of collective bargaining in the EU than in the United States.22 But, as noted earlier, many EU countries introduced explicit policies to preserve jobs in the Great Recession and unions and employer federations negotiated new collective bargaining agreements, suggesting two different institutional explanations for hoarding behavior in Europe. The first explanation attributes most of the smaller employment response to the “normal costs of adjustment” stressed in hoarding models. The second explanation attributes most of the preservation of jobs to the emergency legislation and agreements. An institutional explanation ought to provide estimates of these two routes of impact. It should also explain the sizable differences in employment responses among countries beyond the United States in table 1—for instance, why productivity fell in the recession in Britain, Germany, and Denmark, while increasing in Spain, Ireland, and Austria. Analyses that propose institutional explanations for U.S.-EU differences should be tested on the details of the proposed institutions at country and more micro-levels.
The huge layoffs among continuing establishments and higher elasticity of job loss to output in the United States in the Great Recession than in previous recessions may also be partly attributable to institutional changes within the country, such as the continued decline in collective bargaining coverage and the shift in the United States toward temporary contracts for more and more workers. The growth of the “gig economy,” characterized by a large number of temporary subs and contract workers, in many nonmanufacturing sectors invariably makes labor a more variable input, which could explain part of the higher elasticity of employment to output in the Great Recession. But with labor more variable, the elasticity of employment to output in the recovery should also be high, which it was not. The timing of the shift from permanent to more temporary labor contracts also does not fit well with job shedding in the recession. Larry Katz and Alan Kreuger (2016) date the shift toward temporary, on-call, and related jobs as occurring largely from 2005 to 2015, mainly occurring after the Great Recession.23 Perhaps the employment-at-will doctrine that dominates U.S. labor contracts gives most firms sufficient flexibility to lay off workers in a crisis without temporary contracts, on-call work, and the like.24 The Great Recession collapse of construction, where almost all jobs are short-term gigs, may also have contributed to the absence of labor hoarding in the broad economy.25
Within the United States, the finding of continued hoarding behavior in manufacturing poses the question of why manufacturing responded so differently to the Great Recession than most other sectors. One possibility is that globalization allowed U.S. manufacturers to offshore much of the variable part of production work, so that a larger proportion of remaining workers had skills and knowledge that made the adjustment cost of layoffs more expensive than in the past. Testing this proposition requires evidence on the extent to which firms and their suppliers adjusted output and employment overseas in the recession. If U.S. firms vary in their ability to move employment adjustments downstream along their supply chains, globalization may also help explain some of the heterogeneity of employment responses to output among observationally similar establishments. Evidence on establishment-level changes in other advanced countries could also help determine the extent to which the U.S. manufacturing experience in the Great Recession was driven by the technology and global market in the sector as opposed to institutional differences between the United States and other advanced economies.
In sum, the evidence of heterogeneity in responses of employment to output among countries and among observationally comparable manufacturing establishments and the shift in the United States from hoarding labor to shedding jobs more rapidly than output declined in the Great Recession shows that we know less than we thought about how labor markets operate over the business cycle. Will the next recession, in which a much larger proportion of the workforce will hold irregular jobs, produce greater job losses than in 2007–2009? Could greater reliance on labor institutions determining wage and employment outcomes dampen job losses, and, if so, what would those institutions be? To answer these and related questions requires new economic analyses of labor demand that focus on the factors behind the variability of employment responses and that seek ways to influence those responses along the entire distribution of responses so that our economies can adjust better to the next recession in the business cycle, which seems to be endemic to market economies.
Acknowledgments
Any opinions and conclusions expressed in this article are those of the authors and do not necessarily represent the views of the U.S. Census Bureau. All results have been reviewed to ensure that no confidential information is disclosed. This work has received support from the Russell Sage Foundation and the Norwegian Research Council (grant no. 227072).
APPENDIX A
Census Bureau’s Longitudinal Business Database (LBD)
The establishment-level data are from the U.S. Census Bureau’s Longitudinal Business Database (LBD) covering the period from 1977 to 2009. The data include all private employers for all sectors except agriculture. The data are sourced from the Census Bureau’s Business Register, which is continually updated using administrative records, Economic Census returns, and surveys such as the Company Organization Survey. The LBD collects establishment payroll and employment data, which we have used to calculate the average establishment wage per employee for establishments with positive employment and payroll.
Survey respondents are asked to use the definition of salaries and wages used for calculating the federal withholding tax. They report the gross earnings paid in the calendar year to employees at the establishment prior to such deductions as employees’ Social Security contributions, withholding taxes, group insurance premiums, union dues, and savings bonds. Included in gross earnings are all forms of compensation such as salaries, wages, commissions, dismissal pay, paid bonuses, vacation and sick leave pay, and the cash equivalent of compensation paid in kind. Salaries of officers of the establishment, if a corporation, are included. In an unincorporated concern, payments to proprietors or partners are excluded. Salaries and wages do not include supplementary labor costs such as employers’ Social Security contributions and other legally required expenditures or payments for voluntary programs. The definition of payrolls is identical to that recommended to all federal statistical agencies by the Office of Management and Budget. We added data on education matching the U.S. 2000 Census long-form data (IPUMS) at the six-digit industry and county level to each establishment by industry, at the most detailed North American Industry Classification System code as available in the IPUMS, and county level, with PUMAs (Public Use Microdata areas) mapped to counties.
The LBD follows establishments over time, where considerable effort was invested by the census to recover longitudinal identifiers through linking records and matching names and addresses (Jarmin and Miranda 2002). We use these identifiers to define establishment births, deaths, and continuers. A birth is an establishment that is observed in the data that did not exist five years earlier. Similarly, a death is an observation that does not survive the five years until the next economic census year. Establishments are either single-unit establishments, where the (generally smaller) firm produces in one location, or multi-unit establishments that are part of a company that operates at multiple locations. The 10 percent, median, and 90 percent deciles are calculated by taking a neighborhood of establishments 1 percent on either side of the decile and using the mean of this sample as a pseudo-decile.
APPENDIX B
Job Destruction and Creation Dominated by Changes Among Continuers
The job destruction graph(figure B1) shows the thousands of jobs that were “destroyed” by plant closing or death of an establishment and by reduction of employment among continuing establishments, and their total. For every year, the job destruction by continuers exceeds job destruction by continuing establishments’ reducing employment.
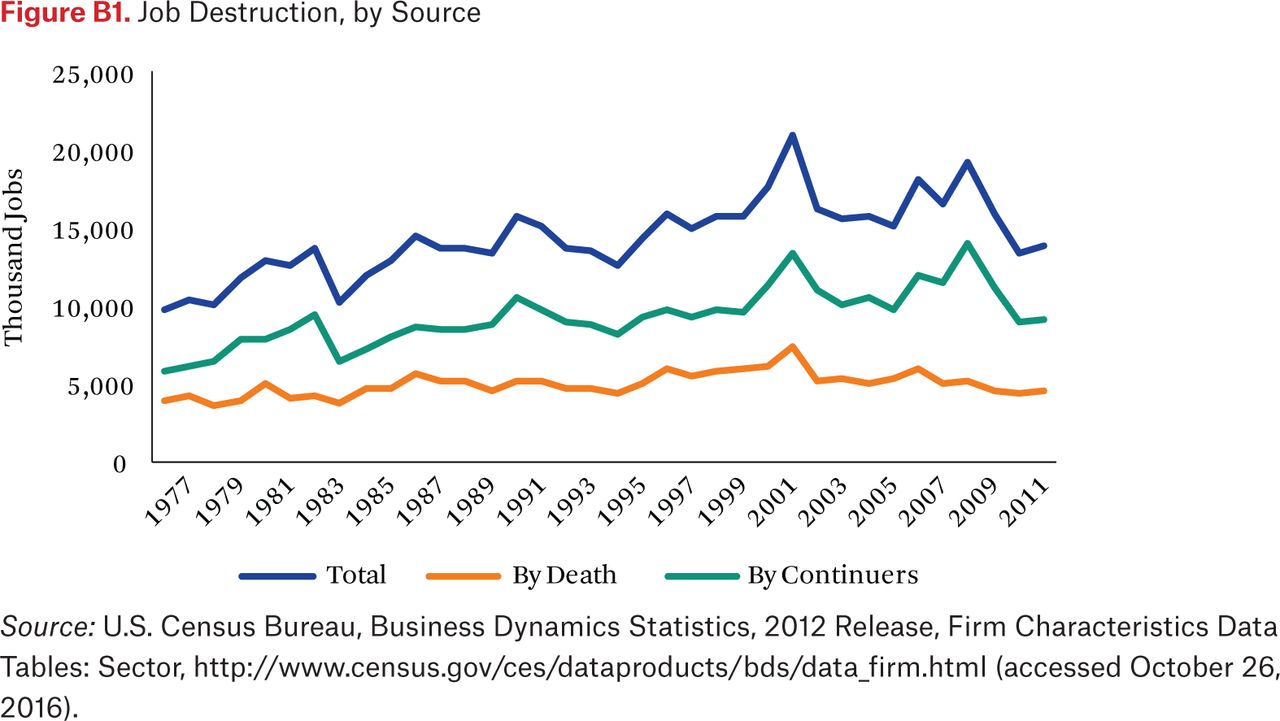
Job Destruction, by Source
The job creation graph (figure B2) shows the thousands of jobs that were created by new establishments entering the market (through birth) and by expansion of employment among continuing establishments, and their total. For every year the job creation by continuers exceeds job creation by continuing establishments that expand employment.
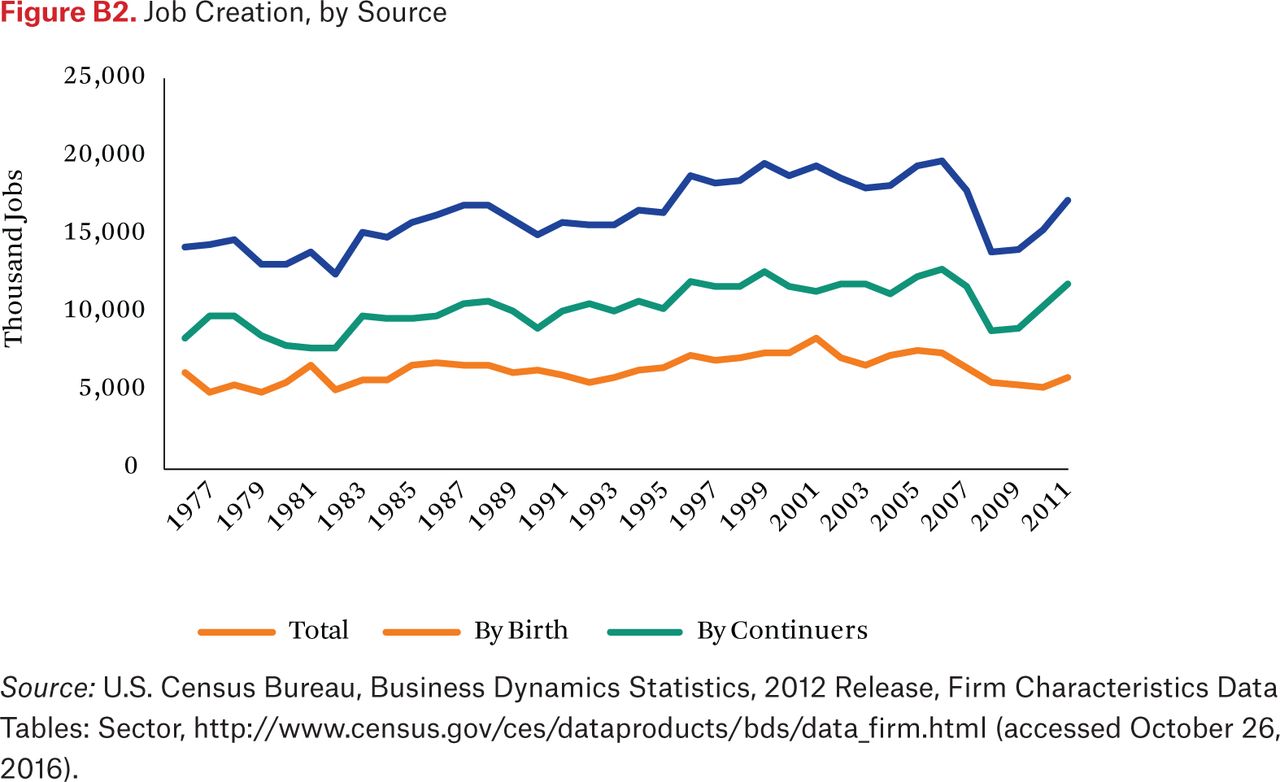
Job Creation, by Source
FOOTNOTES
↵1. Based on seasonally adjusted May data from Bureau of Labor Statistics Data, “Series ID: LNS12300000: Employment-Population Ratio, 16 Years and Over,” http://data.bls.gov/timeseries/LNS12300000 (accessed August 4, 2016).
↵2. Census Bureau Center for Economic Studies restricted-use data available in the Federal Statisticial Research Data Centers, including the Longitudinal Business Data Base, Quinquennial Economic Censuses, Annual Capital Expenditure Survey, Standard Statistical Establishment List, Annual Survey of Manufacturers, and Annual Survey of Services, www.census.gov/ces (accessed October 20, 2016).
↵3. Output as measured by gross revenues, which is sales.
↵4. For the impact of pro-cyclic labor productivity in Robert R. Solow’s thinking, see Michaël Assous (2013) and Jeff Biddle (2014).
↵5. Biddle (2014) stresses the important contributions of Charles C. Holt et al. (1960). See Basu and Fernald (2001) for an empirical assessment.
↵6. Federal Reserve Bank of St. Louis FRED Economic Data “FRED - Manufacturing Sector: Real Output Per Hour of All Persons (series OPHMFG),” https://fred.stlouisfed.org/series/OPHMFG (accessed July 20, 2016); Bureau of Labor Statistics, “Major Sector Productivity and Costs Original Data Value, Series ID: PRS30006032, Sector: Manufacturing,” http://data.bls.gov/timeseries/PRS30006032 (accessed July 20, 2016).
↵7. The Conference Board, International Labor Comparisons, International Comparisons of Manufacturing Productivity & Unit Labor Costs Trends, 2014, time series tables downloadable from https://www.conference-board.org/ilcprogram/index.cfm?id=30136 (accessed June 20, 2016).
↵8. Bureau of Economic Analysis BEA, U.S. Department of Commerce, Gross-Domestic-Product-(GDP)-by Industry Data, Spreadsheet, www.bea.gov/industry/gdpbyind_data.htm (accessed May 27, 2015). Bureau of Economics Commerce Department GDP by Industry spreadsheet GDP by Ind_VA_NAICS_1997-2014 shows that manufacturing gross output fell by 17 percent from 2007 to 2009 and increased by 12 percent for a 29 point swing while manufacturing value added fell by 10 percent and then increased by 6 percent for a sixteen-point swing. The price index for gross output increased by 1 percent from 2007 to 2009 and by 16 percent while the price index for value added increased by 4 percent in the recession and 8 percent in the recovery. Martin Bailey and Barry Bosworth (2014, table 2) show different growth of gross output and value added in the computer and electronic products manufacturing industry due in part to differences in value added and gross output price deflators. Susan Houseman et al. (2011) analyze the problems that price indexes create in measuring economic activity in manufacturing.
↵10. Aggregate data on employment, job creation, and job destruction are from the Center for Economic Studies (CES), www.census.gov/ces/dataproducts/bds/data_firm.html (accessed June 25, 2015). We use the “Firm Characteristics Data Tables: Economy Wide” table for total counts and the “Firm Characteristics Data Tables: Sector” table for counts by one-digit SIC sectors. The BDS reports yearly employment based on March data, along with the total number of jobs created and destroyed each year based on the last twelve months. Job destruction and creation are jobs lost via establishment deaths or gained via establishment births. The “Establishment Age by Sector” table splits the data by establishment age. The BDS does not define birth in a unique way: an establishment is born when it begins with age zero, but if employment goes to zero and later back to a positive number the establishment is “born again,” even if its age is greater than zero. BDS suppresses job counts in cells that fall under a certain firm count.
↵11. Using the 2007-to-2009 recession data, continuers made up 79 percent of establishments in 2007 (= 5.121 million continuers / [5.121 + 1.398 establishments in 2007 but gone by 2009]) and 80 percent of establishments in 2009 (= 5.121 / [5.121 + 1.291 establishments in 2009 but not in 2007]). Using the 2009-to-2012 recovery data, continuers made up 73 percent of establishments in 2009 (= 5.148 / [5.148 + 1.916]) and 73 percent in 2012 (= 5.148 / ([5.148 + 1.922]).
↵12. Let Ne = number of entering establishments, Ae = average employment in those establishments, Nd = number of exiting establishments, and Ad = average employment in those establishments. Then job change from exit and entry is NeAe – Nd Ad, which decomposes algebraically into (Ne – Nd) Ad + (Ae – Ad) Nd + (Ne – Nd) (Ae – Ad), where the first term is the different number of entering and exiting establishments, weighted by average employment in exiting establishments; the second term is the difference in average employment in entering and exiting establishments, weighted by the number of exiting establishments; and the last term is the interaction of the two differences. The difference in average sizes times the exiting number of firms accounts for 97 percent of the contribution of exit and entry to growth of jobs.
↵13. The characteristics are for 2007 to avoid reverse causality from the recession and recovery on the characteristics.
↵14. Establishments are included in the calculations if they exist in the beginning and end of each period. Focusing on continuing establishments sidesteps the discontinuity in changes related to exit and entry and potential differences between exit and entry decisions and expansion and contraction decisions.
↵15. This problem can also be addressed by weighting observations by the number of employees.
↵16. Steve Davis, John Haltiwanger, and Scott Schuh (1996) and Haltiwanger (2012), among others, also note the heterogeneity in changes in employment among enterprises.
↵17. The R&D status for the firm that owned an establishment is from National Science Foundation, Business R&D and Innovation Survey. Another factor in the regressions was the export status of the establishment measured in the share of output sold overseas, which we treat as a covariate control.
↵18. To see if the Great Recession downturn and recovery differed from downturns and recoveries in earlier recessions, we estimated variants of the table 5 equations for the entire 2007-to-2012 period and for the downturn and recovery in the three previous recessions. We found only modest differences in the relation between the physical and human capital of establishments and the R&D attribute of the owning firm on output and employment.
↵19. The measure of hoarding can be improved in various ways, such as comparing changes in employment with changes in materials, which the firm is unlikely to hoard, or differentiating production from nonproduction workers, or distinguishing establishments with increases in sales in the recession and decreases in sales in the recovery, but the table 6 analysis suffices to establish the establishment basis of hoarding.
↵20. As in other tables, the output and employment dependent variables were scaled with 2007 as 1.00 so the constants give the growth rates for establishments with the average characteristics.
↵21. To check the interrelation between employment adjustments in the recession and recovery, we examined the pattern of change in employment relative to materials as well as to revenues. This compares the two inputs that firms can potentially adjust in the short run to changes in demand for output. Over the entire period the ratio of materials to output increased by 9.3 percent—a change that implies materials augmenting technical change—while the cyclic pattern resembles the table 7 pattern of output to employees with slower growth in the recession and faster growth in the recovery relative to the five year smooth alternative—the signature of input hoarding.
↵22. See Sandrine Cazes, Sameer Khatiwada, and Miguel Malo (2012). Figure 2 shows the difference between U.S. and European countries in collective bargaining and employment protection legislation
↵23. Larry Katz and Alan Krueger (2016) show that most of the increase in alternative work arrangements measured by independent contractors, on-call workers, temporary help agency workers, and those provided by contract firms occurred after 2005. See also Katherine Abraham et al. (2016) and David Weil (2014).
↵24. See “At-Will Employent,” https://en.wikipedia.org/wiki/At-will_employment (accessed October 20, 2016).
↵25. Construction employment declined proportionately with construction spending in the recession. See FRED (Federal Reserve Economic Data) data series, “Total Construction Spending,” https://fred.stlouisfed.org/search?st=TTLCONS (accessed August 4, 2016); and “All Employees: Construction,” https://fred.stlouisfed.org/series/USCONS (accessed August 4, 2016).
- © 2017 Russell Sage Foundation. Barth, Erling, James Davis, Richard Freeman, and Sari Pekkala Kerr. 2017. “Weathering the Great Recession: Variation in Employment Responses, by Establishments and Countries.” RSF: The Russell Sage Foundation Journal of the Social Sciences 3(3): 50–69. DOI: 10.7758/RSF.2017.3.3.03. Any opinions and conclusions expressed in this article are those of the authors and do not necessarily represent the views of the U.S. Census Bureau. All results have been reviewed to ensure that no confidential information is disclosed. This work has received support from the Russell Sage Foundation and the Norwegian Research Council (grant no. 227072). Direct correspondence to: Erling Barth at erling.barth{at}socialresearch.no, ISF, Munthesgate 31, 0208 Oslo, Norway; James Davis at james.c.davis{at}census.gov, Boston Census Research Data Center, NBER, 1050 Massachusetts Ave, Cambridge, MA 02138; Richard Freeman at freeman{at}nber.org, NBER, 1050 Massachusetts Ave, Cambridge, MA 02138; and Sari Pekkala Kerr at skerr3{at}wellesley.edu, WCW, Wellesley College, 106 Central Street, Wellesley, MA 02481.
Open Access Policy: RSF: The Russell Sage Foundation Journal of the Social Sciences is an open access journal. This article is published under a Creative Commons Attribution-NonCommercial-NoDerivs 3.0 Unported License.
In this issue


Jump to section
Related Articles
Cited By...
- No citing articles found.