
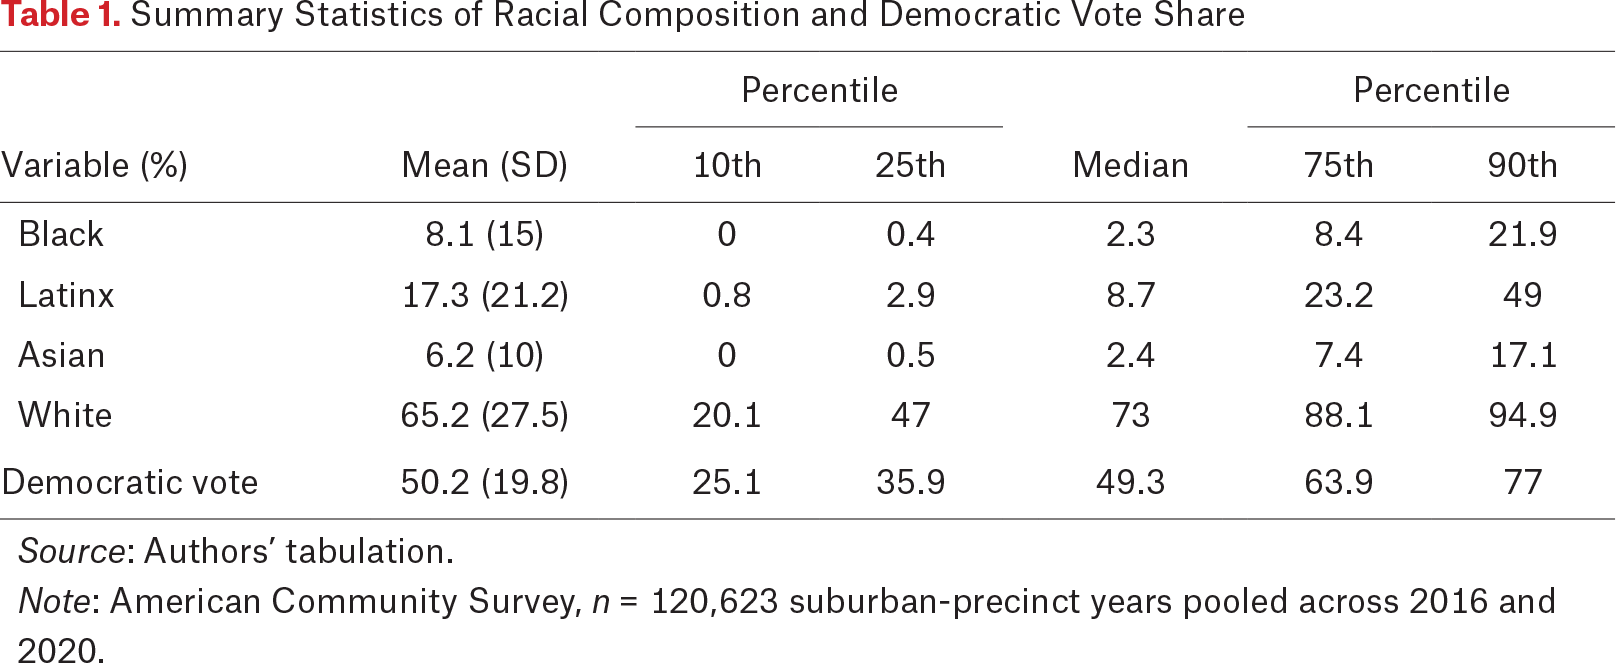
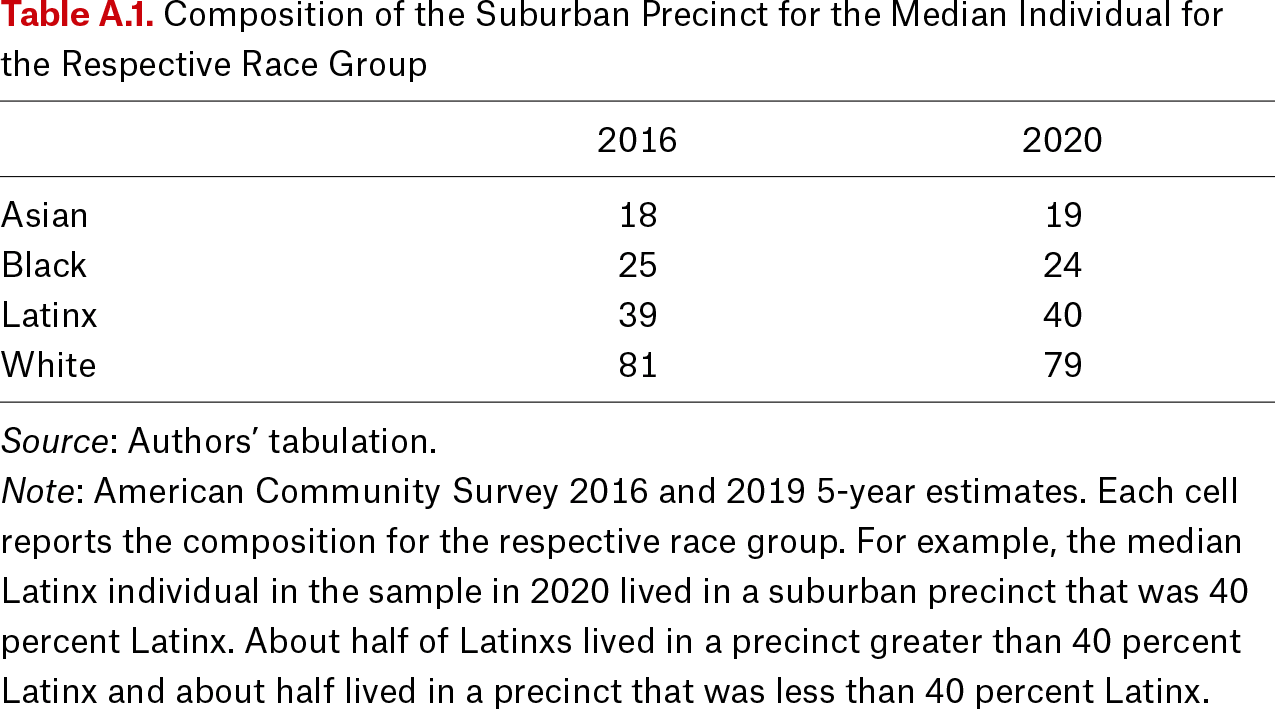
Article Figures & Data
Figures
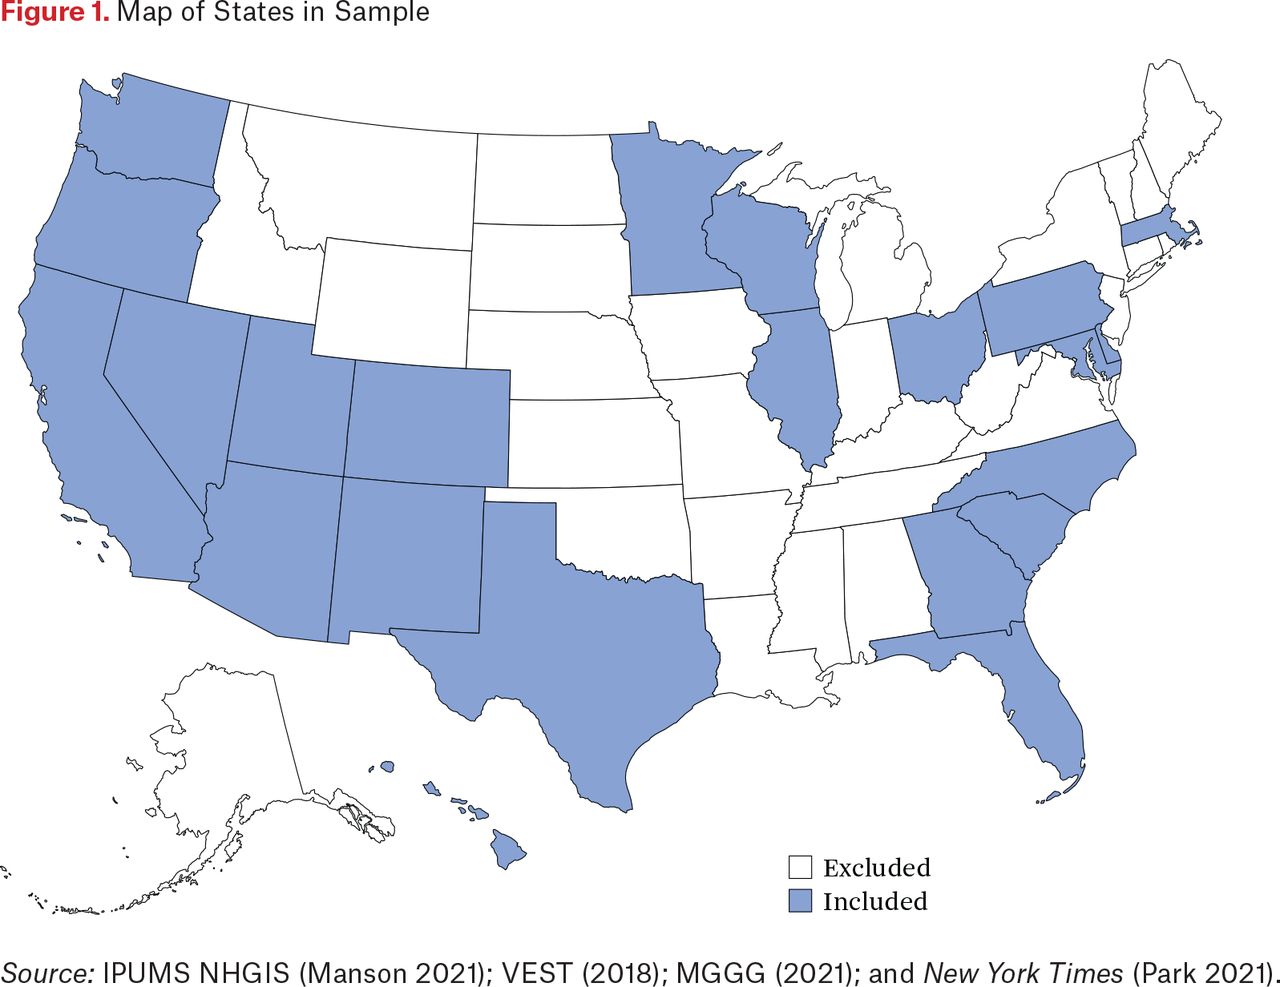
- Figure 1.
Map of States in Sample
Source: IPUMS NHGIS (Manson 2021); VEST (2018); MGGG (2021); and New York Times (Park 2021).
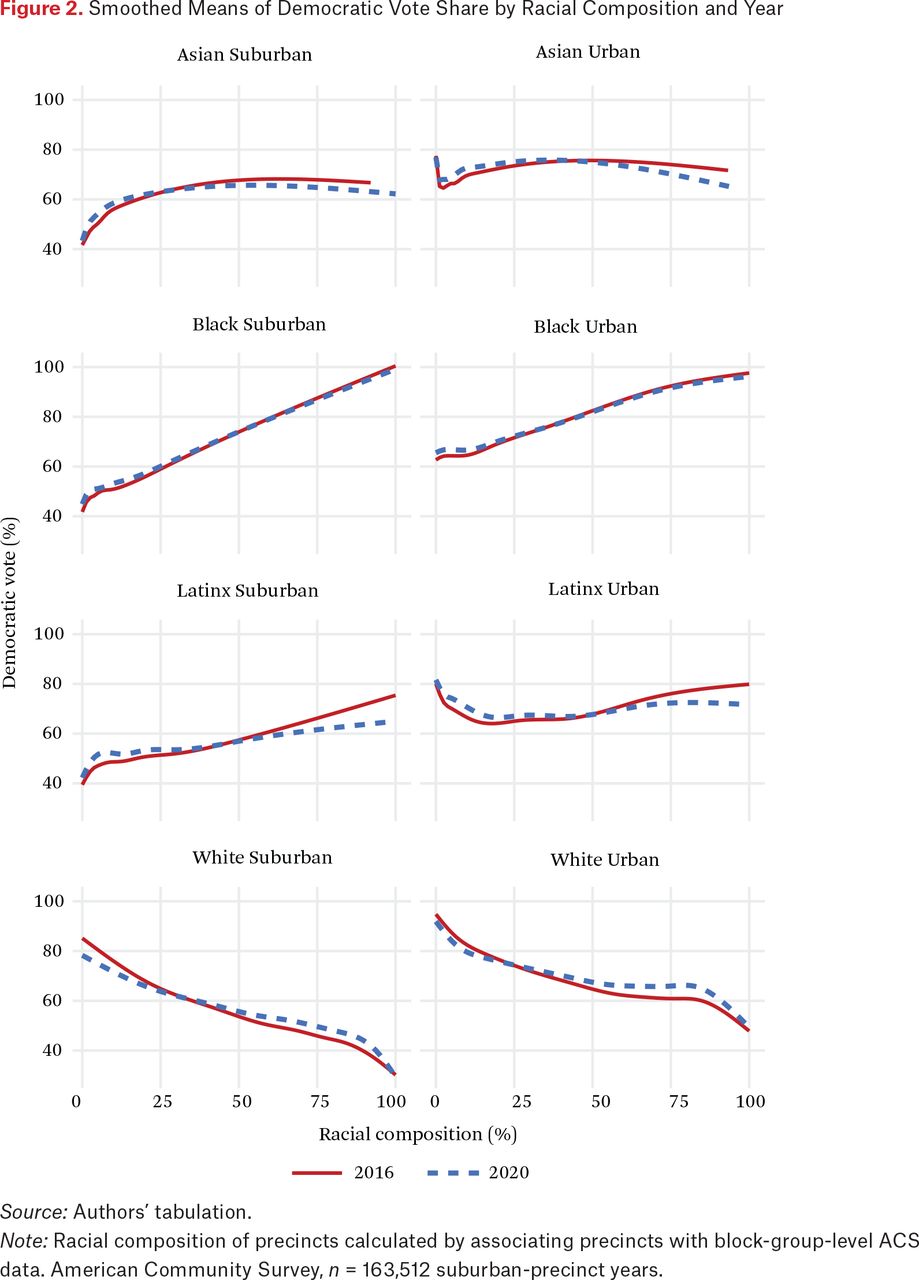
- Figure 2.
Smoothed Means of Democratic Vote Share by Racial Composition and Year
Source: Authors’ tabulation.
Note: Racial composition of precincts calculated by associating precincts with block-group-level ACS data. American Community Survey, n = 163,512 suburban-precinct years.
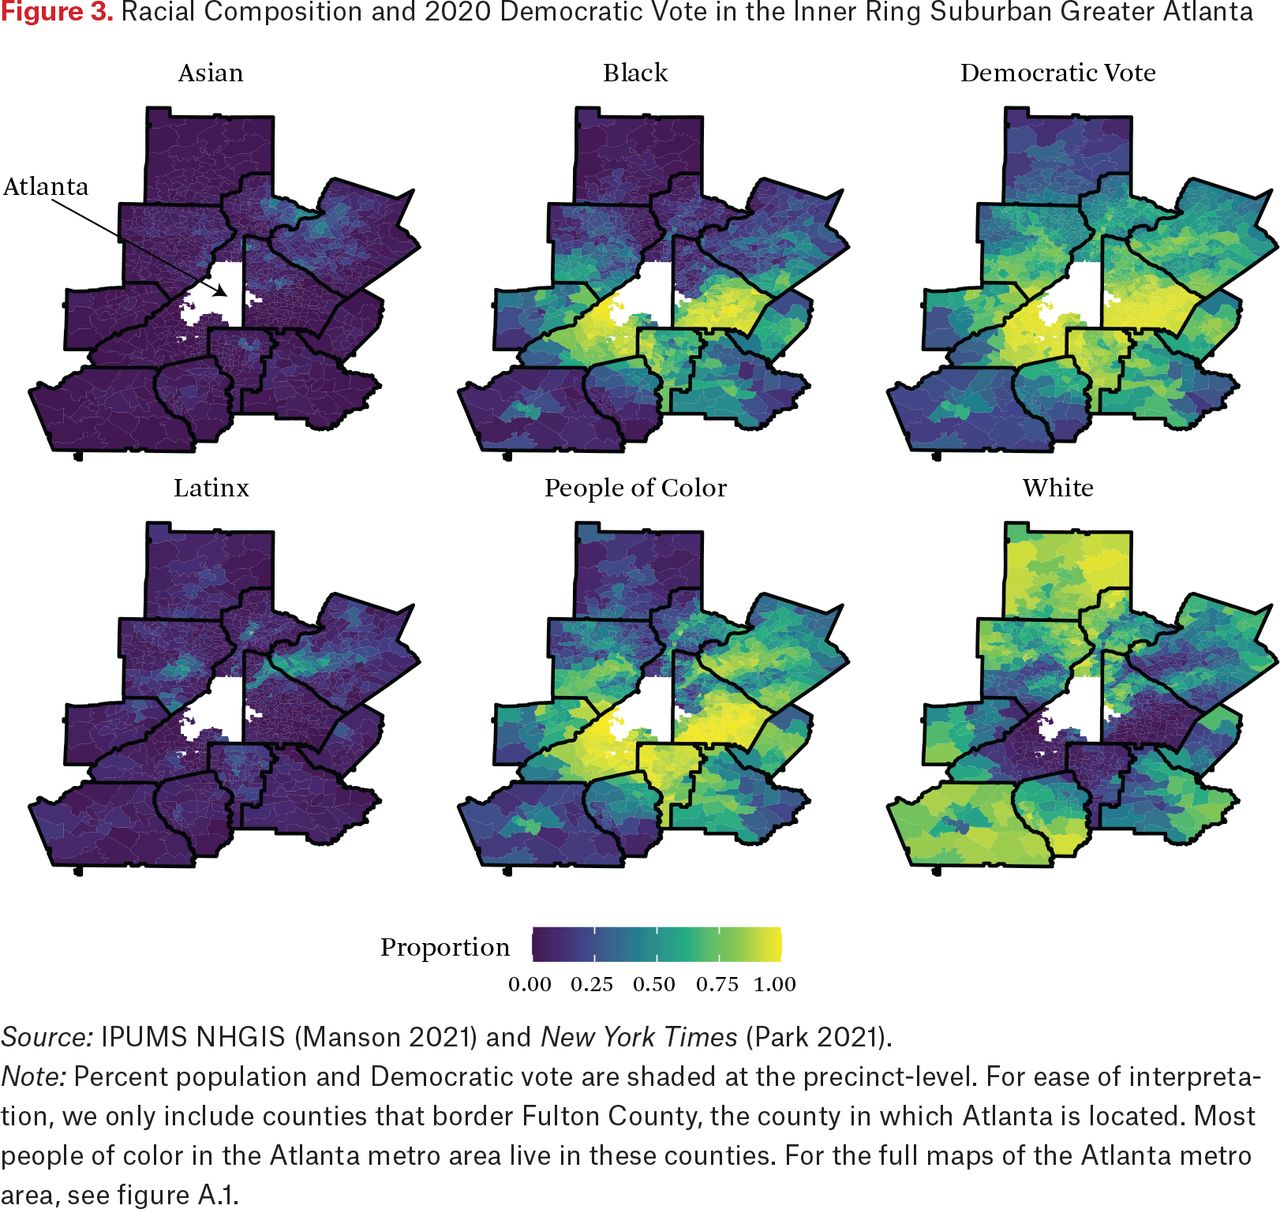
- Figure 3.
Racial Composition and 2020 Democratic Vote in the Inner Ring Suburban Greater Atlanta
Source: IPUMS NHGIS (Manson 2021) and New York Times (Park 2021).
Note: Percent population and Democratic vote are shaded at the precinct-level. For ease of interpretation, we only include counties that border Fulton County, the county in which Atlanta is located. Most people of color in the Atlanta metro area live in these counties. For the full maps of the Atlanta metro area, see figure A.1.
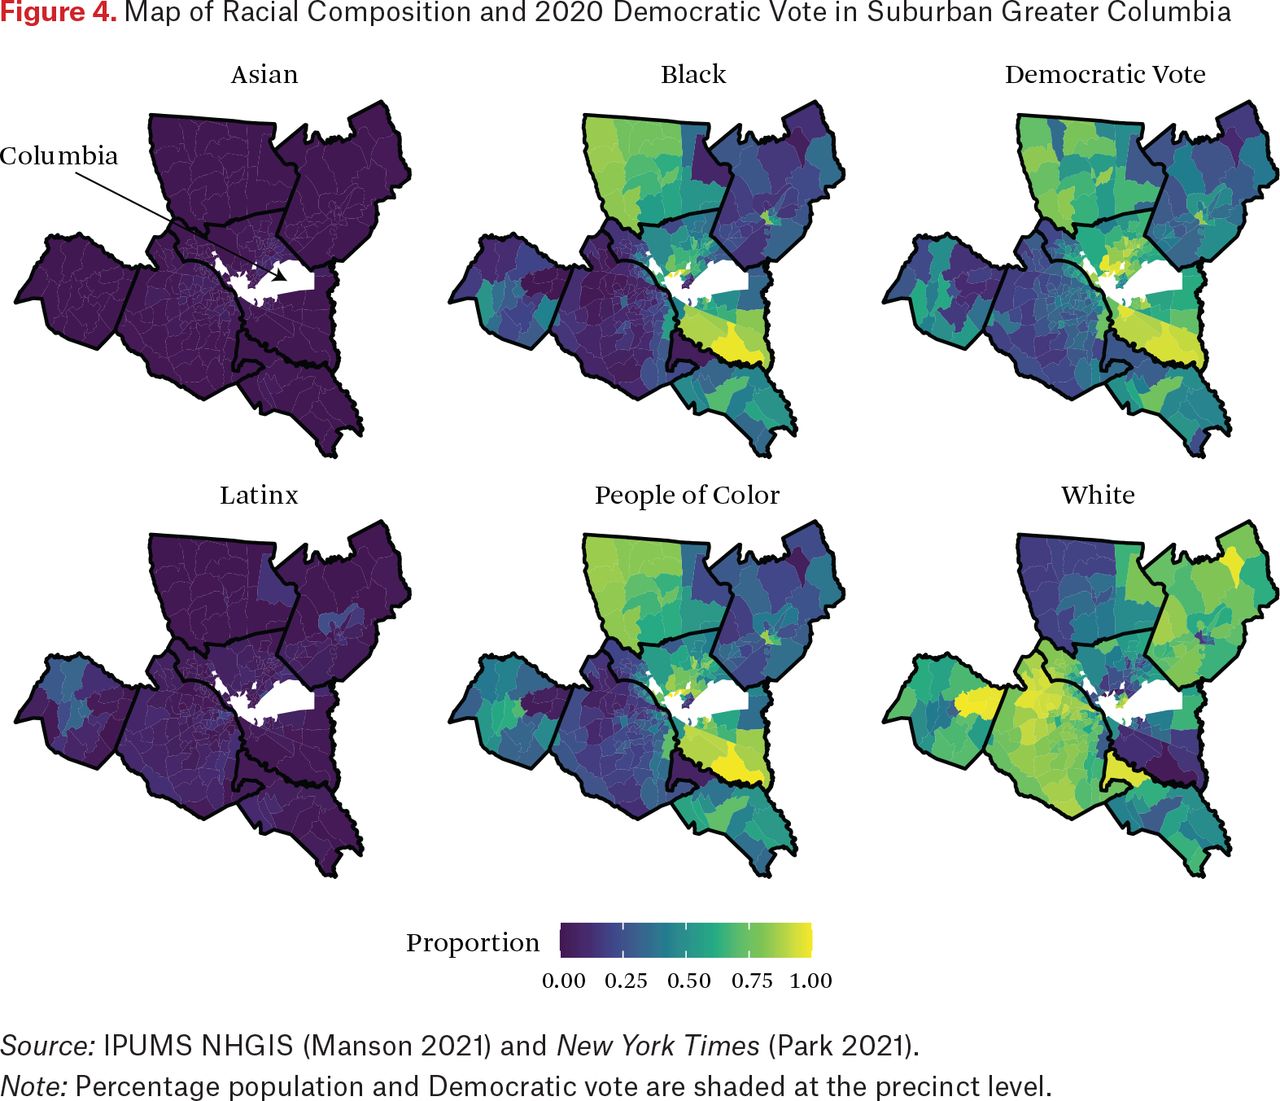
- Figure 4.
Map of Racial Composition and 2020 Democratic Vote in Suburban Greater Columbia
Source: IPUMS NHGIS (Manson 2021) and New York Times (Park 2021).
Note: Percentage population and Democratic vote are shaded at the precinct level.
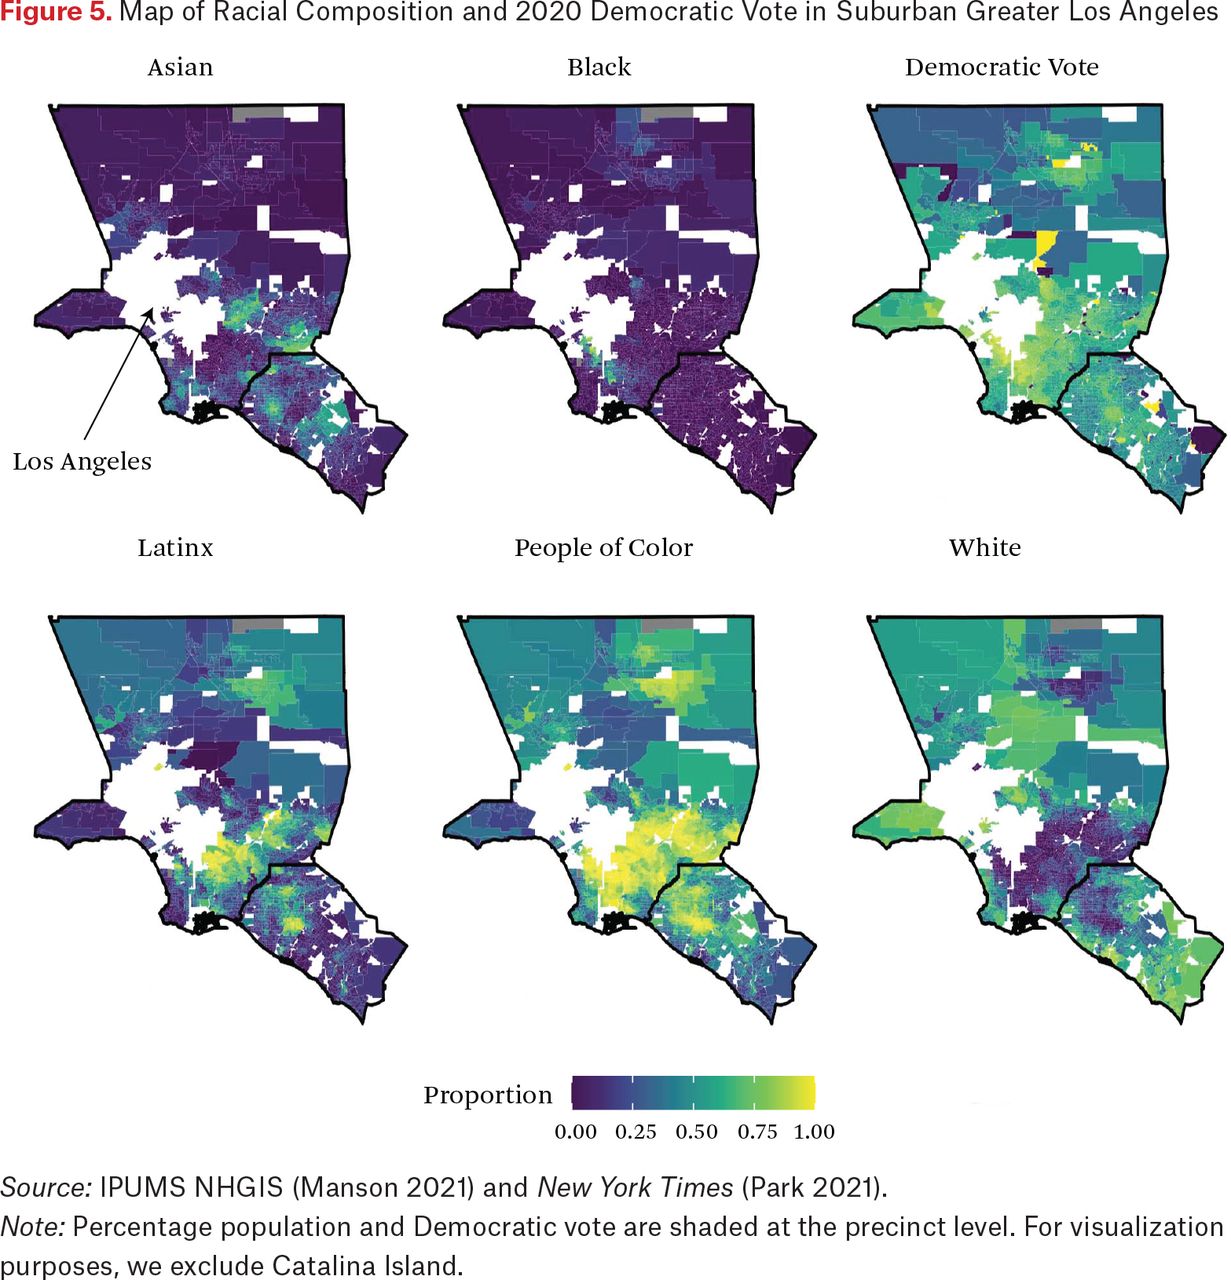
- Figure 5.
Map of Racial Composition and 2020 Democratic Vote in Suburban Greater Los Angeles
Source: IPUMS NHGIS (Manson 2021) and New York Times (Park 2021).
Note: Percentage population and Democratic vote are shaded at the precinct level. For visualization purposes, we exclude Catalina Island.
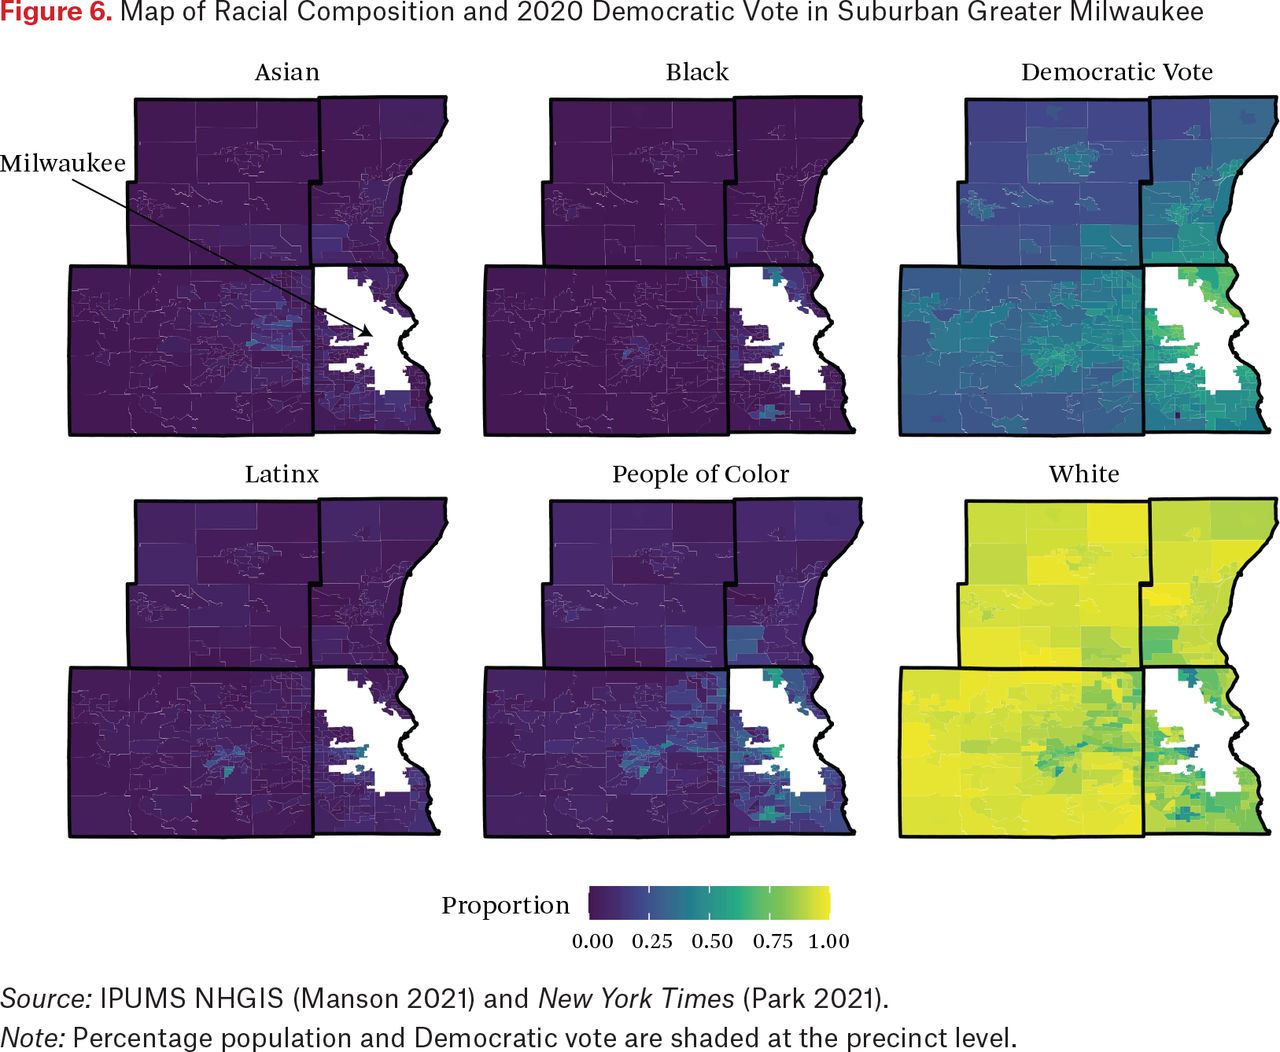
- Figure 6.
Map of Racial Composition and 2020 Democratic Vote in Suburban Greater Milwaukee
Source: IPUMS NHGIS (Manson 2021) and New York Times (Park 2021).
Note: Percentage population and Democratic vote are shaded at the precinct level.
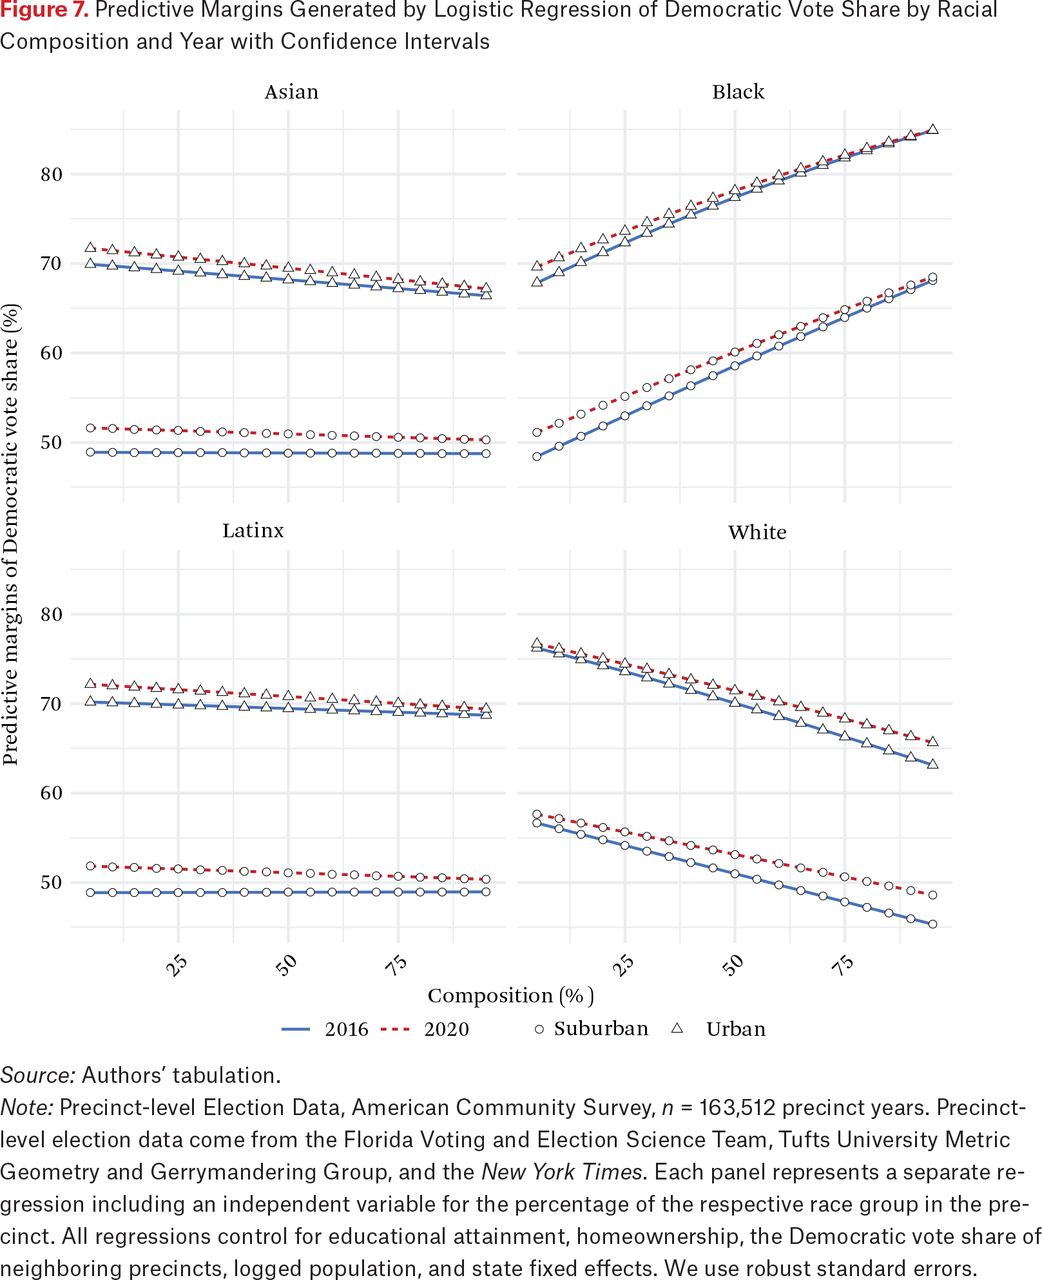
- Figure 7.
Predictive Margins Generated by Logistic Regression of Democratic Vote Share by Racial Composition and Year with Confidence Intervals
Source: Authors’ tabulation.
Note: Precinct-level Election Data, American Community Survey, n = 163,512 precinct years. Precinct-level election data come from the Florida Voting and Election Science Team, Tufts University Metric Geometry and Gerrymandering Group, and the New York Times. Each panel represents a separate regression including an independent variable for the percentage of the respective race group in the precinct. All regressions control for educational attainment, homeownership, the Democratic vote share of neighboring precincts, logged population, and state fixed effects. We use robust standard errors.
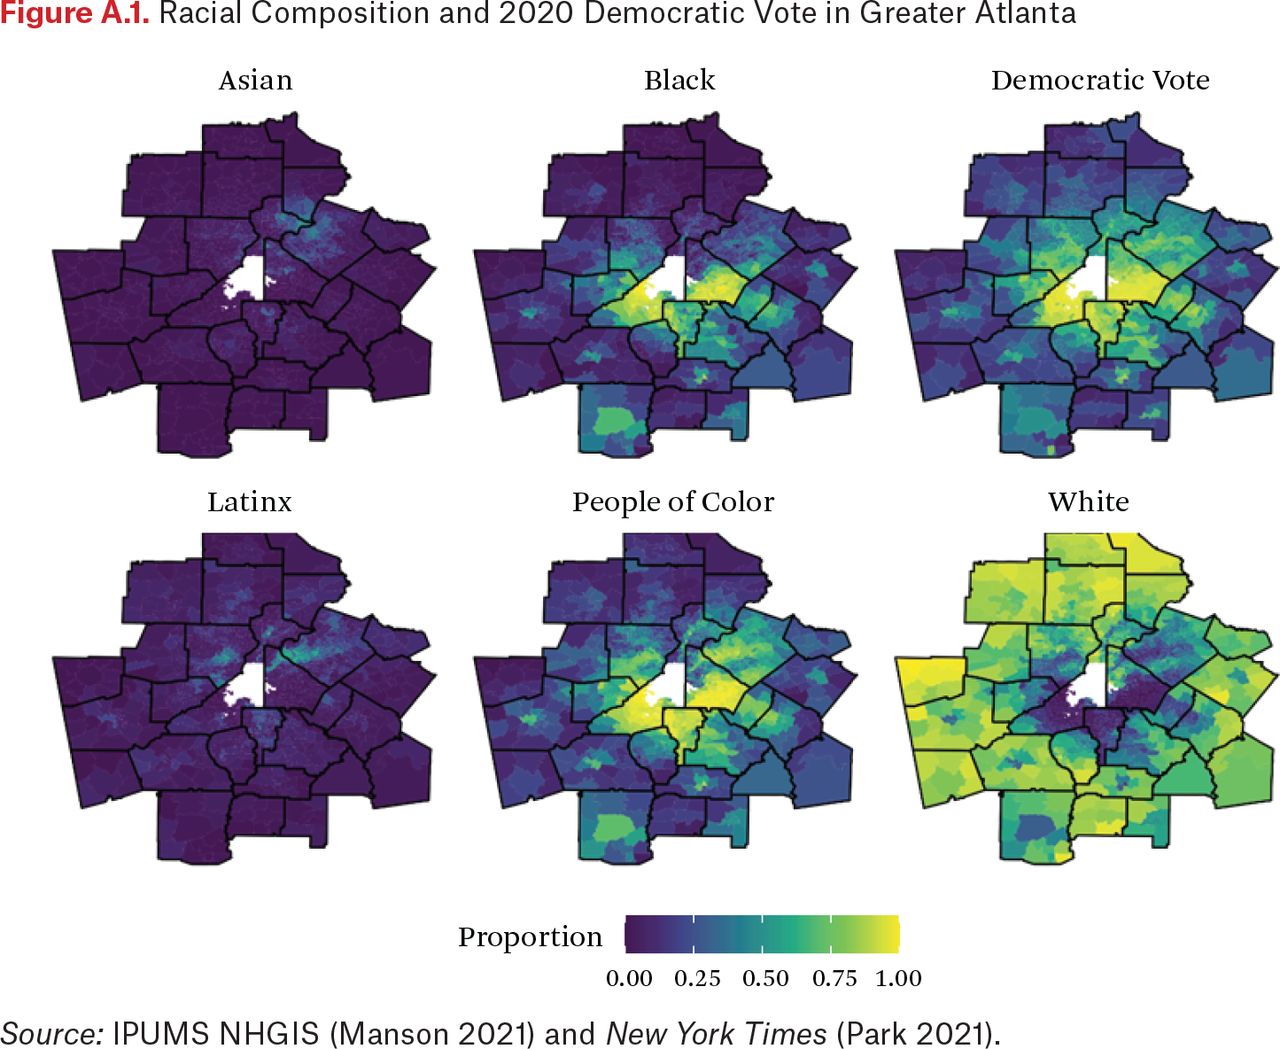
- Figure A.1.
Racial Composition and 2020 Democratic Vote in Greater Atlanta
Source: IPUMS NHGIS (Manson 2021) and New York Times (Park 2021).
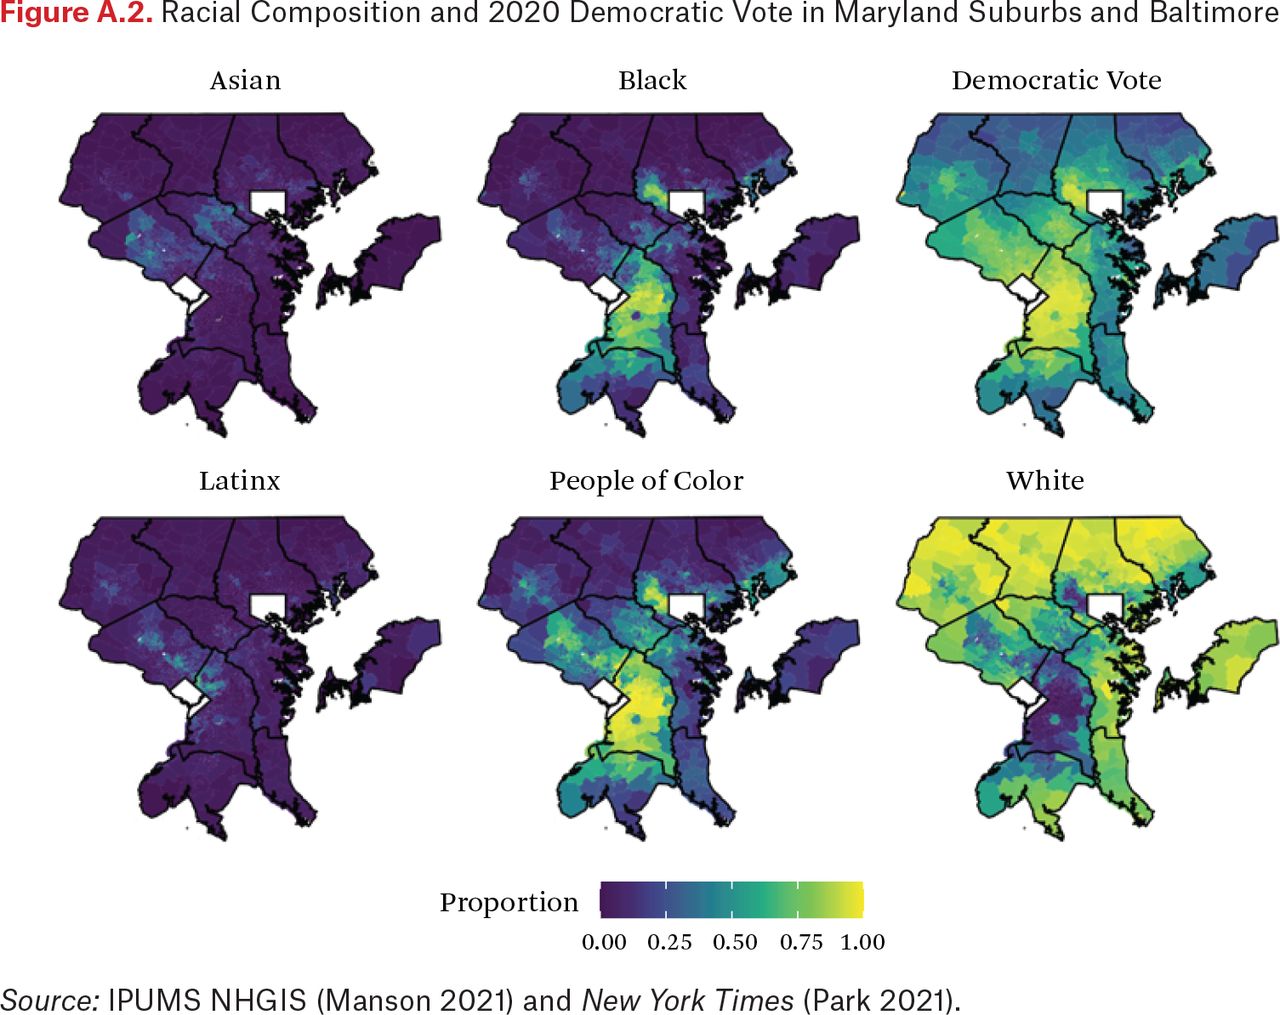
- Figure A.2.
Racial Composition and 2020 Democratic Vote in Maryland Suburbs and Baltimore
Source: IPUMS NHGIS (Manson 2021) and New York Times (Park 2021).
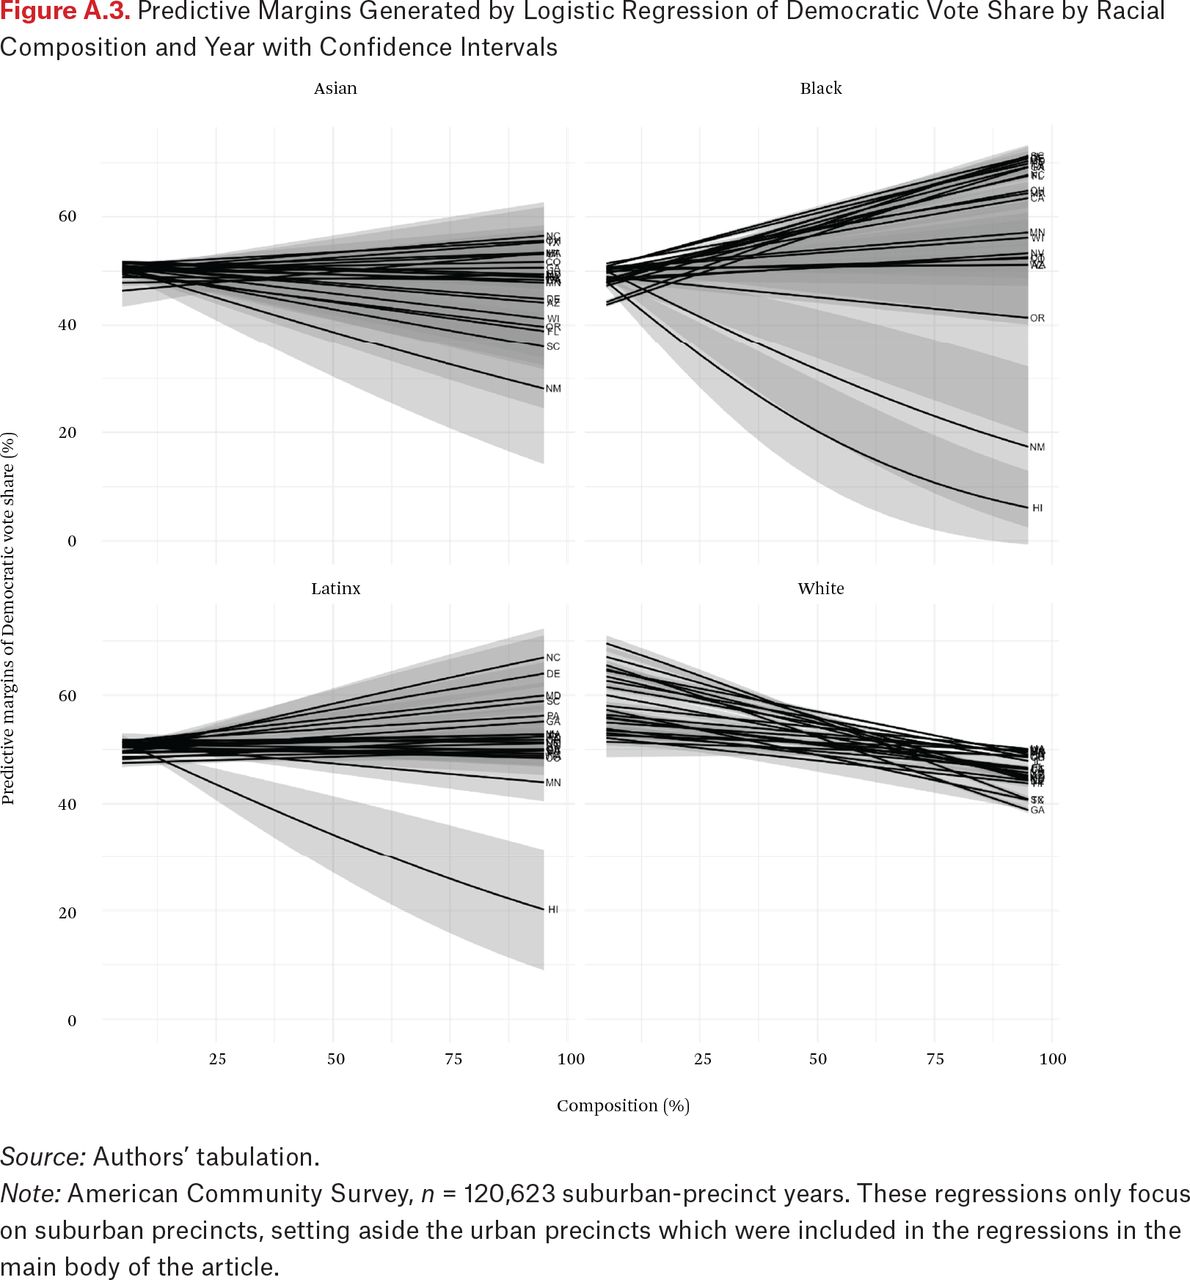
- Figure A.3.
Predictive Margins Generated by Logistic Regression of Democratic Vote Share by Racial Composition and Year with Confidence Intervals
Source: Authors’ tabulation.
Note: American Community Survey, n = 120,623 suburban-precinct years. These regressions only focus on suburban precincts, setting aside the urban precincts which were included in the regressions in the main body of the article.


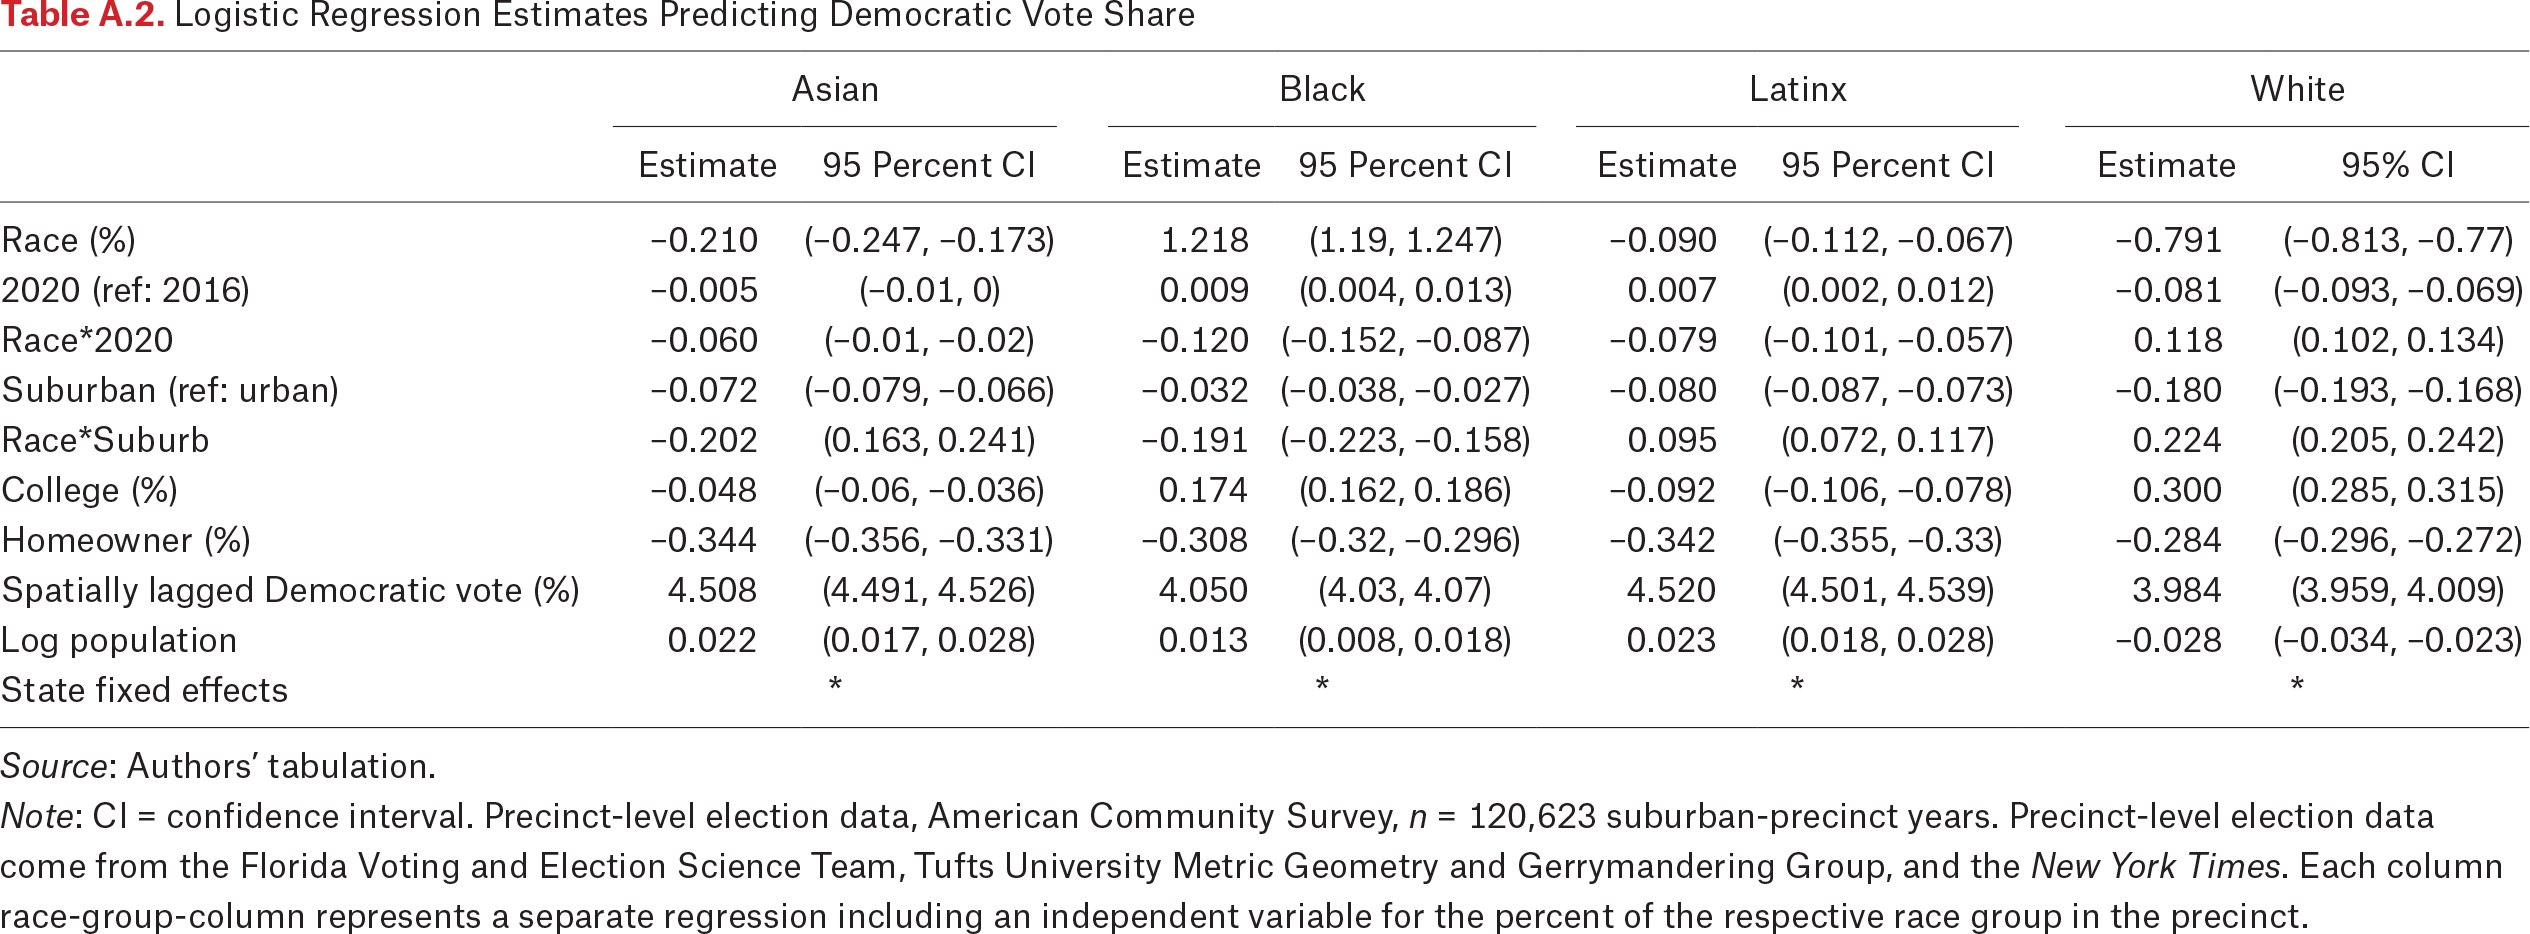
Tables
In this issue


Jump to section
Related Articles
Cited By...
- No citing articles found.