
Abstract
This article compares the wealth situation of children across fourteen countries. Children experience lower levels of wealth than the rest of the population, seniors in particular. We show that, in most countries, child wealth is distributed substantially more unequally than the wealth of seniors. We also demonstrate that an international ranking of child wealth inequality diverges sharply from one based on child income inequality. The wealth situation of children in the United States is exceptional: they lag further behind seniors in terms of their wealth and face the highest levels of wealth inequality and, by far, wealth concentration.
Inequality in household wealth in the United States and other industrialized countries is large and growing (Wolff 1996, 2017; Pfeffer, Danziger, and Schoeni 2013; Piketty 2014), raising concerns about the impact of wealth inequality on the development and opportunities of today’s children (Gibson-Davis and Hill 2021, this issue; Pfeffer and Schoeni 2016). This concern is heightened by the fact that the level of wealth inequality experienced by children is even higher than that experienced by other population groups and also rising faster (Pfeffer and Schoeni 2016; Gibson-Davis and Percheski 2018). In this article, we provide the first cross-national assessment of wealth inequality among children in fourteen countries characterized by distinct policy, institutional, and economic contexts. We demonstrate that in most of these countries, as one would expect, children experience lower levels of household wealth than the rest of the population, in particular seniors. Children also tend to experience greater wealth inequality and concentration. In many countries, their disadvantage is quite large, and nowhere more so than in the United States. Further, research that has established the shape and determinants of income inequality among children cannot provide much guidance for the assessment of the shape and determinants of wealth inequality among children because national levels of child income inequality and child wealth inequality are uncorrelated. That is, countries often differ significantly in the level of inequality among children when measured as income versus wealth; however, the United States combines uniquely high levels of child inequality in both wealth and income. Overall, this contribution emphasizes that U.S. levels of child wealth inequality are not merely high but, in an international comparison, extreme, and that wealth forms a partly separate dimension of the economic well-being of children across countries.
We begin by providing a conceptual background for the analysis of wealth across countries and population groups of different ages.
BACKGROUND AND APPROACH
Recent comparative work has found substantial international variation in wealth inequality (Davies 2008; Piketty 2014; Pfeffer and Waitkus, forthcoming). Although multiple studies do not find countries’ demographic structure to be clearly related with national levels of wealth inequality (see, for example, Sierminska and Doorley 2018; Cowell, Karagiannaki, and McKnight 2018), research has established important differences in wealth and wealth inequality between population groups within countries. For the United States, Fabian Pfeffer and Robert Schoeni (2016) show that wealth inequality is higher among households with children than those without and has been growing more rapidly for the former since the late 1980s. Christina Gibson-Davis and Christine Percheski (2018) compare U.S. trends in the wealth levels of two groups of households with dependents, child households and elderly households, and demonstrate that the wealth gap between and within these two groups has grown over the decades: child households at the bottom of the distribution saw a particularly pronounced decline, falling further behind the relatively stable wealth levels of elderly households and also becoming increasingly worse off compared to the wealthiest child households. We extend this perspective by comparing children across fourteen countries to determine whether and to what extent they are exposed to higher levels of wealth inequality than the remainder of the population in other Western countries.
Our assessment is entirely descriptive but implies an urgent call for more explanatory approaches that seek to understand why countries differ in the extent of wealth inequality as experienced by children. Such undertaking needs to tackle at least two questions. First, why is the wealth exposure of children different from that of the remainder of the population? Second, does the consideration of wealth ask for a new understanding of national contexts of child well-being? Before beginning our analyses, we provide initial guidance for such explanatory tasks.
Wealth Differences Across Age Groups
Differences in the wealth distribution between age groups can be driven by various factors: these groups are at different stages of the process of asset accumulation (in the case of children, the asset accumulation of their caregivers), generational differences in asset accumulation are possible, and circumstances of the historical period in which we assess wealth may explain group differences. In short, the differences described here may be driven by a combination of age, cohort, and period effects. Again, our contribution provides a purely descriptive account of these differences and does not attempt to disentangle the contribution of age, period, or cohort effects (Fosse and Winship 2019). Nevertheless, we offer basic hypotheses on how each of these forces may contribute to the observed differences in the distribution of wealth between the young and the old.
The clearest predictions about differences in the level of wealth arise from a focus on age effects: as the term wealth accumulation itself suggests, household wealth is built over time, leading us to expect younger groups to be less wealthy than older groups (Modigliani 1988). Besides the cumulation of savings over time, spending needs also differ between the young and old. Having children limits families’ ability to accumulate assets (Maroto 2018), in particular in the U.S. context of rising economic investments in children (Kornrich and Furstenberg 2012; Schneider, Hastings, and LaBriola 2018). During later adulthood—on average, when individuals are in their fifties (Leopold and Skopek 2015)—the receipt of an inheritance may jolt wealth accumulation for some households. Finally, desaving among seniors as they draw down assets during retirement is less pronounced than economic theory would have it and often limited to the very latest years of life and related to the cost of care (Ameriks et al. 2015). Predictions about age differences in wealth inequality, in contrast, depend on whether individual wealth trajectories follow a process of cumulative advantage (DiPrete and Eirich 2006). Historically high returns on capital (Piketty 2014) and, in particular, long-acknowledged processes of compound interest on capital (Marx 1981) make it likely that wealth advantage indeed cumulates and increases over time, moving the wealthy further apart from the nonwealthy. Under these assumptions, we would expect wealth inequality and wealth concentration to be greater among the old than the young.
Next, based on a cohort perspective, the wealth accumulation of today’s seniors can be hypothesized to have occurred during historically advantageous conditions as they accumulated assets in years of economic growth (offering, for instance, stable occupational careers) and an expansion of public investments and protections (such as unionized employment, public higher education), providing unmatched opportunities for stable trajectories of asset accumulation (see, for example, Morgan and Scott 2007). In contrast, the asset accumulation of more recent cohorts is occurring during considerably more challenging macro-economic and social conditions, marked by widespread loss of economic stability and public insurance schemes, ranging from the rapid decline of unionized labor (Western and Rosenfeld 2011; Brady, Baker, and Finnigan 2013) to the restructuring of pension themes (Hacker 2007; Devlin-Foltz, Henriques, and Sabelhause 2016; Ebbinghaus 2011). The proliferation of economic loss (Jackson and Grusky 2018) suggests that today’s younger cohorts will not only have less wealth than prior cohorts, but also that wealth may be increasingly concentrated among those who no longer rely on the labor market or public insurance schemes for their economic survival.
Last, considering potential period effects that may underlie our findings, our assessment of wealth follows a period of intense fluctuations in the wealth structure, at least in the United States. The Great Recession not only destroyed massive amounts of wealth but also rapidly increased wealth inequality in some countries, especially in the United States (Pfeffer, Danziger, and Schoeni 2013; Wolff 2017) though much less so in other countries, such as Germany (Grabka 2015). In the United States, the Great Recession tended to decrease the wealth holdings of those already disadvantaged, which includes younger households (Pfeffer, Danziger, and Schoeni 2013). That is, the immediate post-recession period that we assess here may, in some countries, be marked by a particularly large wealth gap between the young and the old. Extrapolating from the general inequality-increasing influence of the Great Recession, one may expect that the recession also contributed to increased wealth inequality within these groups.
As stated, we cannot empirically disentangle the relative contributions of the age, cohort, and period effects hypothesized; we merely observe their combined influence on the distribution of wealth between and among today’s young and old. In combination, the hypotheses do support a clear expectation that the wealth levels of the young are lower than those of the old because age, cohort, and period effects point in the same direction. They do not support a clear expectation about the differences in wealth inequality and concentration between these groups as the hypothesized age effects point toward lower levels of inequality among the young, whereas the hypothesized cohort and period effects point toward higher inequality among the young.
National Contexts of Wealth Inequality
A robust comparative literature relies on income to measure national levels of economic inequality. Measures of wealth, however, yield quite a different picture of cross-national differences in inequality given that cross-national differences in wealth inequality are largely independent from national levels of income inequality (Pfeffer and Waitkus, forthcoming). Countries usually perceived as income-egalitarian, such as Sweden or Norway, are marked by comparably high levels of wealth inequality. In contrast, some countries with high levels of income inequality, such as the United Kingdom or Australia, report comparatively moderate levels of wealth inequality. Only the United States combines vast wealth and income inequality.
National levels of income inequality have long been shown to be shaped by labor-market institutions and welfare states (Esping-Andersen 1990; Hall and Soskice 2001). A perspective that makes sense of the distinct cross-national differences in wealth inequality, however, may need to center on the exposed role of housing markets and related institutions, since national levels of wealth inequality are strongly related to inequalities in housing (Pfeffer and Waitkus, forthcoming). Beyond the distribution of homeownership, this perspective may consider the interrelation of national housing markets and financial markets as the regulation of mortgage lending has been found to be an important driver of housing inequality (Aalbers 2016; Ansell 2019; Fuller, Johnston, and Regan 2019), including housing discrimination and segregation. For instance, the consequences of a loosely regulated mortgage market—especially for economically disadvantaged families, minority households, and single mothers and thereby for broader patterns of wealth inequality—became particularly obvious in the Great Recession and its aftermath in the United States (Rugh and Massey 2010; Baker 2014). At the same time, access to financial markets and, in particular, long-term debt obligations such as mortgages may also be facilitated by more stable labor trajectories and protections, such as in northern European countries (Johnston, Fuller, and Regan 2020), suggesting that increased access to homeownership should not be simply thought of as a trade-off to a well-developed welfare state (Ansell 2014; van Gunten and Kohl 2020). Furthermore, in northern European countries, the proliferation of credit has been driven by the intensification of credit among those holding it, more so than the expansion of credit to more households (van Gunten and Navot 2018). We may therefore expect countries as different as the United States and Sweden to show comparably high levels of wealth inequality, if for different reasons. In contrast, some southern and eastern European countries where mortgage markets are restricted and outright ownership levels are high—sometimes described as familial residential capitalist regimes (see Schwartz and Seabrooke 2009)—can be expected to have lower levels of wealth inequality. Finally, deregulated financial markets may not only induce further wealth stratification through the spread of credit and mortgages but also sustain the increased access of a financial elite that continues to concentrate national wealth (Lin and Tomaskovic-Devey 2013).
A full explanation of cross-national differences in wealth inequality and, with it, children’s wealth inequality is beyond the scope of this article, but the article does suffice to illustrate that these explanations will likely lie outside those offered by the comparative literature on income inequality. Instead of labor-market institutions, comparative work that seeks to understanding wealth inequality will likely have to put housing and credit markets at the center stage of its explanatory framework (see also Pfeffer and Waitkus, forthcoming).
DATA AND MEASURES
To compare wealth levels, wealth inequality, and wealth concentration across nations, we draw on the Luxembourg Wealth Study (LWS 2020). The LWS provides carefully harmonized measures of household net worth and household composition for fourteen countries: Australia (AU), Austria (AT), Finland (FI), Germany (DE), Greece (GR), Italy (IT), Luxembourg (LU), Norway (NO), Slovakia (SK), Slovenia (SI), Sweden (SW), Spain (ES), the United Kingdom (UK), and the United States (US).1 The LWS harmonization work is ex-post (see Sierminska, Brandolini, and Smeeding 2006) in that it draws on established national data sources that have been collected independently, mostly through nationally representative surveys or, in the case of Norway and Sweden, through tax registries. Several countries include oversamples of rich or high wealth households—Finland, Greece, Luxembourg, Slovakia, Slovenia, Spain, and the United States—which we adjust for by using survey weights (for evidence on the stability of cross-national wealth comparisons toward differences in survey design characteristics, see Pfeffer and Waitkus, forthcoming).
We draw on harmonized, cross-sectional measures of net worth collected between 2011 and 2014, with the exception of Sweden, for which the last available LWS wave is 2005.2 Missing wealth data have been imputed for some countries with each national data provider applying their own imputation algorithms (Austria, Germany, Greece, Luxembourg, Slovakia, Slovenia, Spain, and the United States). Wealth measures are neither top- nor bottom-coded (that is, zero and negative net worth values are included). We calculate median household net worth (in constant 2011 dollars with purchasing power adjustments), the Gini coefficient of household net worth as a broad measure of wealth inequality, and the share of net worth held by the top 5 percent of the wealth distribution as a measure of wealth concentration. Using two inequality indicators, the Gini coefficient and top 5 percent share, allows us to capture both broad patterns of wealth inequality (including negative net worth) as well as the highly skewed nature of the wealth distribution.
Our contribution also provides a simple but substantively meaningful methodological reorientation. Rather than describing the distribution of wealth across different types of households, such as households with and without children, as done in prior research (see Pfeffer and Schoeni 2016; Gibson-Davis and Percheski 2018), we assess the distribution of wealth from an individual-level perspective, estimating household wealth levels and inequality among children (those younger than eighteen), as well as among adults (age eighteen through sixty-four), and among seniors (age sixty-five and older).3 Arguably, the household wealth of children (which we term child wealth) is a more natural basis of assessment than the wealth of households with children: because child wealth captures the wealth level and inequality each child experiences, it is more directly relevant to assessments of the impact of wealth inequality on child development. Methodologically, this approach amounts to simply calculating distributional measures weighted by the number of children within a household. That is, we restructure our data from the household to the individual level so that, for example, a household with two children under eighteen will contribute two observations to the assessment of child wealth, with each of these two children being assigned the same level of household wealth.4 Substantively, the individual-level analysis accounts for differential fertility patterns across the wealth distribution (for a general exposition of the importance of considering demographic differences in the analysis of inequality and mobility, see Song and Mare 2014). We provide direct comparisons between our individual-level approach and the more typical household-level approach in appendix B, where we distinguish child households, defined as households with any children younger than eighteen, from senior households, defined as households without children and a head or spouse or partner age sixty-five or more. The household-level perspective provides somewhat lower estimates of the gap between the young and the old but leaves the international ranking of these gaps largely unaltered. It provides very similar findings on international variation in wealth inequality among children.
Another methodological issue highlighted by the individual-level perspective—though it is also pertinent to household-level analyses—is whether measures of household net worth should be adjusted for household size. Analyses of income typically adjust for (the square root of) household size to account for income sharing within households and for economies of scale. A similar consensus does not exist for analyses of household wealth (see Killewald, Pfeffer, and Schachner 2017), reflecting the conceptual ambiguity of net worth when it comes to its divisibility and potential for economies of scale. For instance, whereas money in savings accounts may more easily be assumed to be divided across household members (using a yet to be defined allocation rule), home equity may be less clearly divisible given that many of its benefits accrue to all household members. In our main analyses, we present wealth estimates without adjustments for household size but provide direct comparisons to wealth measures adjusted for the (square root of) household size in appendix C. Household size adjustments increase the gaps between the young and the old further, but again leave the international ranking of these gaps largely unaltered and do not provide a meaningfully different picture of cross-national differences in the extent of wealth inequality as children experience it.
RESULTS
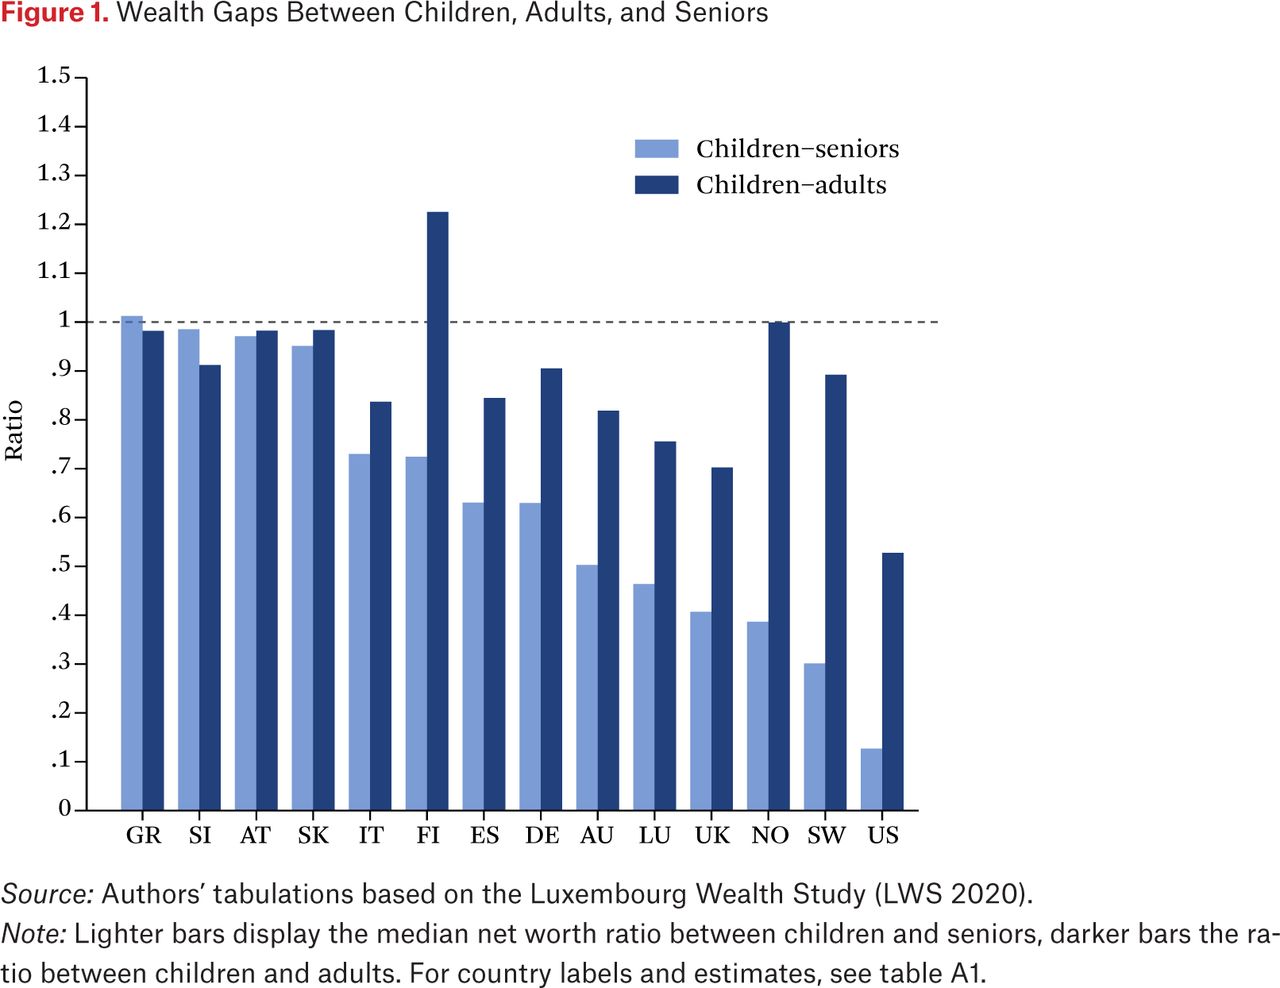
Our expectation that children experience lower wealth levels than the rest of the population is borne out empirically for most of the countries considered. Figure 1 reports the ratio between children’s median wealth and the median wealth of adults (lighter bars) and of seniors (darker bars), respectively (for estimates and country labels, see table A1).

Wealth Gaps Between Children, Adults, and Seniors
Source: Authors’ tabulations based on the Luxembourg Wealth Study (LWS 2020).
Note: Lighter bars display the median net worth ratio between children and seniors, darker bars the ratio between children and adults. For country labels and estimates, see table A1.
We observe, first and unsurprisingly, that the household wealth of the average child is lower than that of the average adult or senior in nearly all countries. Second, wealth gaps between children and seniors tend to be larger than those between children and adults in most countries, which may partly reflect the larger overlap between the latter two groups (given that children are more likely to share a household with adults, that is, their parents, than with seniors). This pattern is particularly stark for Finland, Sweden, and Norway, where the gap between children and adults is small (or, in the case of Finland, even reversed) but substantial between children and seniors. Averaged across all countries (unweighted by sample size), children experience less than two-thirds the wealth of seniors. However, third and most interestingly, cross-national variation is wide in the extent of the wealth gap between children and the remainder of the population. In some southern and central European countries (Greece, Slovenia, Austria, and Slovakia), median child wealth is equivalent to or within 10 percent of the median wealth of adults and seniors, whereas in Scandinavia (Sweden and Norway), the average child has less than 40 percent of the wealth of the average senior. We observe by far the largest wealth disadvantage of children in the United States, where median child wealth is just about half the wealth of adults and merely about one-eighth that of seniors. As table A1 reveals, this exceptional size of the wealth gap between the young and the old is driven by very low levels of wealth among U.S. children, in fact the lowest among all countries observed here. However, a look beyond the United States suggests that large wealth gaps between children and the rest of the population are not necessarily driven by comparatively low levels of child wealth (for instance, the United Kingdom, Finland, and Slovenia show similar levels of child wealth but vastly different gaps between children and adults or seniors).
Stability analyses suggest that these international differences—that is, the ranking of countries according to the size of these gaps—are quite stable toward different specifications, namely, when wealth is measured at the household-level (figure B1) or adjusted for household size (figure C1). In particular, the ordering of countries with large gaps between children and seniors remains unaltered (in ascending order, Australia, Luxembourg, the UK, Norway, Sweden, and the United States, by far the largest). The absolute size of the gap is somewhat less pronounced when comparing child households with senior households (rather than children with seniors) and more pronounced when wealth is adjusted for household size. Both findings partly reflect the fact that households with children tend to be larger than those without them.
Potential explanations for the exceptional wealth position of U.S. children may be the high cost of child-raising resulting from an underinvestment in the public infrastructures that support families, such as parental leave policies or public preschool education. This potential institutional explanation is also supported by a neighboring set of countries in this international ranking: Sweden and Norway sustain the highest investments in early childhood and preschool education and the most generous parental leave and family support policies (Organization for Economic Co-operation and Development 2017, 90; Gornick and Meyers 2003). The gap between children and adult wealth is comparatively small (or nonexistent in the case of Norway)—even though the wealth gap between children and seniors is among the largest.5
Overall, our findings show that the prosperity created over decades of peace and economic growth—and, in some countries included here, significant economic restructuring after the fall of state socialism—has not been fully shared with children in the majority of countries included here. Save in Greece, Slovenia, Austria, and Slovakia, the average child today lags far behind the remainder of the population in terms of wealth. In the next section, however, we also demonstrate that a focus on the “average child” (median wealth) provides only a partial picture of cross-national variation in wealth. As we will see, countries also differ significantly in terms of how much the wealth of the young, adults, and seniors varies, that is, in terms of the level of wealth inequality they face.
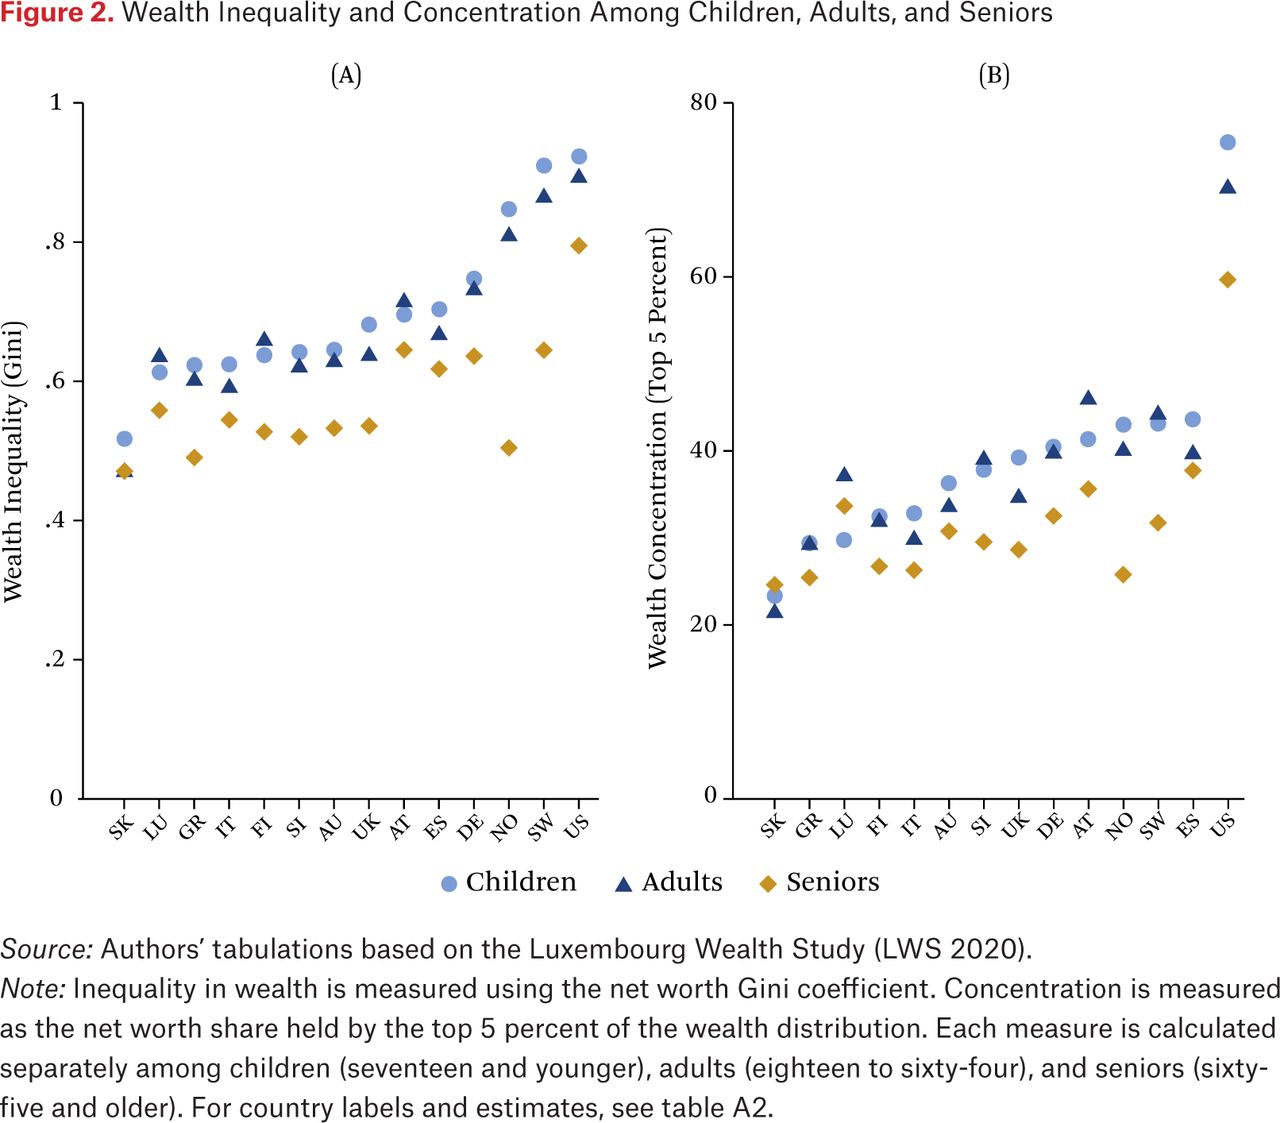
WEALTH INEQUALITY OF CHILDREN
We expected—and in nearly all cases confirmed—that children experience lower levels of household wealth than anyone else. In contrast, theoretical expectations about differences in the levels of wealth inequality and concentration that children face are less clear. Here, we document differences in wealth inequality between children, adults, and seniors. Figure 2, panel A (see also table A2) depicts wealth inequality among children (circles), adults (triangles), and seniors (diamonds) using the Gini coefficient. Despite tremendous cross-national variation in levels of overall wealth inequality (see also Pfeffer and Waitkus, forthcoming), one consistent and strong pattern holds across all countries: children experience substantively higher levels of wealth inequality than seniors. Averaged across all countries (not weighted by country size), the wealth Gini coefficient for children exceeds that of seniors by 0.13 points. Child wealth inequality, however, differs much less (on average, by just 0.02 points) from adult wealth inequality. In Norway, the child wealth Gini coefficient is a full 0.34 points above that of seniors, making Norway the third most unequal country for children (Gini coefficient of 0.85) yet among the most wealth-egalitarian countries for seniors (Gini coefficient of 0.50). Other countries with substantially higher wealth inequality among children than among seniors include Sweden (0.27 point higher Gini coefficient), the UK (+0.14), Greece, and the United States (+0.13 for both). The United States has the highest level of child wealth inequality (0.92), almost twice the level of the most egalitarian country in this set, Slovakia (0.52).

Wealth Inequality and Concentration Among Children, Adults, and Seniors
Source: Authors’ tabulations based on the Luxembourg Wealth Study (LWS 2020).
Note: Inequality in wealth is measured using the net worth Gini coefficient. Concentration is measured as the net worth share held by the top 5 percent of the wealth distribution. Each measure is calculated separately among children (seventeen and younger), adults (eighteen to sixty-four), and seniors (sixty-five and older). For country labels and estimates, see table A2.
Figure 2, panel B (see also table A2) reports a similar cross-national comparison based on a different inequality measure, the concentration of wealth among the wealthiest 5 percent (within each respective age group). First, we observe that the cross-national ranking of child wealth inequality and child wealth concentration is quite similar, suggesting that the two measures capture international differences in the wealth structure of child households similarly well. One notable exception is the United States. Although U.S. children experience the highest level of wealth inequality according to both the Gini coefficient and the top 5 percent share, the latter reveals the truly exceptional U.S. level of wealth stratification among children: the wealthiest 5 percent of children grow up with three quarters of all child wealth. That number is 43.6 percent for the country with the second highest concentration of child wealth, Spain, and just 23.4 percent for the country with the lowest, Slovakia. Besides the extremely high level of wealth concentration among children, the extent to which wealth concentration among children exceeds that among seniors is also very high in the United States (+15.8 percentage points). A similar increase is observed in Scandinavian countries (+11.4 percentage points in Sweden and +17.2 in Norway).
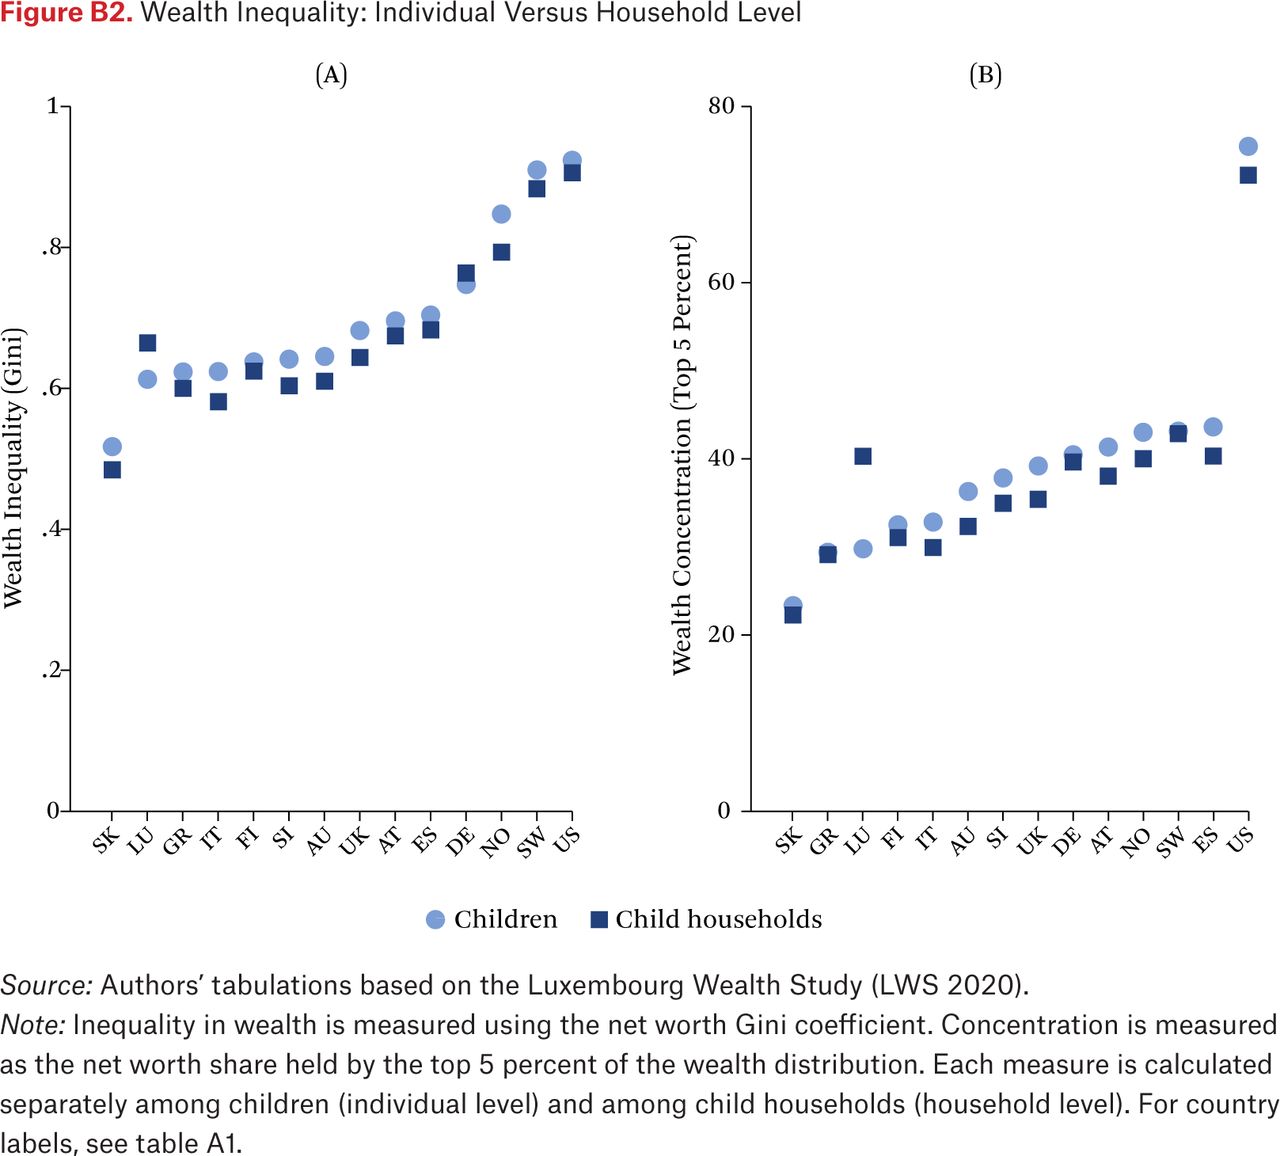
Results based on alternative specifications closely align with those reported here (see figure B2 for household-level estimates and figure C2 for household size adjustments).6 Our main conclusions about cross-national differences in child wealth inequality and concentration thus remain: wealth inequality and concentration are higher among children than among seniors, in many countries substantively so, and by international comparison, children in the United States face a particularly extreme level of wealth concentration.
Children’s Wealth Inequality Versus Children’s Income Inequality
Our results so far demonstrate a comparatively large wealth disadvantage of and high wealth inequality among children in the United States. This comparative position of U.S. children may not come as a surprise to those who have studied the economic well-being of children in the United States, for instance, based on comparisons of child poverty rates (Rainwater and Smeeding 2003; Gornick and Jantti 2010). Yet a conclusion that the patterns established here line up with or directly follow from prior comparative findings based on income would be premature. It is, of course, true that income and wealth are positively correlated at the household level, though perhaps to a lower degree than some assume (Killewald, Pfeffer, and Schachner 2017).7 However, research has also documented that wealth conceptually and empirically constitutes its own dimension of economic well-being and opportunity in the United States (Keister and Moller 2000; Spilerman 2000; Killewald, Pfeffer, and Schachner 2017) as well as in other countries (see Pfeffer 2011; Haellsten and Pfeffer 2017). Furthermore, prior cross-national comparisons of inequality based on wealth show that countries’ ranks differ widely from those based on income (for a full population analysis, which we extend here by focusing on children, see Pfeffer and Waitkus, forthcoming). In this final section, we assess whether our findings on the level of inequality that children in different countries face could also have been attained by drawing on the more widely used indicator of economic well-being, income, or whether, alternatively, our analysis of wealth captures distinct disadvantages of children that would otherwise have been missed.
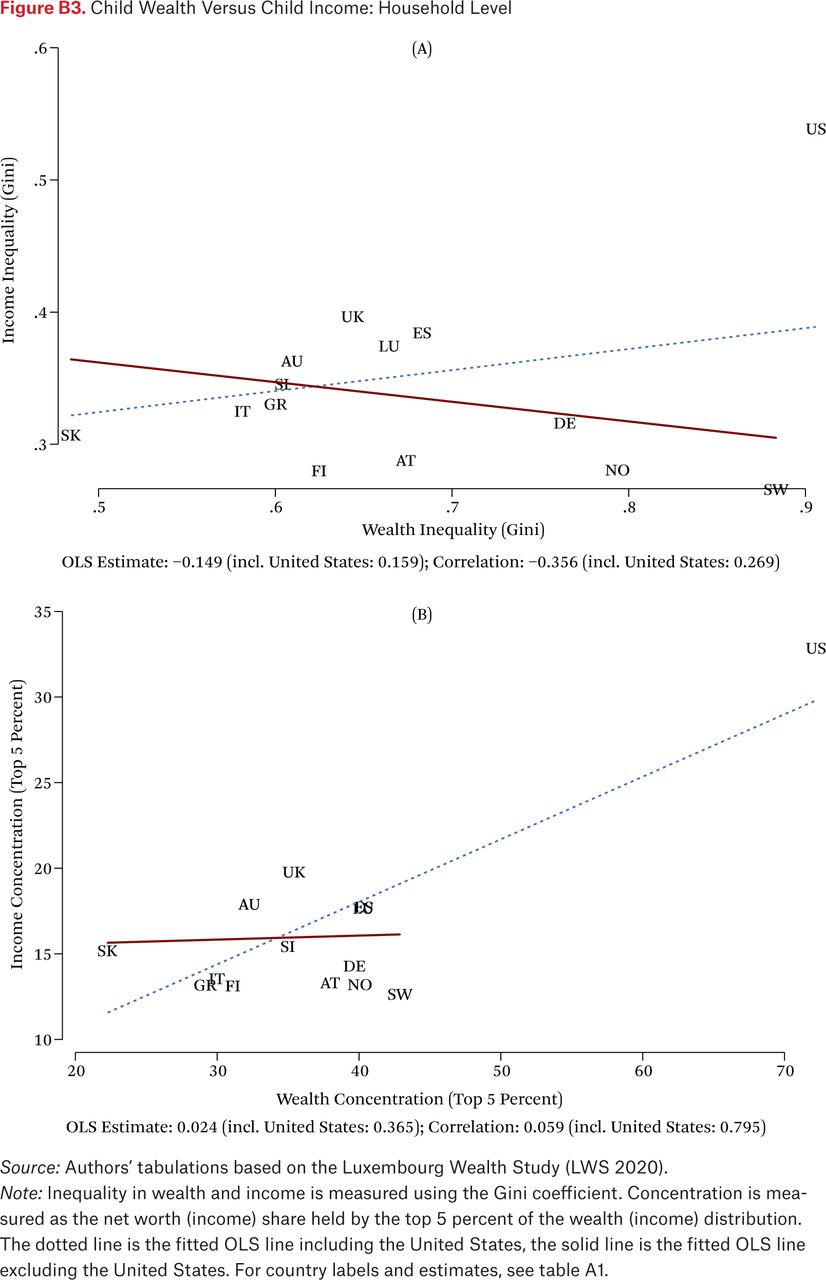
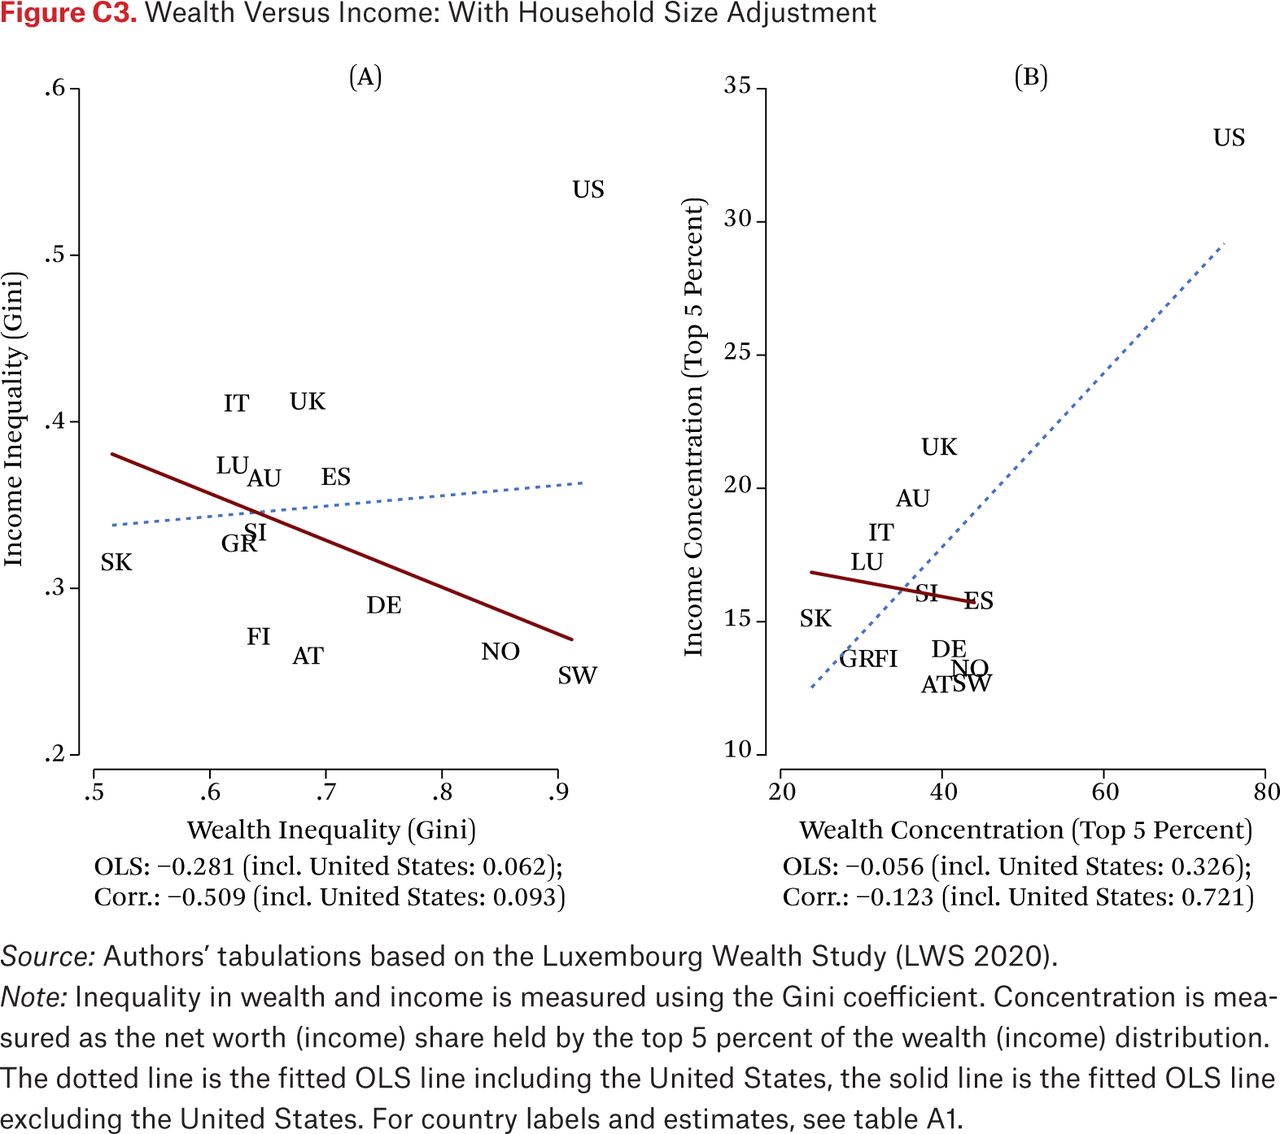
Figure 3 clearly demonstrates that the latter is the case. National levels of inequality in children’s wealth are uncorrelated with national levels of inequality in children’s income. In fact, if one were to read any association into figure 3, panel A, one would have to conclude that—by excluding the United States as the clear outlier in terms of both children’s wealth and income inequality—the association between these two dimensions of child inequality is slightly negative. The conclusion is the same for a measure of children’s income and wealth concentration. Figure 3, panel B again highlights the exceptional level of inequality that U.S. children face. Once more, different specifications leave these conclusions unaltered (see figure B3 for household-level measures and figure C3 for household-size adjusted measures). Overall, the lack of correlation between wealth-based and income-based indicators of child inequality forcefully demonstrates that prior work on the relative well-being of children based on income indicators does not provide suitable guidance for future work that seeks to explain the economic reality today’s children face as it relates to their wealth position.
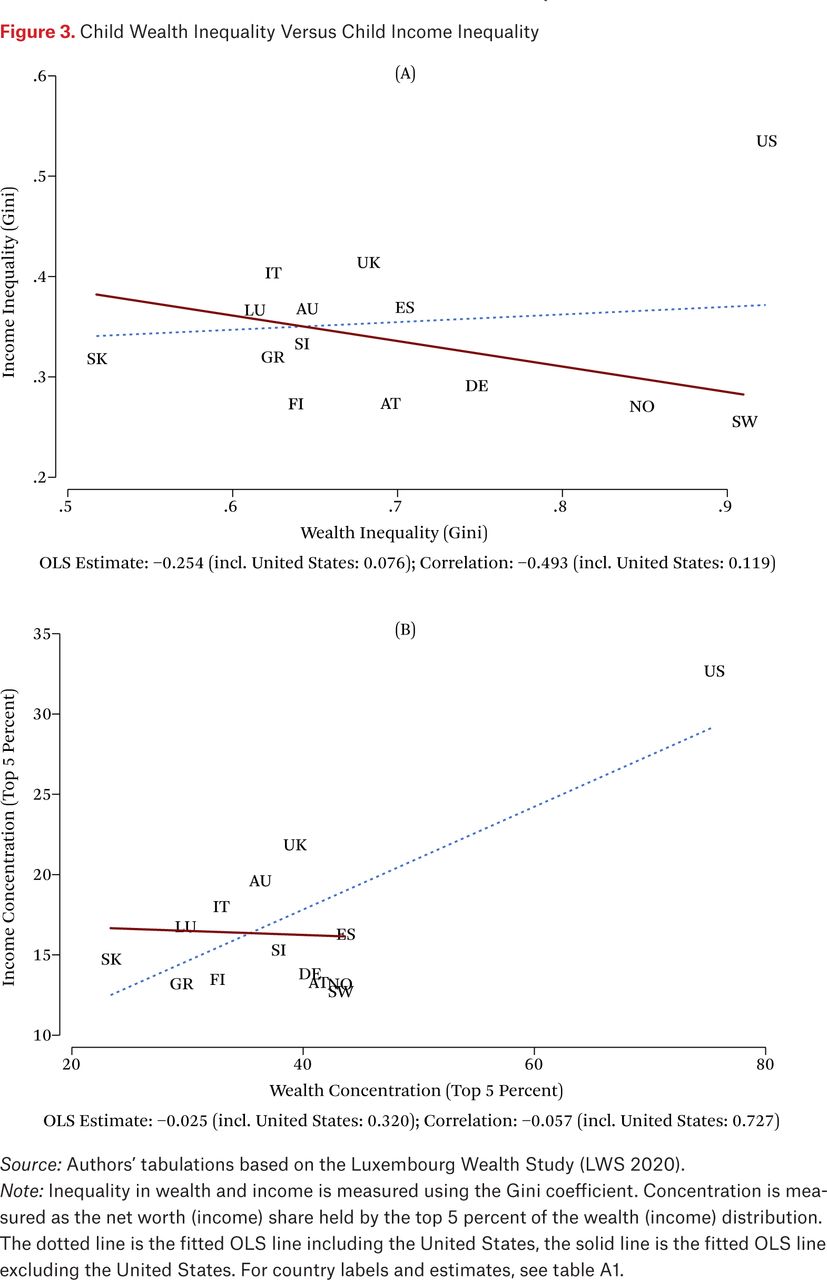
Child Wealth Inequality Versus Child Income Inequality
Source: Authors’ tabulations based on the Luxembourg Wealth Study (LWS 2020).
Note: Inequality in wealth and income is measured using the Gini coefficient. Concentration is measured as the net worth (income) share held by the top 5 percent of the wealth (income) distribution. The dotted line is the fitted OLS line including the United States, the solid line is the fitted OLS line excluding the United States. For country labels and estimates, see table A1.
CONCLUSION
Our comparative analysis of the wealth of children, adults, and seniors across fourteen countries yields the following main findings. First, in all countries studied, the wealth children experience is substantially lower than that of seniors, as one may expect. Second, in most countries, child wealth is distributed substantially more unequally than the wealth of seniors and, though less consistently and less pronounced, other adults. Third, an international ranking of child wealth inequality diverges sharply from one based on child income inequality. Finally, among all fourteen countries, the United States stands out as having a particularly pronounced child wealth disadvantage. In no other country do children lag further behind seniors in terms of their wealth attainment. In no other country do the young face higher levels of wealth inequality and concentration. And in no other country does that fate combine with exceptionally high levels of income inequality and concentration. Overall, then, these results add urgency to the empirical study of child wealth, especially within the United States, providing a fitting descriptive background for the studies in this issue.
A variety of immediate extensions to this work are possible. Our work can be read as a call for analytic attention to wealth in addition to income in national studies of inequality in opportunity. Some analysts may also want to pursue a perspective that jointly considers income and wealth in determining the life chances of the next generation to provide a more holistic picture of the economic conditions of children. Further, we acknowledge that the continued improvement of cross-nationally harmonized wealth measures is an important frontier for research. Future data production efforts may, among other things, pursue an improvement and harmonization of imputation approaches and increase oversampling of the wealthy. Finally, the continued expansion of the Luxembourg Wealth Study will provide additional comparative cases that may also help alter our understanding of the international distribution of child wealth and inequality.
Most of all, we hope that the results presented here may serve as a foundation for more explanatory pursuits that seek to uncover the reasons behind the documented, large cross-national variation in the wealth disadvantage and inequality of children. We pointed out that such explanations will likely need to go beyond classical analytical perspectives focused exclusively on labor market and welfare state institutions and also consider their interplay with housing markets and processes of financialization. Beyond the general task of institutional explanations of cross-national differences in wealth inequality writ large, explanations of the position of children should also pay attention to the kinds of institutions that sustain families’ ability to accumulate wealth, for instance, publicly funded early childhood education or generous parental leave policies. Because the United States is an international laggard in this institutional realm, it is tempting to ascribe the exceptional wealth disadvantage of children there to these institutional forces. Additional relevant evidence comes from the Scandinavian countries, Norway and Sweden, which offer broad access to early childhood education and generous parental leave policies and are marked by a much smaller gap between the wealth of children and adults. Yet these countries are also marked by very large gaps between seniors and children and by comparatively high levels of wealth inequality among them. As our prior comparison of wealth inequality for the general population also suggests (Pfeffer and Waitkus, forthcoming), Scandinavian egalitarianism does not appear to extend to the dimension of wealth. The more developed welfare state of these countries interacts with children’s economic position in a complex way. Although it supports broader redistribution and insurance of income streams, it may stymie individual savings while enabling credit taking, leading to similarly high levels of child wealth inequality as observed in the United States. The unique nature of U.S. children’s economic insecurity, however, is that they face very high levels of wealth inequality in a context that offers very limited public safety nets. In contrast, the most wealth-egalitarian countries for children identified in this contribution lie in central and southern Europe, with a former state-socialist country, Slovakia, showing the least wealth disadvantage for the young as they have similar wealth levels to those of the old and similar and comparatively low levels of wealth inequality and concentration.
Before any explanatory search for institutional determinants or even interventions can begin, however, research will also need to establish whether the findings presented here merely reflect different life-course stages in wealth trajectories (age effects), true generational gaps in wealth and wealth inequality (cohort effects), or whether they are mostly driven by the recent impact of the Great Recession (period effects). Only if the patterns established here arose chiefly from the first (age effects) would maintaining optimism about the future well-being of today’s children in the United States be possible. The diagnosis of their current condition, however, should be alarming to all.
APPENDIX A. DESCRIPTIVES
Gaps in Median Wealth
Wealth Inequality Within Groups
APPENDIX B. HOUSEHOLD-LEVEL ANALYSES
As a reminder, differences between the household- and individual-level results arise exclusively from demographic factors, namely wealth differences by fertility (such as families with more children holding less wealth) and household structure (such as senior singles holding less wealth than senior married individuals).
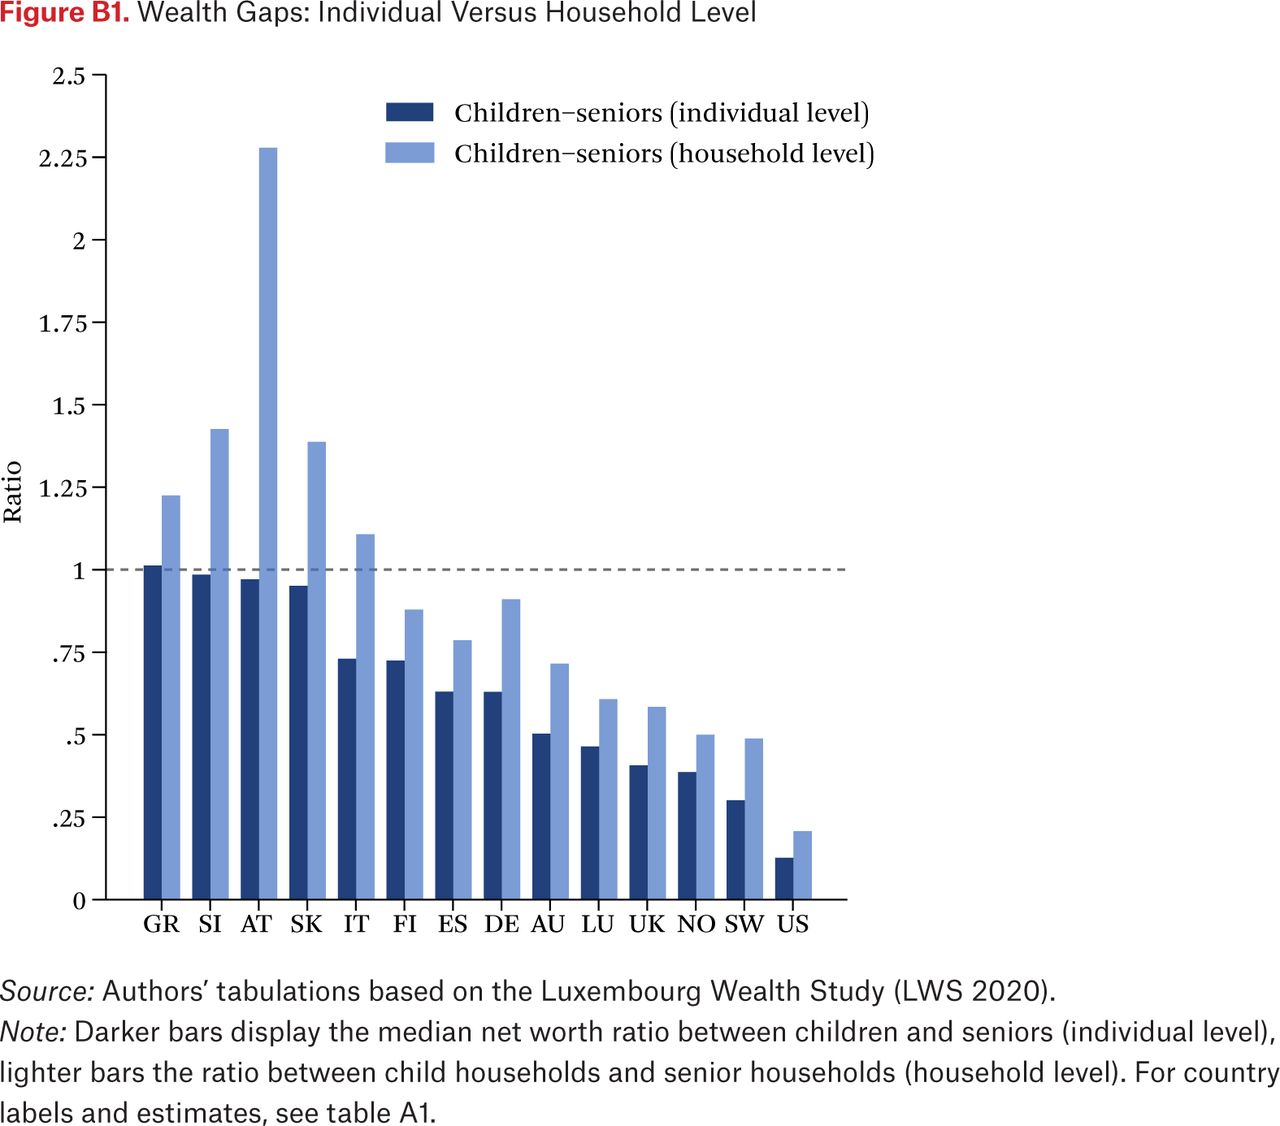
Wealth Gaps: Individual Versus Household Level
Source: Authors’ tabulations based on the Luxembourg Wealth Study (LWS 2020).
Note: Darker bars display the median net worth ratio between children and seniors (individual level), lighter bars the ratio between child households and senior households (household level). For country labels and estimates, see table A1.

Wealth Inequality: Individual Versus Household Level
Source: Authors’ tabulations based on the Luxembourg Wealth Study (LWS 2020).
Note: Inequality in wealth is measured using the net worth Gini coefficient. Concentration is measured as the net worth share held by the top 5 percent of the wealth distribution. Each measure is calculated separately among children (individual level) and among child households (household level). For country labels, see table A1.

Child Wealth Versus Child Income: Household Level
Source: Authors’ tabulations based on the Luxembourg Wealth Study (LWS 2020).
Note: Inequality in wealth and income is measured using the Gini coefficient. Concentration is measured as the net worth (income) share held by the top 5 percent of the wealth (income) distribution. The dotted line is the fitted OLS line including the United States, the solid line is the fitted OLS line excluding the United States. For country labels and estimates, see table A1.
APPENDIX C. HOUSEHOLD-SIZE ADJUSTMENTS
The main results reported in the article do not include adjustments for household size. Estimates reported here adjust household wealth, dividing it by the square root of household size.
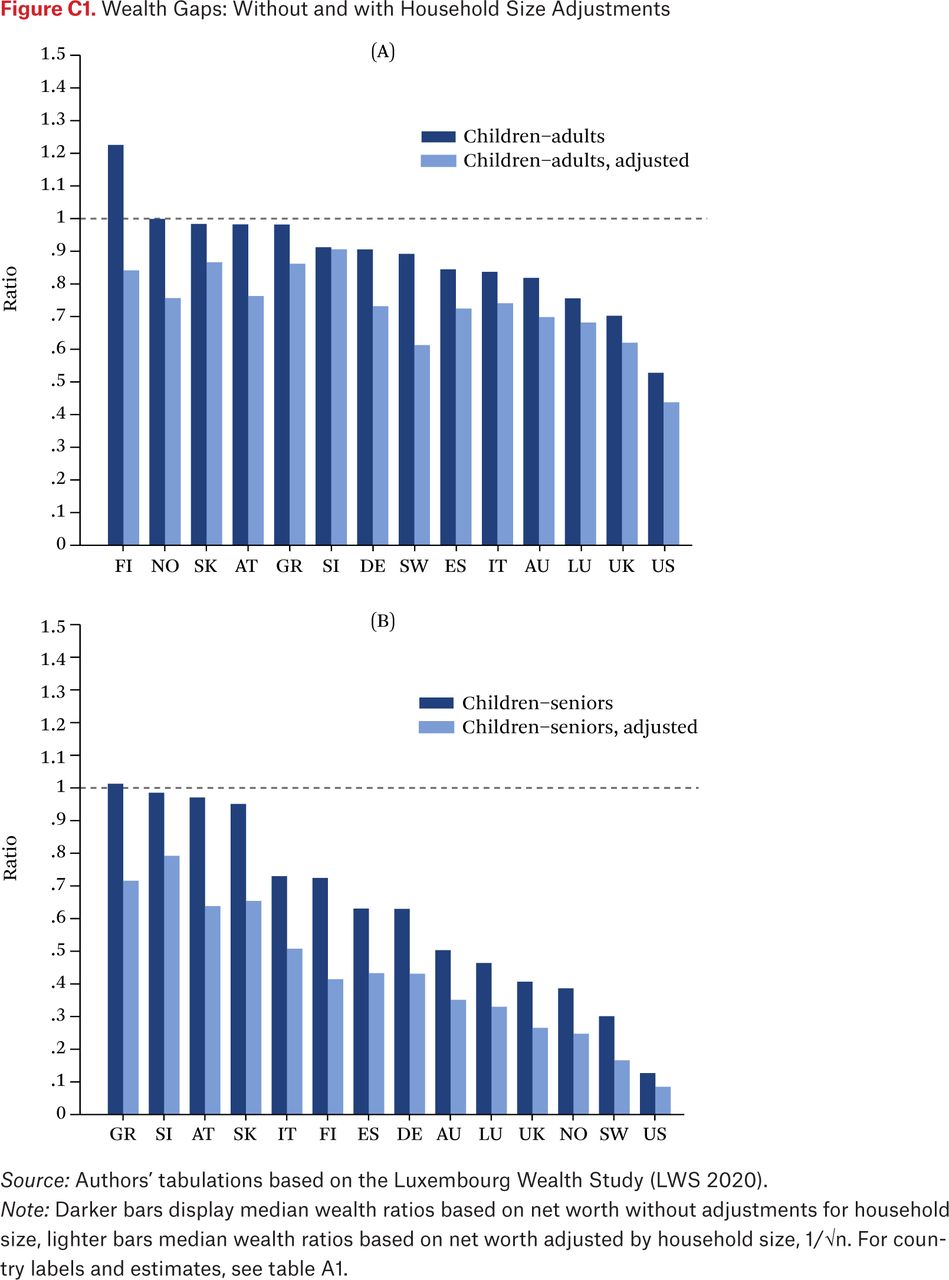
Wealth Gaps: Without and with Household Size Adjustments
Source: Authors’ tabulations based on the Luxembourg Wealth Study (LWS 2020).
Note: Darker bars display median wealth ratios based on net worth without adjustments for household size, lighter bars median wealth ratios based on net worth adjusted by household size, 1/√n. For country labels and estimates, see table A1.
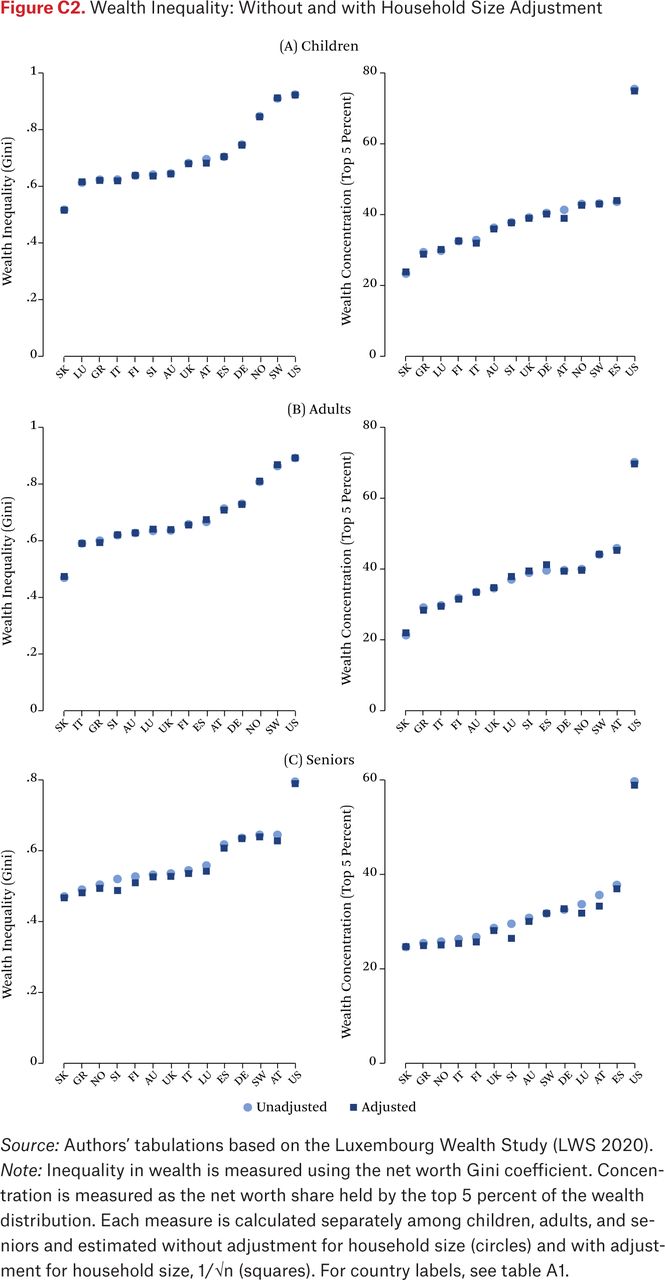
Wealth Inequality: Without and with Household Size Adjustment
Source: Authors’ tabulations based on the Luxembourg Wealth Study (LWS 2020).
Note: Inequality in wealth is measured using the net worth Gini coefficient. Concentration is measured as the net worth share held by the top 5 percent of the wealth distribution. Each measure is calculated separately among children, adults, and seniors and estimated without adjustment for household size (circles) and with adjustment for household size, 1/√n (squares). For country labels, see table A1.

Wealth Versus Income: With Household Size Adjustment
Source: Authors’ tabulations based on the Luxembourg Wealth Study (LWS 2020).
Note: Inequality in wealth and income is measured using the Gini coefficient. Concentration is measured as the net worth (income) share held by the top 5 percent of the wealth (income) distribution. The dotted line is the fitted OLS line including the United States, the solid line is the fitted OLS line excluding the United States. For country labels and estimates, see table A1.
FOOTNOTES
↵1. Wealth data for Canada are available in the LWS but because they do not include an indicator of the number of children in the household, we cannot include estimates for Canada in our analyses.
↵2. As to the influence of differences in measurement timing, see Pfeffer and Waitkus (forthcoming), who provide evidence on the stability of international rankings of wealth inequality before and after the Great Recession.
↵3. The children included here are born between the mid-1990s and the mid-2010s (between 1988 and 2005 in Sweden) and the elderly are born up to the immediate post–World War II years (up to 1940 in Sweden).
↵4. To be clear, we are not and cannot draw on survey measures of individual asset holdings. The few surveys that have collected wealth information at the individual level (such as the German Socio-Economic Panel and a select module of the Survey of Income and Program Participation) have, sensibly, only done so for the household reference person and their partner (for example, wife’s wealth and husband’s wealth assessed separately). It would in fact make little sense to measure the asset holdings of those who cannot legally hold most assets (outside of a child saving accounts).
↵5. Another notable aspect of this large child-senior wealth gap in Scandinavian countries is that it is based on wealth measures that do not include the substantial public pension wealth of seniors in these countries. One would expect these gaps to increase further when based on augmented wealth measures (those including pension wealth).
↵6. The household-level perspective yields marginally lower levels of wealth inequality and concentration than the individual-level perspective. The only exception is Luxembourg, where the estimates of wealth inequality and concentration among child households is substantially higher than that among children, implying that Luxembourg no longer diverges from the overall pattern found in figure 2). Overall, however, and in contrast to the prior assessment of wealth gaps between the young and the old, conclusions about differences in wealth inequality and concentration do not meaningfully depend on the analytical level. Substantively, we may conclude that cross-national differences in demographic structure, namely, wealth gradients in fertility and household structure, cannot account for cross-national differences in the wealth inequality today’s children face, confirming previous research (Davies, Fortin, and Lemieux 2017; Sierminska and Doorley 2018; Cowell, Karagiannaki, and McKnight 2018).
↵7. Multiyear measures of income (life-time income measures) yield somewhat higher but still far from perfect correlations with wealth measures. Although the cross-sectional data we draw on here do not allow us to use proxy measures of life-time income, it is doubtful that doing so would meaningfully alter the reported findings that are based on aggregate inequality estimates drawn from single income years.
- © 2021 Russell Sage Foundation. Pfeffer, Fabian T., and Nora Waitkus. 2021. “Comparing Child Wealth Inequality Across Countries.” RSF: The Russell Sage Foundation Journal of the Social Sciences 7(3): 28–49. DOI: 10.7758 /RSF.2021.7.3.02. Direct correspondence to: Fabian T. Pfeffer at fpfeffer{at}umich.edu, 2042 Institute for Social Research, 426 Thompson St., Ann Arbor, MI 48104, United States.
Open Access Policy: RSF: The Russell Sage Foundation Journal of the Social Sciences is an open access journal. This article is published under a Creative Commons Attribution-NonCommercial-NoDerivs 3.0 Unported License.
REFERENCES
In this issue


Jump to section
Related Articles
Cited By...
- No citing articles found.