
Abstract
Changes in firm strategy and structure partially explain the sources and consequences of rising wealth inequality in America. Combining use of state-created monopolies around intellectual property rights (IPRs) for profitability and firm-level strategies to transform their industrial organization by pushing physical capital and noncore labor outside the boundaries of the firm leads to rising levels of wealth and income inequality among firms as well as individuals. Income inequality among firms in turn reduces growth in productive investment and thus in aggregate demand. Slower growth reflexively deters firms from new investment, aggravating the shortfall in aggregate demand. Decreased protection for IPRs and increased protection for subcontracted workers would help increase aggregate demand and thus push growth back to its prior level, as well as reducing wealth and income inequality among individuals.
What explains rising economic inequality, particularly wealth inequality? What is the connection between rising economic-wealth inequality and secular stagnation? The other analyses in this special issue answer these questions using econometric techniques to tease out how specific individual or household characteristics such as, for example, marital status, incarceration, or geographic location contribute to wealth outcomes, or they present a series of snapshots for the distribution of wealth and consumption. These analyses are valuable, providing targets for narrow policy interventions and information for future studies. By contrast, this article looks at firms and the macroeconomy to complement the essentially microeconomic studies in this volume. Firms are the ultimate source of income and wealth. They provide most of the net productive investment that generates the growth that validates wealth, which, after all, is simply a claim on future profits and production. Unless it is inherited, individual wealth has to come from somewhere in the economy. The faster economic growth is, the more likely it is that rising employment and income drive rising individual and household wealth for the broader population. By contrast, as Edward Wolff shows elsewhere in this issue, macroeconomic instability and stagnant growth after 2007 contributed to falling wealth outside of a narrow slice of U.S. households.
Analyses linking rising household inequality to macroeconomic stagnation posit a relatively simple mechanism. Higher-income individuals have a lower marginal propensity to consume (Stockhammer 2015). This lower propensity to consume plausibly reduces aggregate demand, slowing growth. But this answer is self-evidently incomplete. First, as noted, it explains neither where household income comes from nor why income inequality has been rising. Second, it ignores other important parts of aggregate demand, and thus why higher savings do not produce higher investment. Conventionally, gross domestic product (GDP) is the sum of C + G + I + (X – M), that is, consumption, government spending on goods and services, investment and net exports. The change or delta (∆) in GDP is the sum of the various changes in each of these four components. Consumer spending unquestionably constitutes the bulk of demand in the U.S. economy, ranging from 65 to 70 percent of GDP in any given year in the past four decades. But the other 30 to 35 percent is hardly residual. Indeed, given the inevitable decline in household income during a recession, the whole point of countercyclic fiscal policy is to boost both C and G by replacing lost C with automatic government transfers as well as creating positive ∆G via infrastructure or other nontransfer spending; the point of monetary policy is to boost investment (to create positive ∆I) to compensate for declining investment.
When John Maynard Keynes wrote in 1936, the vast majority of households lived from paycheck to paycheck, so it was obvious that household consumption was a secondary factor in the formation of new income. This is less true today, given the availability of credit and the modicum of assets the average household owns (see Wolff, this issue). Still, recent survey data suggest that about 60 percent of U.S. households have less than $1,000 in liquid savings and that one-third of those households do not have a bank savings account. For most households, then, credit is a buffer against falling income rather than a net increase. In the other 40 percent of households, most credit is mortgage credit, but conventionally new housing construction is categorized as a fixed investment. Consequently, investment and government spending still dominate because they constitute the majority of net new spending, and it is this delta that matters for growth.
To the extent that we live in a world of rising household income inequality (Piketty and Saez 2006), it could be argued that the lower marginal propensity to consume at the top of the income pyramid could generate additional savings that then flows into some sort of investment. Yet investment growth is both unusually weak and at historically low levels as a share of GDP (U.S. Bureau of Economic Analysis [BEA] 2014, table 1.1.6). This raises an interesting question: why does the extra saving by higher income households not translate into growth promoting investment? The annual increase in U.S. private fixed nonresidential investment after 2001 has been substantially slower than the prior decade, aside from the rebound year of 2012. Moreover, the absolute level of investment is also flat. Obviously, the housing bubble has something to do with that: real gross residential fixed investment in 2014 still only approximated the absolute level of spending in 1993. But corporate investment has also been tepid. As of December 2015, the absolute level of gross private fixed investment net of residential construction was only 12 percent above its 2007 level in real terms, net investment (which matters more) was 12 percent below the 2008 peak, and both were below trend (BEA 2009, table 5.2.6). The investment slowdown points us in the direction of corporate strategy and structure because corporations are what translate household savings into productive investment.
Government spending growth is just as tepid as corporate investment growth. Absolute U.S. government spending at all levels is roughly at the same level as in 2005 in real terms, having (understandably) fallen from its peak during the Obama stimulus period from 2010 to 2011. With respect to ∆G, total government spending on consumption and investment in 2015 was at roughly the same absolute level as in 2006, although GDP had grown 12 percent in real terms; federal spending absolutely was at 2007 levels, and state and local government spending was absolutely only a bit above the 2000 level (BEA 2014, tables 1.1.2, 1.16, and 3.9.6). As with the tepid investment response to historically low interest rates, government fiscal restraint has an important corporate component. The post-2008 crisis years have seen concerted political pressure from largely conservative parties to restrain government deficits.1 To the extent that revenue growth is weak, so is spending growth. Tax cuts obviously constrain revenues. But corporate tax avoidance schemes that allocate profits to entities in tax havens also constrain revenue (Zucman 2015). As of 2015, the five hundred largest U.S. firms held $2.1 trillion offshore, avoiding an estimated $620 billion tax liability (McIntyre, Phillips, and Baxandall 2015). By way of comparison, the 2010–2011 Obama economic stimulus package amounted to $831 billion, suggesting that a stimulus-worth of untapped revenue sits idle; alternately, this $630 billion equals 20 percent of total government consumption and investment spending in 2015. Put differently, these offshore holdings were five times nonresidential fixed investment in 2014, suggesting that simply spending them down over the next decade might boost net investment by 50 percent each year over that decade.
This article thus looks to inequality in corporate income (profit) and wealth (market capitalization) for a major source of rising inequality in household income and wealth, and thence slower growth. Secondarily—because profits must be earned before they can be sequestered in tax havens—it looks at the limits to fiscal policy created by firms’ use of tax havens. Put simply, rising income (profit) and wealth inequality among firms is what drives much of both rising individual income and wealth inequality and much of the tepid investment response to the greatest monetary stimulus in U.S. history.
Changes in U.S. firms’ strategy and structure drive interfirm inequality. Firms’ strategies for profitability increasingly depend on legally constituted monopolies, particularly but not exclusively the patent and copyright system, and from intangible assets and regulatory monopolies more generally. Firms possessing intellectual property rights (IPRs) can use them to extract monopoly rents from other firms and consumers, producing interfirm inequality of profits. Firms’ structure has also changed in response to financial market pressure to maximize shareholder value—that is, return on assets. This pressure forces or induces firms to pursue industrial organization strategies that shift labor and physical assets outside the legal boundaries of the firm, producing individual-level inequality and weakening the rate of growth of consumption. Shifting physical assets outside the firm means that firms with strong IPR positions accumulate monopoly rents but have no incentive to invest back in the real economy, weakening investment growth. Evidence is increasing that firms with higher profits also pay higher wages (Song et al. 2015; Barth et al. 2014), so shifting labor outside firms with strong IPRs or other monopoly positions and into firms with no ability to extract rents contributes to rising household income inequality by polarizing the wage structure. On one side are firms in highly competitive markets whose profitability depends on depressing wages; on the other side are firms accruing monopoly rents and sharing part of those rents with their increasingly smaller slice of the total workforce.
Interfirm inequality dampens investment; interpersonal inequality dampens demand; these contribute to secular stagnation. In turn, slow growth intensifies pressure on politicians to pursue self-defeating strategies of fiscal austerity, weakening growth of government spending. Although these processes do not explain everything about modern inequality or slower growth, they do suggest that a significant part of that inequality and stagnation is neither inevitable nor irremediable. Because rising inequality stems from the combination of state-constituted monopolies and changes in industrial organization, public policy can address at least part of the problem of rising wealth and income inequality.
SECULAR STAGNATION?
Growth in the U.S. economy slowed markedly in the 2000s. Real GDP and real per capita GDP respectively increased by roughly 37 percent and 24 percent in the 1970s, 1980s, and 1990s (yes, even the often lamented 1970s). But these growth rates halved after 2000. U.S. growth rates remained among the highest for the twenty-two rich OECD countries,2 which saw an even greater slowdown in aggregate GDP, though less of one in per capita GDP growth. Worse, from 2009 to 2015, of a total of 154 possible country-years for these twenty-two countries, only eight years had no output gap, and the OECD as a whole has had a persistent output gap of about 2.4 percent of GDP (OECD 2015a). Is this slowdown and the past decade in particular a case of secular stagnation? Strictly speaking, secular stagnation arises from insufficient aggregate demand. Arguments positing a supply side basis for slow growth are not, strictly speaking, secular stagnation arguments. Although I offer an argument based on aggregate demand, the supply-side arguments for slow growth need to be taken seriously and accommodated in an argument that stresses demand-side factors. Focusing on the wealth and income distribution effects of IPRs allows us to combine important supply- and demand-side factors.
Robert Gordon (2012, 2014) argues that the United States and other rich OECD economies have exhausted the stock of truly revolutionary supply-side technologies. Flush toilets matter more than flash telephones in the sense that new technology yields diminishing returns in productivity in comparison with the once-only technological breakthroughs of the century from 1850 to 1950. This explains the productivity and thus growth slowdown that began in the 1970s. In addition, slower population growth also slows aggregate GDP growth, though its effects on productivity are less obvious. Dismissing optimists such as Paul Markillie (2012), Erik Brynjolfsson and Andrew McAfee (2014), and Michael Rüßmann and colleagues (2015), Gordon suggests that the natural rate of productivity growth will revert to its historic level of about 0.25 to 0.33 percent per year over the rest of the century.
Gordon’s argument comports with Joseph Schumpeter’s (1939, 1942) about the importance of clusters of radical innovation for igniting growth. Schumpeter argues that without a cluster of radical innovations, growth settles into a “circular economy” pattern in which profits cover depreciation and managerial salaries for owners, but per capita growth is nugatory.3 Schumpeter’s circular flow economy is Gordon’s economy. For Schumpeter, rapid growth requires bold entrepreneurs, and entrepreneurs require the prospect of monopoly rents to propel them into action. Indeed, unlike most neoclassical economists, Schumpeter explicitly praises monopoly:
A system—any system, economic or other—that at every given point of time fully utilizes its possibilities to the best advantage may yet in the long run be inferior to a system that does so at no given point of time, because the latter’s failure to do so may be a condition for the level of speed of long-run performance. (1942, 83)
The possibility of radical innovations in product and process creates the possibility for quasi-monopoly rents for firms at the technology frontier; the prospect of rents catalyzes credit creation to bring those technologies to market.4 But without rents, radically new technologies will not come into the market. Schumpeter expects these rents to dissipate over time, throwing the economy back into a circular flow state. Yet, if Gordon is right, then we currently see Schumpeterian rents without (significant) innovation or growth. If Schumpeter is right, then Gordon is mistaken about the growth and investment implications of the new technologies identified by the optimists he dismisses. To rephrase Solow about this paradox, why does the current round of technological innovation show up in profitability but not the productivity statistics, and why is there an apparent disconnect between innovation, rents, and investment levels? Keynes suggests some demand-side answers to these questions.
The shortest possible version of Keynes’s General Theory is that the economy possesses multiple stable equilibrium states rather than one optimal state posited by neoclassical economics (1936, see in particular chapter 16). At one extreme is a high-investment, high-wage, high-demand equilibrium that generates high profits, high employment, and high growth. The other extreme is a low-investment, low-wage, low-demand equilibrium that generates low profits, low employment, and low growth, rather like Schumpeter’s circular economy. Keynes divided demand up into two components. D1 connoted household consumption (C in modern GDP accounting), which, as noted, Keynes assumed was relatively stable given households’ lack of access to credit or savings and also because of the stickiness of wages. D2 connoted demand for investment goods (I in modern GDP accounting), which both suffered from volatility and, when rising, provided for a powerful increase in demand through its multiplier effects. Keynes anticipated the later division of demand into C + G + I, given that his solution for weak C + I was an increase in government spending, G.
The essential mechanism maintaining Keynes’s lower equilibrium is not so much feeble entrepreneurs—though fear does deter investment—but rather rational responses to slow or slowing growth. Firms facing weak demand would not invest, for fear of creating overcapacity and decreased profits. Instead, whatever profits they generated would simply accumulate in banks as firms used profits to retire debt (Koo 2011). (Today they park profits overseas instead.) This reduction in D2 or I would create a self-sustaining slack economy in which low demand deterred new net investment, and in which low new net investment in turn assured continued low demand. In this economy savings pile up, producing low interest rates, but low interest rates fail to induce new investment given weak demand and investor fear. This is the essence of the liquidity trap. Keynes puts this issue succinctly, answering the question of why the lower marginal propensity to consume on the part of the rich, or for our purposes the lower marginal propensity to invest on the part of rich firms, does not automatically result in more savings and more investment:Those who think [that savings automatically get productively invested] are deceived, nevertheless, by an optical illusion, which makes two essentially different activities appear to be the same. They are fallaciously supposing that there is a nexus which unites decisions to abstain from present consumption [saving] with decisions to provide for future consumption [productive investment]; whereas the motives which determine the latter are not linked in any simple way with the motives which determine the former. (1936, 21)
Although an individual act of saving seemingly increases the potential pool for investment, that saving—in the absence of an automatic mechanism producing investment —subtracts from demand, leading to a decrease in someone else’s income and thus diminishing the total pool of savings available for investment. Declining investment produces declining savings, as the data show (see Wolff, this issue). Keynes saw the central economic problem as assuring that investment grew, and equally importantly grew consistently, in order to maximize employment. Schumpeter (1942) argued that the state should get out of the way of heroic entrepreneurs sparking a new round of growth through innovation; Keynes argued that the state had to inject demand into the economy, encouraging risk averse firms to invest rather than pile up cash. This visibly increased demand would calm Keynes’s timorous entrepreneurs and induce matching private investment. The strong multiplier effects of state-sponsored investment would provide the new goods and services needed to absorb the initial injection of money and thus prevent inflation. They would also generate the income needed to supply savings for this new investment. State-sponsored investment thus had public goods aspects (as indeed does all productive investment and credit creation).
As with Peter Thiel’s and Robert Gordon’s updating of Schumpeter, Keynes’s arguments also have modern carriers, as in Lawrence Summers’s (2014) revival of Alvin Hansen’s (1939) secular stagnation arguments. Summers’s analysis, however, largely concentrates on low nominal interest rates as an indicator of excess savings. Like Keynes, Summers sees the zero-bound as an impediment to policymaking because monetary authorities cannot push nominal rates below the zero-bound (2014, 29).
Schumpeter’s and Keynes’s analyses seem somewhat at odds on the current situation. On the one hand, low interest rates should crowd investment into highly promising technologies. Indeed this seems to be the case with Silicon Valley’s “unicorns”—software-based firms with private or public equity market valuations over $1 billion that promise to capture enormous monopoly rents (such as Uber, Flipkart, Delivery Hero). Moreover, contra Keynes, profits appear to be at secular highs. According to the McKinsey Global Institute, global firms’ net income after taxes and interest payments rose by a factor of five from 1980 to 2013, and tripled before taxes and interest (Dobbs et al. 2015).5 The share of profits in global GDP also rose from 7.6 percent to 9.8 percent from 1980 to 2013; for U.S. firms, profits after tax rose from an average of 4.2 percent of gross domestic income in the 1980s to 6.1 percent in the decade to 2014 (Dobbs et al. 2015; FRED n.d.).
On the other hand, despite high profitability and extremely low interest rates, ever more cash seems to be piling up in ever fewer firms’ hands without generating much Schumpeterian investment. Low interest rates have facilitated increased U.S. corporate borrowing, but this debt is not used for real investment. Instead, U.S. firms have poured more money into stock buybacks and dividends than into fixed investment. Joshua Mason reports that each additional dollar of corporate earnings or borrowing yielded only 10 cents of investment in the 2000s, versus 30 to 40 cents the 1960s (2015, 19). In principle, money returned to households via share buybacks could be channeled into investment by other firms. In practice, given the massive inequality in household equity ownership, much of the money returned to individual households flows into passive investments and nonproductive “assets” that are actually positional goods of one sort or another. Eventually this money ends up as the $2.5 trillion in excess reserves banks have parked at U.S. Federal Reserve banks. This is the modern version of Keynes’s liquidity trap.
Corporate wealth is very unequally distributed. At the beginning of 2014, the world’s 1,200 largest nonfinancial firms collectively held about $3.5 trillion in cash or cash equivalents. Firms with more than $2 billion held 85 percent of this cash, and the top 10 percent of firms held a bit more than 50 percent (Burn-Murdoch and Bennetzen 2014; see also Pinkowitz, Stulz, and Williamson 2012). Among these firms, U.S. firms—the majority of the top 10 percent—held 50 percent of all cash, and Apple alone accounted for 5 percent of global cash and thus 10 percent of U.S. firms’ cash. As the next section shows, this pattern of inequality in corporate cash holdings is connected to differential control over intellectual property or access to rents because these cash holdings are retained profits qua rents. The combination of unequally distributed cash holdings and the passive investment of those holdings is the material manifestation of the liquidity trap.
INTERFIRM PROFIT AND WEALTH INEQUALITY
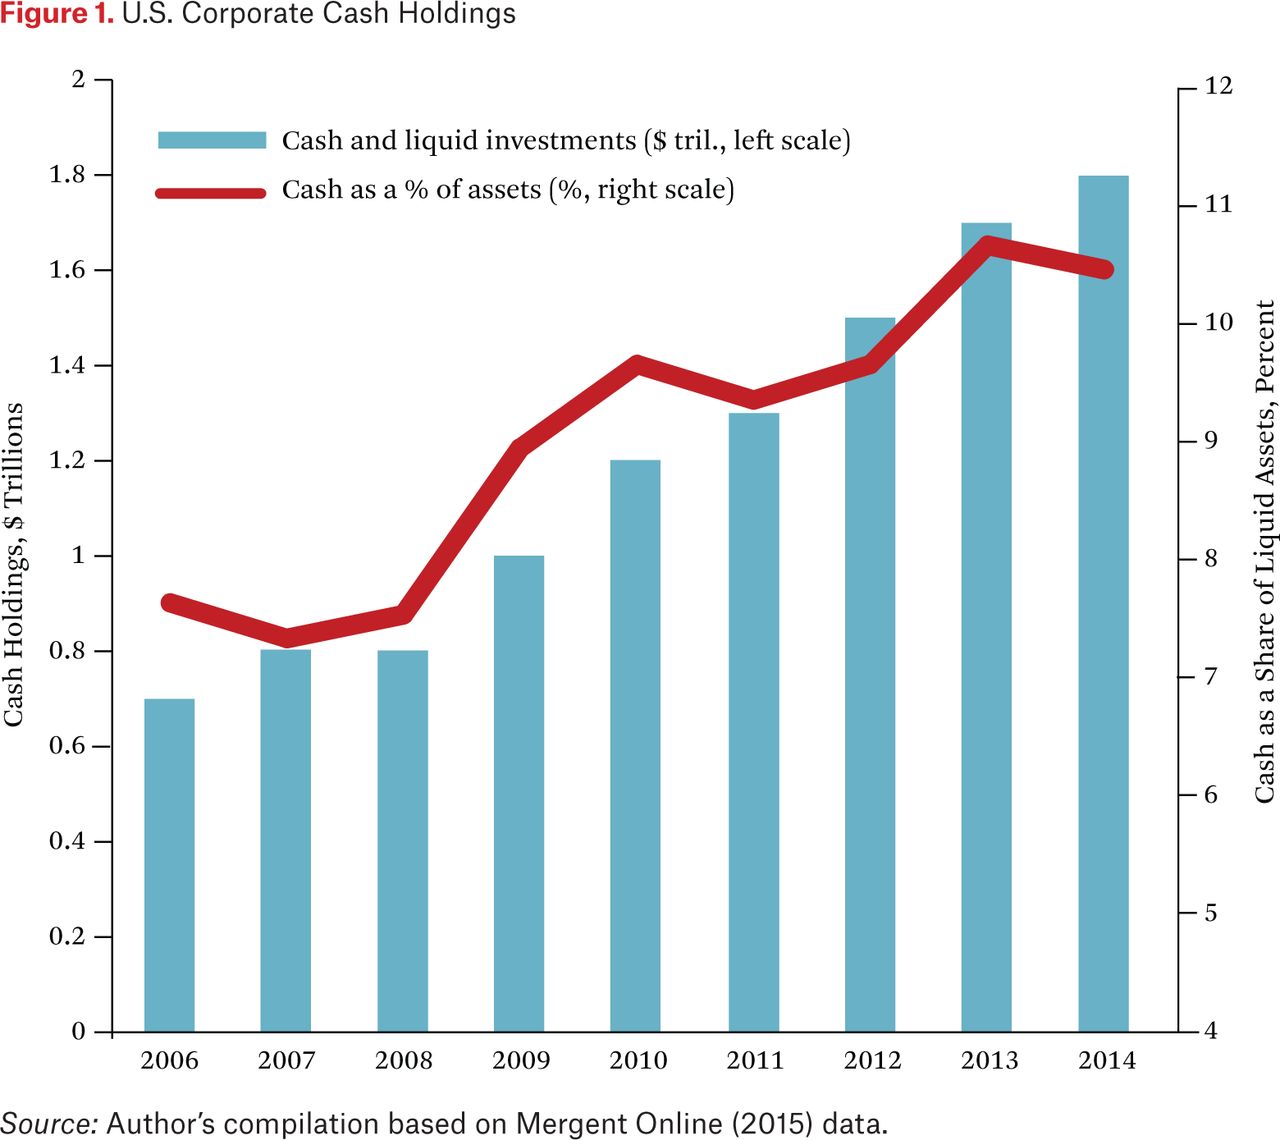
Why do firms have such large cash hoards, and which firms? Why is monetary policy ineffective in motivating use of those hoards? This section examines the distribution of profits and cash holdings among global publicly listed firms to show why Schumpeter’s rents pool in Keynes’s liquidity trap. Juan Sánchez and Emircan Yurdagul report that U.S. corporate cash holdings were at historically high levels relative to the size of the economy in 2013, amounting to a full $5 trillion for all publicly held U.S. firms, as opposed to just those within the global 1200, and $1.6 trillion for U.S. nonfinancial firms (2013, 5; see figure 1). Moreover, the rate of cash accumulation accelerated from roughly 7 percent per year, 1980 to 1995, to 10 percent, 1995 to 2010. The rate of growth was even faster at the end of the second period. The net result is that the ratio of corporate cash holdings to GDP rose from about 6.5 percent to about 14.5 percent from 1990 to 2014.

U.S. Corporate Cash Holdings
This cash is distributed quite unequally. Of the roughly $1.8 trillion in domestic cash U.S. firms held at the end of 2014, the top four firms accounted for 21 percent and the top twenty-five firms (the corporate 1 percent) for almost 50 percent (Monga 2015). This inequality necessarily reflects differences in the underlying profitability of firms, because cash holdings necessarily arise from profits, which in turn create differences in market capitalization.6 Using a different dataset than Sánchez and Yurdagul (2013), Jason Furman and Peter Orszag report that the variance in nonfinancial corporate return to investment has increased significantly over the past thirty years, confirming rising inequality in profitability (2015, 9–10).
This inequality can be seen by constructing Gini indices for the two thousand publicly listed firms in the Forbes Global 2000 (FG2k) and for the 5,267 publicly listed nonfinancial firms in the Osiris database that had operating revenues exceeding $1 billion in 2014 (Forbes 2015; Bureau Van Dijk 2015).7 The FG2k firms account for roughly one-third of all corporate profits in any given year. The annual Gini index for profits among the FG2k firms over the 2006 to 2015 period averaged 0.649; the Gini for total profits by all U.S. firms in the FG2k 2006 to 2015 was higher at 0.744. The Gini for sales and assets was 0.59 each. Stripping out financial firms and utilities, the FG2k Ginis remain largely the same. Gini indices for profits by the nonfinancial firms in the Osiris dataset show a similar pattern. To eliminate noise, I aggregated profits into five-year periods beginning in 1990 and ending in 2014. The average Gini over this much larger set is unsurprisingly higher than for the FG2k, at 0.792, because it includes a much longer tail of low or no profit firms, even after truncating firms with losses. Truncating the Osiris data at two thousand firms over the same period as the FG2k generates a similar Gini at 0.639, even though the Osiris set excludes financial firms. This pattern of inequality holds across sectors in the Osiris data.
This high level of inequality in firms’ profitability translates into inequality in their wealth—market capitalization—and consequent to that inequality in the wealth and income of the people employed by those firms. The average Gini for market capitalization among the FG2k firms was 0.607. These Ginis are considerably higher than the corresponding indices for individual or household inequality in a wide range of countries (table 1).
Corporate Profit Inequality and Household Income Inequality
The unequal distribution of global profits is replicated inside national economies. Table 2 compares the eight largest sectors inside the United States, Germany, and Japan in terms of their share of total profits, and thus firms’ ability to accumulate corporate wealth in the form of both retained earnings and market capitalization, for firms from those countries and in the FG2k list. This comparison is crude, given that firms inside the same nominal category do not necessarily have the same degree of IPR heaviness, as the subsequent discussion of firms based on the Osiris data shows. It is based on profits as a percentage of sales, a slightly unusual indicator, a choice I justify later. But it still provides an interesting snapshot of sectoral dominance in the three largest market economies, and the degree to which profits are above average in those sectors. For example, both the centrality of automobile manufacturing in Germany, and its mediocre profitability (despite Porsche’s outlandish 2008 financial coup squeezing VW shares) are evident. Automobile firms in both Japan and Germany make returns that exceed both their U.S. auto counterparts and their own national averages, but which nonetheless are lower than the economy-wide average for the United States. Likewise, four of the eight largest sectors by profit volume in the United States arguably are IPR firms. But aside from Japanese pharmaceutical firms—whose prices are tightly regulated by the Japanese state and who are notoriously bad at innovation—the IPR sectors everywhere all have ratios of profit to sales well above their national averages.
Eight Largest Sectors in Forbes Global 2000
The distribution of U.S. corporate cash holdings suggests that IPRs explain these differences in profitability. This distribution is both unequal and favors firms controlling significant IPRs. Table 3 displays the ten largest firms in terms of offshore cash holdings. These firms collectively hold about one-third of the total cash held by the two thousand largest U.S. firms. The predominance of tech and pharmaceutical firms in this list is obvious. Indeed, as table 2 might suggest, only two U.S. oil firms and two banks break the top twenty. By contrast, the two largest automobile firms in the world, VW and Toyota, collectively employing about 930,000 people and generating nearly $0.5 trillion in annual revenue, together held only about $60 billion in cash in 2014, about the same as Google, with sixty thousand employees and $66 billion in revenue.
Top Ten U.S. Firms by Cash Holdings at December 2014
We would expect large sectors, such as autos in Germany or Japan, to capture a large share of profit simply because they account for a large share of economic activity. The question is whether those profits are disproportionate to the size of the sector. This is the first reason I use net profit as a share of operating revenues as an indicator. Although there is no reason to expect profit as a percentage of sales to equalize over time, profit relative to operating revenue is a reasonable indicator of the degree to which a firm captures value from the value chain of which it is part. This is a reasonable indication of the degree to which monopoly power is successfully exercised.
To operationalize this, I selected the three hundred largest firms in the Osiris dataset by cumulative net profit over four five-year periods starting in 1995. These firms account for roughly 60 percent of the net profit of the five thousand plus firms in the dataset for any given period. Because we are concerned with the delta in investment and in government revenues, these firms matter as they are both big and control the bulk of profits. At the same time, the choice of a global rather than U.S. dataset is a conservative option, given the predominance of U.S. firms in many IPR sectors. I aggregate the net profit and operating revenues for these firms by NACE sector in five-year periods beginning in 1990.8 Aggregating data to the sector level is also a conservative choice. I then calculated the average ratio of tangible fixed assets to intangible fixed assets for the same periods for a given sector. Table 4 presents the results of a simple correlation of the share of net profit in operating revenues against the ratio of intangible fixed assets to tangible fixed assets. Despite the enormous positive “China” shock to profits for oil and materials based firms in the 2000s, it shows a steadily increasing correlation from 1995 to 2014. Though none of these rise to the level of statistical significance, the last period is close at p = 0.106. Figure 2 presents the data for the twenty largest sectors visually, the size of the bubble being proportional to the sector share of total profit. The three outliers to the northwest are real estate, pipelines, and coal mining. The last two benefited from China’s outsized demands for energy, and the first from the housing bubble. Stripping them out would make the correlation statistically significant at p = 0.05.
Net Profit to Operating Revenues
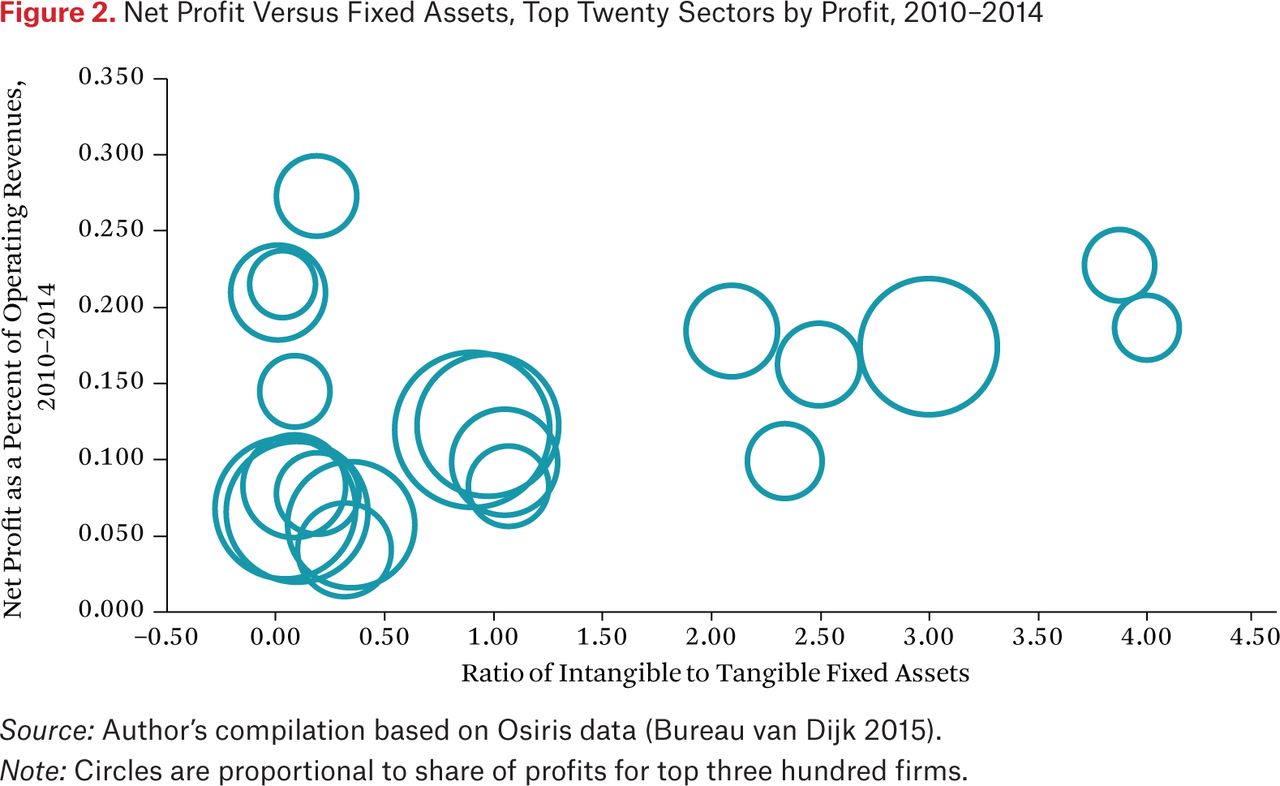
Net Profit Versus Fixed Assets, Top Twenty Sectors by Profit, 2010–2014
The second reason to use the ratio of net profit to operating revenue as an indicator of market power relates to changes in industrial organization that affect the distribution of income to individuals. IPR firms have a disproportionately large share of profits relative to operating revenue or sales, and have disproportionately large cash holdings. An unequal distribution of profit among firms is nothing new, as the Osiris data show. The Gini for corporate profits was as skewed in the 1990s as it is today. Also, the giant mass production firms that dominated the economy of the 1950s and 1960s probably captured outsized profits via oligopolistic competition. Yet the economy had strong growth, a relatively equal distribution of income, and smaller pools of retained earnings compared with today because the form of industrial organization redistributed those profits not only widely within the firm but also across firms with much larger headcounts than today.
To understand what changed, we have to look at how IPR firms generate profit and how the predominant form of industrial organization has evolved over the past four decades. Put simply, the nature of IPRs as monopolies allows the profits that these monopolies generate to accrue in firms with a lower propensity to invest, allows those firms to shrink their labor footprint to the smallest possible size (which concentrates wage income), and allows those firms to shift profits to low tax venues with greater ease than the industrial behemoths of the 1960s could. The following sections discuss the sources of monopoly power and changes in industrial organization, that is, the new combination of strategy and structure.
Strategy: IPRs, Monopoly Profits, and Industrial Inequality
Mid-twentieth-century firms’ profitability depended on their control over physical capital and the efficient management of that physical capital. The biggest and most profitable firms were those controlling large fixed investments (Piore and Sabel 1984). These firms did most of their production in-house, and their employee base incorporated a huge range of ancillary services supporting production (Lazonick 2009). Think: the old GE or GM. GM’s employee headcount in 1960 was roughly six hundred thousand, and it did (inter alia) its own accounting, cleaning, and catering. It produced 70 percent of its value in-house, and designed and built most of its machinery. The nearest equivalent today would be Samsung, a diversified industrial giant, which draws some inputs from its chaebol family members while exploiting Korean small and medium-sized enterprises. In the 1960s, tangible assets such as plant and equipment constituted 80 percent of the stock market capitalization of the S&P500 (OceanTomo). Stock market capitalization is the equivalent of a firm’s wealth and a reasonable approximation of its power (Weber 1978, 93, 108, 638; Nitzan 1998).
Today, firms’ profitability largely depends on their control over intangible assets, which largely means IPRs such as patents, copyright, and trademark. The biggest firms in terms of market capitalization and profitability are those controlling the most valuable patent and IPR portfolios. In a significant change in industrial organization, these firms largely subcontract everything not related to the direct production of their IPRs, shrinking their employee base to the absolute minimum. This subcontracting includes the physical production of goods. Think: Apple. Apple’s employee headcount is about ninety thousand, but sixty thousand of these are contract workers in its retail stores. Apple subcontracts virtually all of its physical production to firms such as Foxconn (Hon Hai Precision) that use cheap Chinese labor. Apple makes nothing physical itself, aside from a few highly specialized servers. By 2005, intangible assets constituted 80 percent of the market capitalization of the S&P500.
IPRs give their owner a legal monopoly. Inequality among firms arises from the increasing density of IPRs in a handful of firms. Paul Samuelson (1954), Elinor Ostrom (2010) and James Buchanan (1965) define goods using the two binary characteristics of excludability (essentially, can I legally prevent someone from consuming a good?) and rivalry-subtractability in consumption (does my consumption of a good subtract from what you can consume of that good?). This defines four types of goods: private goods, public goods, common pool goods, and club goods.
In Ostrom’s (2010) terms, information wants to be a public good, that is, one that is nonrival (nonsubtractable) in consumption and nonexcludable and thus “free” (but see Doctorow 2014). In the extreme case, a digital copy of a piece of music using a standard coding format can be distributed to anyone with a device that can play that codec. Production costs for digitized music are essentially the studio rental fee. Given very low costs of production for the first digital version, the average cost of production is minimal and the marginal cost of reproduction is virtually zero (some electricity is consumed downloading and playing the file). Digitized music is close to being a pure public good—nonexcludable, nonsubtractable. How can actors producing music be profitable in this environment? In the absence of profits, why would they produce public goods in the first place?
Profits can only arise if the state creates and enforces excludability via IPRs. IPRs transform public goods into club goods by creating excludability (Buchanan 1965) and create a possible incentive for production. In this process, the state creates and enforces both the quantity and quality of excludability and thus determines the potential profitability of any given club good. Thus the music industry has directed major lobbying efforts toward creating, enforcing, and extending the Digital Millennium Copyright Act (DCMA) of 1998 as well as toward doubling the copyright period through the Copyright Extension Act of 1998. The DMCA makes it illegal to thwart copyright protection methods using software or hardware. According to the Center for Responsive Politics, the Recording Industry of America Association (RIAA) spent roughly $90 million lobbying over the decade of the 2000s and an additional $50 million in litigation against alleged pirates.9 All this lobbying was directed at steadily expanding the scope and effectiveness of restraints on copying of digitized information and thus making it possible to monetize digitized music. The quality of these property rights (their duration, exceptions, or mandates for licensing) matters as much as the quantity (the simple fact of a patent or copyright). Politically defined IPRs determine a significant part of the profitability of a club good and thus the equity market capitalization of the firms producing club goods.
In the worlds of legal and economic theory, IPRs are not a problem. Theoretically, these monopolies expire and are subject to competition through innovation.10 Practically, though, the link between stock market capitalization and cash flow built on existing monopolies prevents this. Firms’ market capitalization is based on current and expected cash flow. Firms with monopolies have a large expected cash flow and thus a large market capitalization relative to their asset base. This market capitalization allows them to preempt competition by using their monopoly profits and stock to buy up potential competitors. Consider the iconic information economy firm Google. Google has bought Motorola Mobility (cell phones), Nest (in-home data collection), Waze (mapping and traffic info), AdMob (cell phone advertising), YouTube (ad delivery channel), and more. As a strategic matter, each of these purchases protects part of Google’s franchise (indeed the business press often uses exactly this language to explain the whys and wherefores of these acquisitions). This is why 85 percent of U.S. firms with a return on capital over 25 percent in 2003 were still enjoying that level of return in 2013 (Furman and Orszag 2015, 11), and why IPR intensive firms held the bulk of corporate cash in 2014.
The IPR phenomenon is not limited to nominally high-tech firms, and in any case, some firms that manufacture high-tech goods, such as Flextronics, do so with low margins. Rather, the distinguishing features here are the adoption of a profit strategy in which state-granted monopolies generate corresponding monopoly rents, and of an industrial organization structure that shrinks the employee headcount. This combination extends all the way from iconic tech firms, such as Apple, to decidedly low-tech but not old-fashioned firms, such as McDonald’s, which control brands. Between the two are hotel brands, branded beverage producers, pharmaceuticals, suppliers of branded business services, producers of branded consumer goods, finance, and firms controlling various regulated reticulation networks.
Monopoly rents and profits accruing to IPRs would not matter if the industrial structure in turn distributed those profits to a broad base of workers, or ploughed them back as investment, or saw them captured as tax revenue. To return to the beginning of the article, these profits would then expand some component of C + G + I, leading to growth. The intangibility of IPRs allows firms to pursue strategies that reduce the flow of profit back into consumption, investment, and taxes. Put simply, that IPRs are intangible allows firms to shift the legal ownership of profit into global tax havens in an exaggerated version of the transfer pricing that multinational firms used to use as a tax avoidance strategy. On the industrial organization side, that IPRs can be used to capture monopoly profits from a value chain, and the intangibility of IPRs, allows firms to push physical capital assets and noncore labor outside the legal boundaries of the firm, creating wage inequality. As with tax avoidance strategies, this structure maximizes the return on (now reduced) assets, garnering rewards from financial markets focused on shareholder value. Finally, IPR firms do not need to invest much to expand production because production is contracted out. This produces a situation in which IPR firms retain profits without investing them, and firms that could be doing investment with high multiplier effects both lack the profits to make that investment and correctly fear overcapacity in an era of slow growth.
Tax Avoidance Strategies
The connection between IPRs and tax avoidance—and thence weaker government revenue and spending—is the simplest to limn. Unlike factories, intellectual property rights can be housed anywhere without affecting the final cost of production. The corporate entity that owns these IPRs can be relocated by a parent seeking to avoid taxation. Apple and Coca-Cola provide the best examples of tax avoidance (for general arguments, see Palan, Murphy, and Chavagneux 2013; Altschuler, Shay, and Toder 2015; and Gravelle 2015). Apple is essentially only a producer of intellectual property (IP). It produces only a handful of highly specialized servers internally. Its product is fully intangible: the iOS and the physical design of its products. The intangibility of both of these allows Apple to shift legal ownership of the rights to 40 percent of the revenues generated by that IP to a shell corporation, Apple Sales International. Apple Sales International had no employees until 2013 and is located in Ireland. It is technically the entity that contracts with, for example, Hon Hai for the production of Apple products and licenses Apple’s various operating systems to Hon Hai for installation on those products. Those products are physically produced in China and shipped directly to Apple distributors worldwide. Apple Sales International literally does nothing beyond appending its name to various contracts. It collects massive amounts of revenue from every transaction, however. It attracts no legal tax liability because Apple deliberately structured it in ways that would prevent it from being legally domiciled in either the United States or Ireland for tax purposes (U.S. Senate 2013).
Coca-Cola operates a similar tax avoidance strategy. The formula for Coca-Cola is held by an Irish shell company controlled by Coca-Cola. It is then licensed back to Coke U.S., which produces the physical, flavored syrup that is shipped to franchised bottlers in the United States. These franchisees have slightly more control over their operations than franchised fast food chains in that they can vary how they use their machinery. The result, though, is much the same: the IPR-based profit component of the value chain is segregated legally into a stand-alone firm (and within that firm to a stand-alone daughter firm in a tax haven) to maximize shareholder value and return on assets for that firm. Coca-Cola actually tried to bring production in-house in the 2000s, only to return to its franchising strategy by the end of the decade. This kind of tax evasion and avoidance could not be done as easily if firms were physically producing goods in facilities that were integrated with IP production. Most tax authorities use a substantial presence test that would attach taxation to the value created in that factory, as data generated by Eric Toder (2011) show. Non-IPR multinational firms can and do use transfer pricing to shift revenue into more tax-friendly jurisdictions. But the need for physical proximity to markets or for skilled labor limits the degree of freedom they have in locating production in tax-friendly jurisdictions.
These tax avoidance strategies limit the state’s ability to use the welfare state to ameliorate income disparities or to increase government spending to revive the economy. The ratio of after-tax profit to before-tax profit in the United States was roughly 66 percent in the 1980 to 2000 period but rose by 10 percentage points to roughly 76 percent in the 2001 to 2014 period (FRED n.d.). This is a shift of 3.3 percent of GDP—roughly the typical federal budget deficit—from tax revenues to corporate profits. To the extent that these tax avoidance strategies work best for IPR-rich firms, they also produce some of the inequality of corporate profits and cash holdings noted earlier. The implied tax liability on the $2.1 trillion of unrepatriated profits held offshore by the five hundred largest U.S. firms as of early 2015 equates to an estimated $620 billion (McIntyre, Phillips, and Baxandall 2015). In effect, a second 2010–2011 Obama economic stimulus package worth of untapped revenue sits idle, reducing G, if these funds were spent at once. But these holdings are the product of years of accumulation. Even using a flow measure, the annual amounts are nontrivial: the Congressional Joint Committee on Taxation (Gravelle 2015, 20–21) estimates revenue losses at $85 billion for 2014, which is also the rough midpoint of Gabriel Zucman’s (2015) estimated range of $55 billion to $133 billion for 2013. On a flow basis, $85 billion equals 27 percent of 2014 corporate tax revenues and 17 percent of the 2014 U.S. federal budget deficit.
Structure: Industrial Organization and Income Inequality
Firms with IPRs have also benefited from a change in industrial organization driven by the spread of the shareholder value model since the 1980s. As Alfred Chandler notes, strategy determines (industrial) structure (1990). The shareholder value strategy emphasizes reducing the footprint of labor and physical assets inside a company (Lazonick 2009). Put simply, if what matters to financial markets is return on assets, then dividing a large numerator (monopoly profits) over a small denominator (the costs of labor and physical assets) produces the biggest financial market bang for the buck. Not coincidentally, this approach also allows management to reward itself lavishly as a firm’s market capitalization rises. Financial markets thus press firms to contract out physical-asset-heavy production and contract in or out labor-intensive services when those things are not a core activity for the firm. Both processes concentrate income. Sociologists have long noted that firms tend to harmonize wages inside the firm, a finding confirmed by a recent study of the tax returns of 6 percent of all U.S. employees (Song et al. 2015). Janitors directly employed by highly profitable firms are better paid than janitors working for low-profit firms contracted in by higher profit firms. Concentrated profits and wealth among a few firms lead to concentrated income among people because firms pay out their earnings to a relatively small pool of employees and shareholders. By contrast, firms with large fixed physical asset bases are vulnerable to cyclic downturns, concentrating losses on their owners and workers. Skills-based technical change, an effect complementary to the one described here, accounts for at most one-quarter of rising income inequality (Michaels, Natraj, and Van Reenen 2014).
Studies have shown that rising wage inequality stems from differences in firms’ productivity and profitability. Put simply, the richer firms controlling IPRs pay their (core) workers better, and their management more extravagantly, than firms with a tangible asset profile (Barth et al. 2014). Ja Song and his colleagues used a random sample of 6 percent of all IRS form W2 data and covering 100 percent of U.S. firms (2015, 3).11 Their sample set allowed them to avoid top-coding, imputation, and measurement error because it drew on actual wage payments made by employers. They report that “virtually all of the rise in earnings dispersion [in the United States from 1978 to 2012] between workers is accounted for by increasing dispersion in average wages paid by the employers of these individuals.” The better-paying firms were the ones with higher productivity and thus higher profits. Song and colleagues calculate that individuals in the top 1 percent of income earners typically worked in firms paying about double the average wage (2015).12 Furman and Orszag similarly calculate that about two-thirds of the increase in the income share of the top 1 percent by income in the United States is attributable to increased wages (2015, 3). The dispersion of earnings between firms is consistent with the earlier argument about industrial organization.
As David Weil argues, over the past two decades firms have limited their legal liabilities by shifting noncore labor outside the firm and then contracting that labor back in (2014; see also Autor 2003, 2014; Katz and Krueger 2016). Contracted labor includes not only unskilled labor intensive tasks like janitorial services, but also what might otherwise appear to be core tasks, such as semiskilled assembly line labor. Thus even core automobile assemblers now have substantial numbers of temporary workers on their assembly lines. Weil (2014) shows that the share of workers in some form of contingent or subcontracted employment ranges from one-sixth of the U.S. workforce on a narrow definition (Katz and Krueger 2016), to as much as one-third if employees at fast food and other franchises are included.
Rather than internalizing an occupationally diverse workforce inside the legal boundaries of the firm, U.S. firms now tend to externalize noncore activities as well as direct production. Functionally, this takes the form of sending labor-intensive, loosely coupled work to low-wage zones inside the United States and, perhaps more commonly, developing Asia. Legally, this takes the form of pushing workers out of the firm and then bringing them back in as employees of different firms providing some service to the core firm. It can even take the form of hiring in direct production workers from labor contractors. This outsourcing (and off-shoring) creates firms with more internally homogeneous work forces while creating more interfirm heterogeneity. It also concentrates revenues on the relatively small number of direct employees remaining in the core firms holding IPRs. This structure allows those IPR-holding firms to avoid sharing rents inside the firm with what would otherwise be a more heterogeneous and larger labor force (Abraham and Taylor 1996). A wide range of firms have adopted this structure, but it is most easily accomplished by IPR-heavy firms.
By contrast, the prevailing form of industrial organization fifty years ago tended to equalize wages and produce intrafirm rent sharing. GM and other firms largely designed their product in-house, operated factories to build components and final products, and hired their own cleaners, security, and so on. Indeed, GM reputedly produced 70 percent of its value internally. They of course patented (trademarked) their intellectual property. But their more limited rents from IPR were distributed to the entire workforce because either unions’ or firm’s desires for internal labor peace tended to compress wages (Swenson 1989). Equally, these firms’ oligopoly rents were redistributed both internally (as in France, Germany, and the United States) and often across the entire economy (as in Sweden and Australia), in response to union pressure. The result was slightly underpaid skilled workers, significantly overpaid unskilled workers (because they had access to health and pension benefits), less variance across firms, and thus less income inequality overall. The closest firms to this older model today would be Samsung or Intel, which still retain substantial manufacturing capacity in-house and have high labor headcounts. This older form of internal cross-subsidization tempered income inequality.
Today, labor-light strategies now extend even into the heart of the old physical economy. Led by Toyota and Honda, who in their formative years only produced 20 percent and 30 percent of the value of a car in-house respectively, and who made generous use of contract labor, Japanese carmakers in the United States (and Japan) increasingly staff their assembly lines with contract workers (see, for example, Weisman 2014; Farmer 2015). Contract workers account for about half the line workers at Subaru’s Japanese factories. They account for about 30 percent of labor in Toyota’s Canadian factories and 20 percent in its U.S. factories. Nissan’s factory in Tennessee may have as many as 60 percent of line positions filled by so-called perma-temps. The U.S. auto manufacturers negotiated a similar two-tier workforce with the United Automobile Workers union during the 2008–2010 crisis, though this arrangement is now unraveling.
At the other end of the spectrum, the high-tech world is full of firms that simply do design and then contract out actual physical production to tangible-asset-heavy manufacturers, and the low-tech world of firms controlling brands similarly works on brand management without doing the actual production of services. Apple, as noted, produces virtually no physical objects. But firms such as ARM (cell phone processor chips), Qualcomm (cellphone switching software and chip design), or Nvidia (graphics processors) operate on similar lines, relying on specialist, physical capital-intensive silicon foundries to build their chips. These foundries are major capital investments, semiconductor fabs typically costing between $1 and $5 billion. Samsung’s largest fab cost $10 billion, for example. Finally, the labor-intensive assembly steps are done by specialist assemblers, such as Hon Hai Precision, Flextronics, or Pegatron, using low-wage labor in Asia or Eastern Europe.
This tripartite industrial architecture—high profit human capital-intensive design firms controlling IPRs, moderately profitable but cyclically vulnerable physical capital-intensive production firms, and low-profit labor-intensive assembly or service delivery firms—is replicated over the entire IPR sector regardless of the technology involved. Thus, in the low-tech hotel and hospitality sector, the typical format is a firm that controls the brand name, a variety of real estate investment trusts (REITs) or real estate firms that own the actual buildings, and disposable labor contractors supplying cleaning and front desk staff. For example, the British hotel giant InterContinental owns only eight physical properties, but licenses its brand to (sometimes quite large) firms operating the rest of the almost five thousand hotels bearing its name. Hilton Hotels similarly only owns about 4 percent of the roughly 4,100 properties operating under its collection of brand names. Firms such as LaborReady and Adecco’s Hospitality Staffing Solutions provide labor to hotel operators on demand. Airbnb carries this to an extreme, owning no physical assets whatsoever. In the retail sector, Weil (2014) reports that WalMart’s warehouses—something you might imagine to be a core operation for a gigantic retail firm—are actually operated and supplied by the specialist logistics firm Schneider, which then contracts labor from manpower firms like Premier Warehousing Ventures.
Finally, the entire franchise economy also has this structure. In a typical fast-food franchise, the franchisor will supply machinery (built by a different physical-asset-heavy firm), menus, branding, and detailed instructions on food preparation and presentation. Many also supply some start-up capital for franchisees in the form of loans. (McDonald’s also usually buys the real estate on which the franchisee’s restaurant sits and then rents that to the franchisee.) Franchisors also typically dictate prices to franchisees. The franchisor thus controls virtually all aspects of the operation of the restaurant, and generates profit from everything that goes into the restaurant. The only cost the franchisee typically controls is staffing and wages. The income dynamics here are easy to understand. Franchisees have every incentive to depress wages and hyperexploit their workers to maximize their own profit, and franchisors are able to extract maximum revenue from their tied franchisee clients.
Table 5 presents this three-tier industrial structure via comparisons of employee head count, profits, and profit per employee for some of the firms involved in production of the iPhone, using average revenues, profits and employee headcounts for the 2010–2014 period to even out some of the effects of the recession. The firms chosen are the two producers of the most expensive physical components, the major assemblers, and the largest suppliers of intellectual property. From the typical $630 sale price of an iPhone6, Apple collects $367 in gross revenue (and $319 in net revenue), Samsung collects $65 for the processor and memory, Toshiba collects $37 for the display, Qualcomm collects $15 for the WLAN and cellular software, and Foxconn collects $15 for assembly, according to the technology research firm iSuppli (see also Kraemer, Linden, and Dedrick 2011). Qualcomm’s outsized returns in table 5 reflect royalties on the core software connecting handsets to the cellular network; Qualcomm collects money on virtually every handset sold globally, not just Apple products.
Representative Firms Involved in Production of Apple iPhones, 2010-2014
It could be argued that the end of internal cross-subsidization present in this new three-tier structure simply reflects a deeper and more efficient division of labor enabled by new information technologies that allow for better monitoring of performance across firm boundaries. But this argument actually supports the points cited. If this deeper division of labor is more efficient, why has growth faltered rather than revived as four decades of change in industrial organization removed damaging internal cross-subsidies? Moreover, our main point is precisely that the removal of internal cross-subsidies concentrates income into lower-headcount firms that capture monopoly rents via IPRs. Finally, better monitoring of performance and in particular labor performance across firm boundaries suggests that brand owners and franchisors are de facto the employer of those workers. Their de jure distance obviates the need to share part of the rent with those workers. So arguments about a technologically enabled division of labor simply “avert their eyes” from the macroeconomic consequences of that new form of industrial organization, and the way in which that form of organization is rooted in legal rather than functional realities.
Investment, IPRS, and Slow Growth
Finally, this new three-tier industrial organization also inhibits net new investment two ways. The human-capital intensive IPR-based firms that accumulate the most profits have the least incentive or need to invest them productively to expand production. The physical-capital intensive firms that need increased investment to expand production face macro- and microeconomic disincentives to invest.
Human capital-intensive firms based on IPRs have no incentive or need to recycle profits as significant new productive investments. They do need to recycle profit to develop new products and improve old ones, and indeed a major strategy for these firms is the creation of rapid emotional or functional obsolescence, as with Apple’s series of iPhones. But this requires relatively little spending in comparison with firms making physical products. Expanding the output of software, screenable media, or even many pharmaceuticals does not require massive investment in a new plant. Most pharmaceutical plants run at about one-third of capacity in comparison with automobile factories (McKinsey Global Institute 2012, 54), and producing an additional unit of a program or MP3 file costs nothing. Developing new drugs does entail large fixed up-front costs, but the pharmaceutical industry spent more on mergers and acquisitions than on new drug development over the past eighteen years, suggesting that profits are not being invested in new productive capacity. In either case, most of the cost of new investment for IPR firms is hiring additional workers. Even if this adds to employment, the multiplier effects are weak. These workers are largely concentrated in a few locations, and the additional wages flow into competition over positional goods and especially real estate.
The incentive to invest more is also weak. First, intangible assets do not physically depreciate via production, so to spend money replacing them is pointless. Equally, expanding output does not require more machinery or plants. In contrast to the old physical economy, this reduces gross investment and possibly net investment. Second, by definition, a monopoly prevents competitive entry and thus weakens the pressure to invest in more productive capacity. IPR firms use their thicket of patent and copyright to deter entry (Bessen, Meurer, and Ford 2011). Wendy Schacht reports that patents significantly raise the costs incurred by non–patent holders wishing to use the idea or invent around the patent by an estimated 40 percent for pharmaceuticals, 30 percent for major new chemical products, 25 percent for typical chemical goods, and roughly 7 percent to 15 percent for electronics (2006, 5–6). The rational business strategy is to milk the revenue stream from an IPR as long as possible, making the occasional incremental investment to ward off potential competitors. Finally, the clearest evidence that the major IPR-based firms abjure new investment is the piles of cash noted earlier. If they needed to spend it, they would be doing so.
By contrast, physical-capital intensive firms do need to replace physically depreciating equipment, and should need to expand plants to meet rising demand. Yet these firms also invest less than they might. Why? First, in general they have been historically reluctant to risk creating excess capacity. One reason for the robust investment growth of the postwar era was the reassuring stability of demand growth, which allowed for easy planning and validation of new investment. In today’s slow growth environment, the normal productivity creep of 2 to 3 percent is often enough to handle increased demand in the rich economies. Second, one of the major reasons for adopting new ITC technologies and automation is that doing so permits less-costly replacement of depreciating capital and faster turnover of new capital. From a profitability standpoint, this helps lower the denominator in the return on assets equation. But it does not increase aggregate demand to the degree that building older, dumber facilities did in the past. Although faster utilization of capital implies more demand at some point in the future, individual firms both live in the present and cannot count on this demand.
The clearest evidence of the degree to which physical-capital intensive firms have more difficulty accumulating investment funds is to contrast two best-in-class firms. Toyota’s $35 billion cash reserve was built up over the four decades in which it was the benchmark for the automobile industry. Apple’s $178 billion cash reserve accumulated in less than a decade, a pace roughly sixteen times faster.
The argument here is not that the three-tier industrial structure prevents all investment. The main point is that it reduces new net investment and thus slows growth. Slower growth in turn inhibits net new investment, much as John Maynard Keynes argued eighty years ago.
POLICY IMPLICATIONS
A recent OECD study reports that the two point increase in the Gini index in the nineteen rich OECD countries, 1985 to 2005, shaved 4.7 percentage points off cumulative growth, 1990 to 2010 (2015b). That translates to $2 trillion in lost GDP per year in the OECD. This article argues that part of this rising inequality and slower growth can be attributed to the combined effects of changes in corporate strategy and structure. A minority of firms with strong IPRs is able to extract large rents from the economy, and the shift to a three-tier industrial structure prevents the redistribution of those rents into the broader economy. The concentration of large profits into fewer firms and hands increases income inequality. The lower marginal propensity of high-income firms to invest and high-income individuals to consume reduces growth in aggregate demand. This macroeconomic focus helps us understand the limits on purely individual strategies of wealth accumulation analyzed in the other papers in this issue, given that most U.S. wealth is largely corporate debt and equities whose long-term values are tied to U.S. and global growth rates.
What policy responses are possible? The most obvious are to use tax policy to redistribute income to the bottom 80 percent so that postmarket incomes are more equal; to modify patent protection so that premarket incomes are not as unequal among firms and people; to change the relationship between lead firms and their subcontractors and franchisees so that lead firms bear some responsibility for labor conditions and wages in firms technically outside their legal boundaries but functionally inside given the degree of control that lead firms exercise; to thoroughly squash tax havens so that income accruing to intangibles cannot be domiciled in some mysterious space free of taxation; and to aggressively use antitrust policy to prevent incumbents from preemptively buying up potential or existing rivals.
The central policy should aim to weaken monopoly power in the dynamic markets generating growth. Changes in tax policy and welfare spending aimed at individuals help remedy the postmarket distribution of income. But to the extent that wealth inequality arises from industrial organization and IPRs then policy interventions also need to change the premarket inequality of income among firms. For example, patent and copyright duration could be shortened and the hurdle for patent approval increased to reduce firms’ ability to use a thicket of patents to deter competitive entry by other firms. Federal government prizes could replace patents as an incentive toward discovery, such as the robotics challenges of the Defense Advanced Research Projects Agency (Baker 2008).
These policies work with the market to reduce corporate concentration of income, and by doing so should speed up growth, which has positive consequences for employment. Slowing or reversing the concentration of corporate income helps reduce individual income inequality in the short and long term. In Alice Corp vs CLS Bank International, the Supreme Court has taken one step by imposing stricter criteria for issuing a patent. It remains to be seen, however, whether the U.S. Patent and Trademark Office follows through. Currently, it is moving only hesitantly toward new processes and standards while it awaits political signals from the administration or a clearer set of guidelines from the courts (interview with the author).
With respect to the new three-tier industrial structure, labor law should make lead employers legally joint employers with their franchisees and labor subcontractors. As with patents, this process has begun. In a recent decision (Browning-Ferris), the National Labor Relations Board ruled that two entities are joint employers “if they share or codetermine those matters governing the essential terms and conditions of employment” which includes “hiring, firing, discipline, supervision, and direction,” as well as “wages and hours,” “the number of workers to be supplied, controlling scheduling, seniority, and overtime, and assigning work and determining the manner and method of work performance.” The NLRB said that even if this coordination was not done “directly and immediately,” it was enough if control “affects the means or manner of employees’ work and terms of employment, either directly or through an intermediary.” This test is still a fairly strict one but again only a first step toward reform. The U.S. business community is already mobilizing to reverse the decision. As with the make-up of the Supreme Court, much rests on the outcome of the 2016 election because a new president will have the opportunity to appoint successors to the wave of board members appointed by President Obama in 2013.
Finally, the recent disclosures of widespread individual tax avoidance in the Panama Papers (Mossack Fonseca scandal) and the obviousness of corporate tax avoidance through corporate inversions have led the Obama administration to rewrite regulations to deter inversions, to use antitrust investigations to deter consolidation, and to open a conversation on tax havens.
Secular stagnation and wealth inequality are not the outcome of blind technological or demographic forces over which we have no control. Wealth inequality starts with firms. Wealth inequality results in part—perhaps a large part—from the current structure of property rights, which creates monopoly profits and larger market capitalization for a select group of firms. Those profits create firm-level inequality in profits that in turn creates individual income inequality. This concentration is partly responsible for secular stagnation, given the low marginal propensity of rich firms to invest and the lower marginal propensity of rich households to consume. The quantity and quality of IPRs are political outcomes and thus can be changed in ways that increase aggregate demand. Doing so would benefit both the economy as an abstract entity, which would make economists happier, and people, which would make them happier.
Acknowledgments
The author would like to thank John Echeverri-Gent, Lindsay Flynn, Ronen Palan, Bent Sofus Tranøy, and the anonymous reviewers for comment and criticism. Earlier versions presented at the Russell Sage Foundation, the University of North Carolina, Harvard University, the University of Virginia Batten School of Public Policy, and Yale-National University of Singapore also benefited from audience comments and questions. Responsibility remains with the author, however.
FOOTNOTES
↵1. Conservative parties account for the majority of cabinet years in the rich OECD countries after 2008.
↵2. The countries are the United States, Canada, Japan, Korea, Britain, Ireland, France, Germany, Italy, Austria, Spain, Portugal, Switzerland, Netherlands, Belgium, Denmark, Finland, Norway, Sweden, Luxembourg, Australia, and New Zealand.
↵3. Schumpeter’s circular flow economy thus differs from the Ricardian stationary economy in its assumption that some incremental innovation occurs.
↵4. Serial entrepreneur (PayPal, Palantir) Peter Thiel (2014) recently popularized this argument in Zero to One.
↵5. McKinsey authors analyzed all global firms with annual revenues over $200 million, a bit more than twenty-eight thousand in total (Dobbs et al. 2015).
↵6. Firms could increase their cash holdings by borrowing and then holding cash, but aside from this being economically irrational when it is above the level needed to finance ongoing operations, the net debt to equity ratio for the nonfinancial U.S. S&P 500 has fallen by two-thirds over the past twenty years (Compustat).
↵7. Not all firms in the Forbes Global 2000 have positive profits. Given that the Gini index does not work well with negative numbers, I opted to simply truncate the data series for each year of the Global 2000 at the Nth firm before firms had negative profits. Alternately, I could have simply bottom coded all firms making losses as 0. This latter technique is the one that the Luxembourg Income Study uses when dealing with negative household incomes. However, the former technique lowers the final Gini coefficient and thus provides a more conservative estimate of inequality among firms. Thanks to Lindsay Flynn and Annie Rorem for discussions about this issue.
↵8. NACE (nomenclature statistique des activités économiques dans la communauté européenne) is the standard industrial classification scheme for the European Union (see Eurostat 2008).
↵9. See the Center for Responsive Politics, http://www.opensecrets.org (accessed May 23, 2016).
↵10. Economists traditionally argue that these monopolies are necessary to provide incentives for innovation (for arguments about the weak links between patents and innovation, see Boldrin and Levine 2008; Boyle 2008; Baker 2008).
↵11. IRS Form W2 is the employer’s report of wages and benefits paid to a specific individual in a given tax year. This information is transmitted to both the individual (to accurately prepare a tax filing) and the tax authorities (to prevent misreporting and underreporting).
↵12. Lawrence Mishel (2015) has criticized some of the Song and colleagues (2015) findings on the basis that there has been no increasing dispersion of wages between top employees and average employees in general, but he does not dispute the finding of interfirm dispersion, which is mostly what concerns us.
- Copyright © 2016 by Russell Sage Foundation. All rights reserved. Printed in the United States of America. No part of this publication may be reproduced, stored in a retrieval system, or transmitted in any form or by any means, electronic, mechanical, photocopying, recording, or otherwise, without the prior written permission of the publisher. Reproduction by the United States Government in whole or in part is permitted for any purpose. The author would like to thank John Echeverri-Gent, Lindsay Flynn, Ronen Palan, Bent Sofus Tranøy, and the anonymous reviewers for comment and criticism. Earlier versions presented at the Russell Sage Foundation, the University of North Carolina, Harvard University, the University of Virginia Batten School of Public Policy, and Yale-National University of Singapore also benefited from audience comments and questions. Responsibility remains with the author, however. Direct correspondence to: Herman Mark Schwartz at schwartz{at}virginia.edu, Politics Department, University of Virginia, PO Box 400787, Charlottesville VA 22904.
Open Access Policy: RSF: The Russell Sage Foundation Journal of the Social Sciences is an open access journal. This article is published under a Creative Commons Attribution-NonCommercial-NoDerivs 3.0 Unported License.
In this issue


Jump to section
Related Articles
Cited By...
- No citing articles found.