
Article Figures & Data
Figures
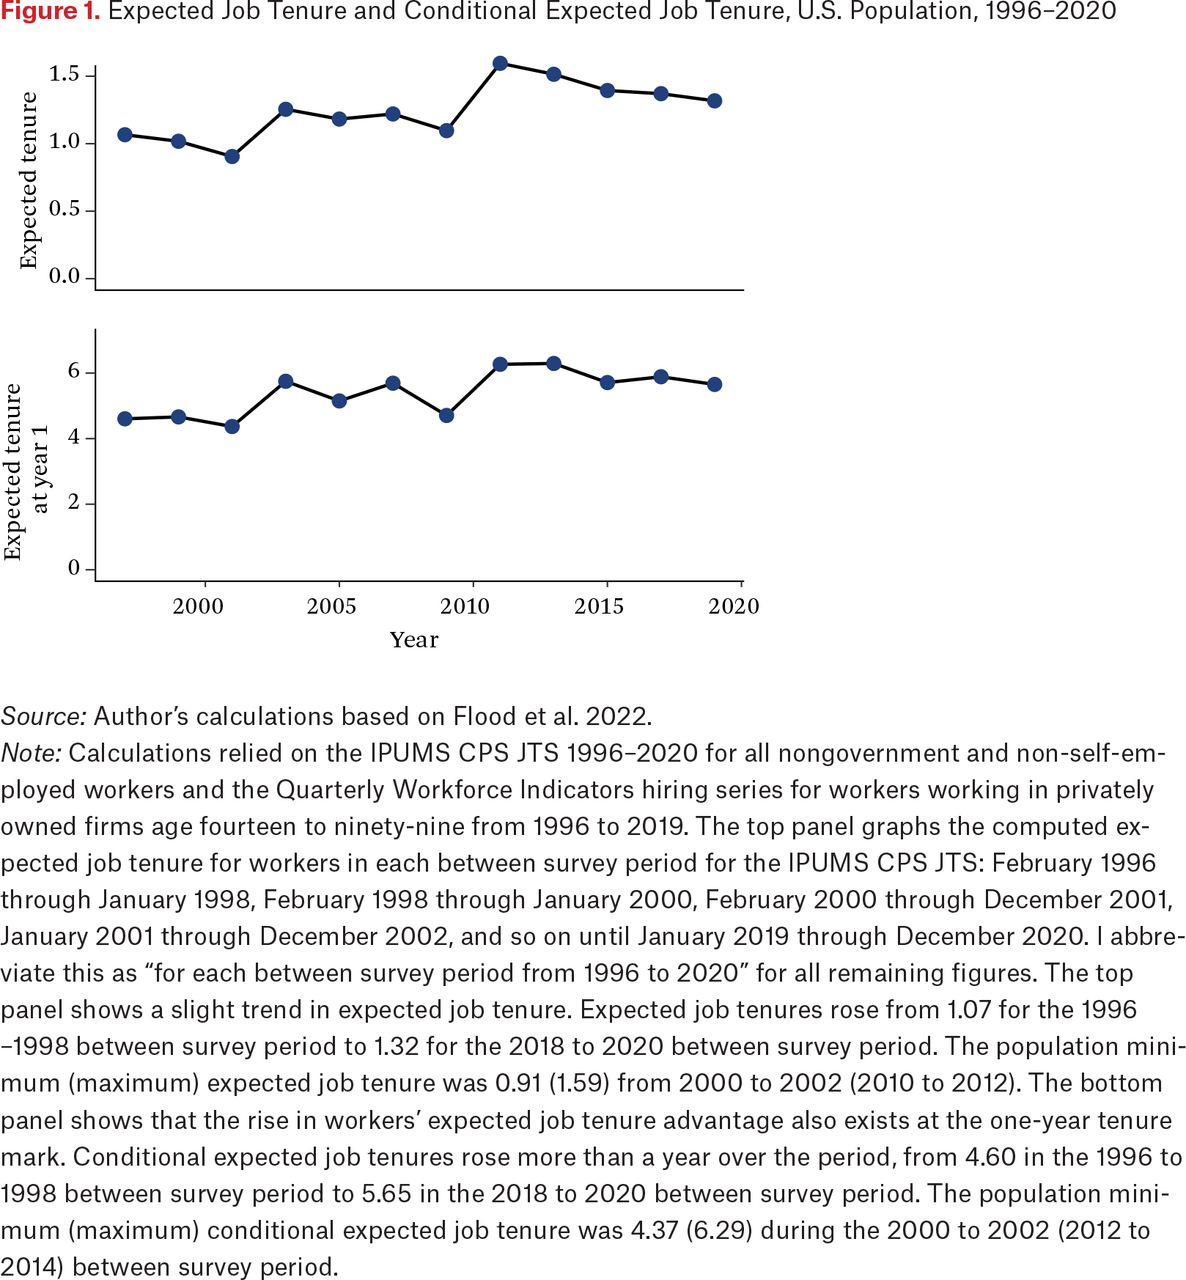
- Figure 1.
Expected Job Tenure and Conditional Expected Job Tenure, U.S. Population, 1996–2020
Source: Author’s calculations based on Flood et al. 2022.
Note: Calculations relied on the IPUMS CPS JTS 1996–2020 for all nongovernment and non-self-employed workers and the Quarterly Workforce Indicators hiring series for workers working in privately owned firms age fourteen to ninety-nine from 1996 to 2019. The top panel graphs the computed expected job tenure for workers in each between survey period for the IPUMS CPS JTS: February 1996 through January 1998, February 1998 through January 2000, February 2000 through December 2001, January 2001 through December 2002, and so on until January 2019 through December 2020. I abbreviate this as “for each between survey period from 1996 to 2020” for all remaining figures. The top panel shows a slight trend in expected job tenure. Expected job tenures rose from 1.07 for the 1996 –1998 between survey period to 1.32 for the 2018 to 2020 between survey period. The population minimum (maximum) expected job tenure was 0.91 (1.59) from 2000 to 2002 (2010 to 2012). The bottom panel shows that the rise in workers’ expected job tenure advantage also exists at the one-year tenure mark. Conditional expected job tenures rose more than a year over the period, from 4.60 in the 1996 to 1998 between survey period to 5.65 in the 2018 to 2020 between survey period. The population minimum (maximum) conditional expected job tenure was 4.37 (6.29) during the 2000 to 2002 (2012 to 2014) between survey period.
- Figure 2.
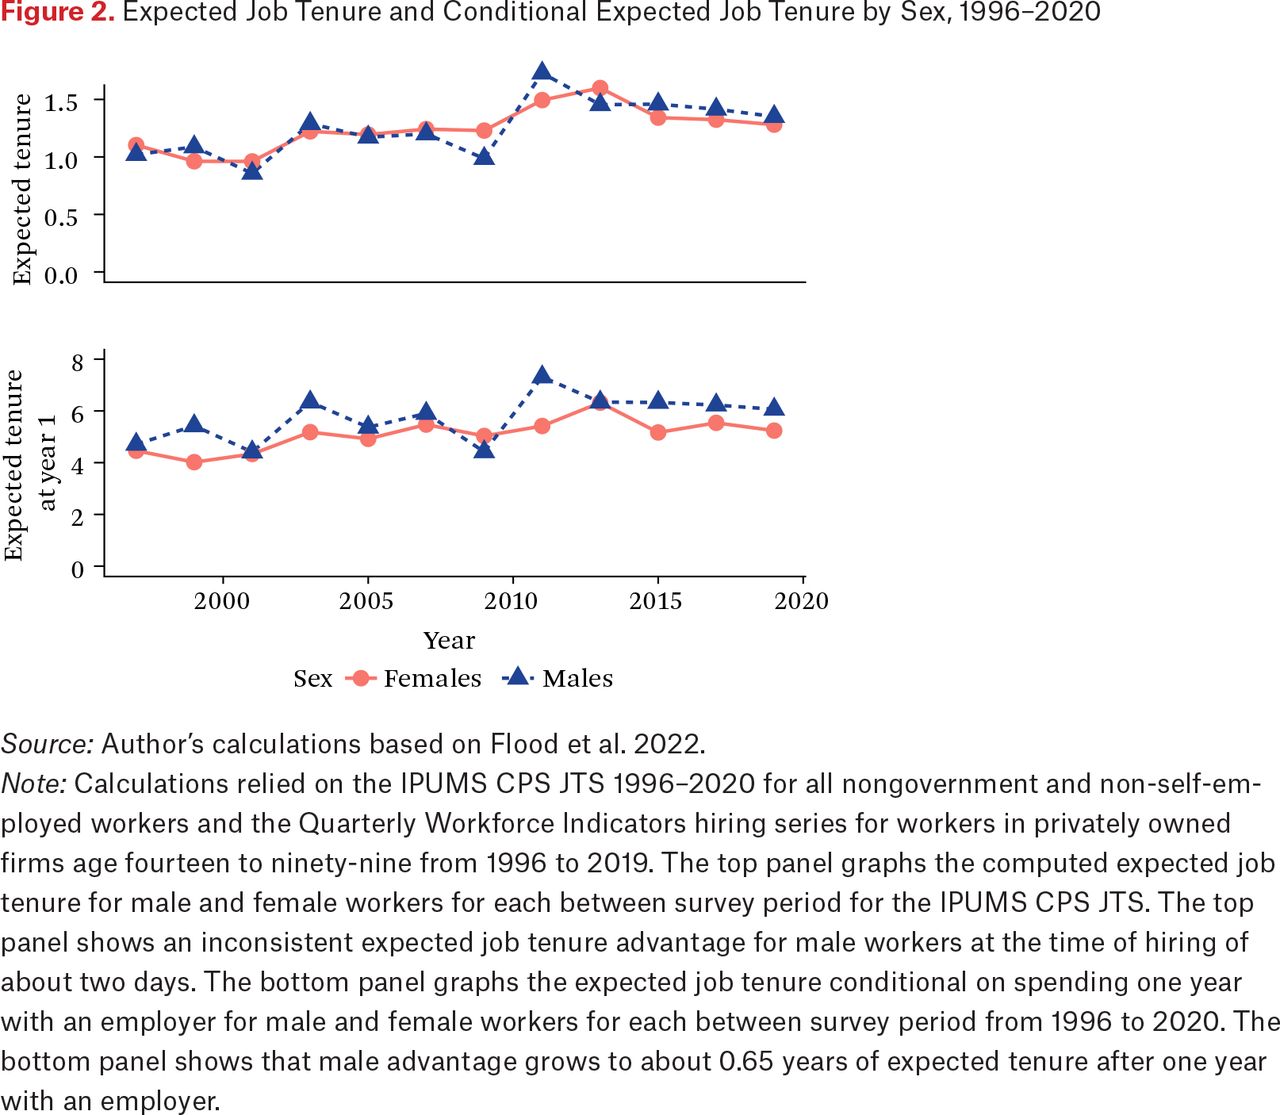
Expected Job Tenure and Conditional Expected Job Tenure by Sex, 1996–2020
Source: Author’s calculations based on Flood et al. 2022.
Note: Calculations relied on the IPUMS CPS JTS 1996–2020 for all nongovernment and non-self-employed workers and the Quarterly Workforce Indicators hiring series for workers in privately owned firms age fourteen to ninety-nine from 1996 to 2019. The top panel graphs the computed expected job tenure for male and female workers for each between survey period for the IPUMS CPS JTS. The top panel shows an inconsistent expected job tenure advantage for male workers at the time of hiring of about two days. The bottom panel graphs the expected job tenure conditional on spending one year with an employer for male and female workers for each between survey period from 1996 to 2020. The bottom panel shows that male advantage grows to about 0.65 years of expected tenure after one year with an employer.
- Figure 3.
Expected Job Tenure and Conditional Expected Job tenure by Race, 1996–2020
Source: Author’s calculations based on Flood et al. 2022.
Note: Calculations relied on the IPUMS CPS JTS 1996–2020 for all nongovernment and non-self-employed workers and the Quarterly Workforce Indicators hiring series for black and white workers age fourteen to ninety-nine from 1996 to 2019. Shown are the computed expected job tenure for black and white workers for each between survey period from 1996 to 2020. The top panel shows a consistent expected job tenure advantage for white workers at the time of hiring. The mean period size of the expected duration advantage at hiring is 0.43 years or about five months. The bottom panel shows that white workers’ expected job tenure advantage becomes less consistent at the one-year tenure mark. Black workers have substantial advantages in expected job tenure conditional on making it to one year in 2011 and 2015. White workers’ mean period expected job tenure advantage at the one-year mark is about 0.22 years (smaller than the equivalent male advantage of 0.65 years).
- Figure 4.
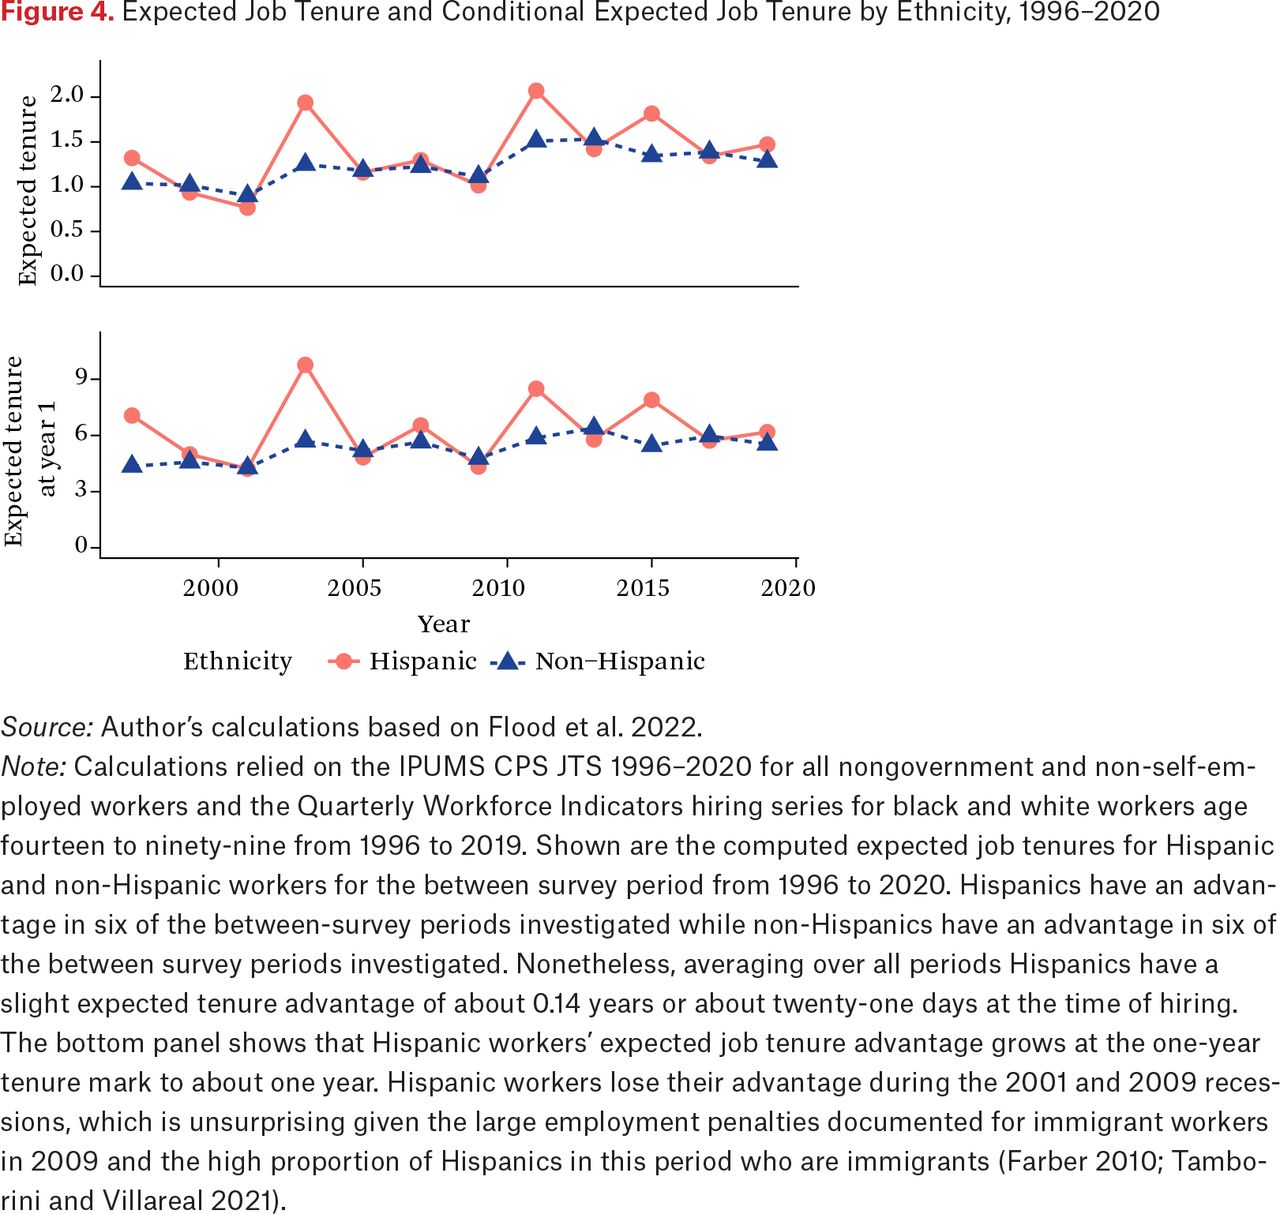
Expected Job Tenure and Conditional Expected Job Tenure by Ethnicity, 1996–2020
Source: Author’s calculations based on Flood et al. 2022.
Note: Calculations relied on the IPUMS CPS JTS 1996–2020 for all nongovernment and non-self-employed workers and the Quarterly Workforce Indicators hiring series for black and white workers age fourteen to ninety-nine from 1996 to 2019. Shown are the computed expected job tenures for Hispanic and non-Hispanic workers for the between survey period from 1996 to 2020. Hispanics have an advantage in six of the between-survey periods investigated while non-Hispanics have an advantage in six of the between survey periods investigated. Nonetheless, averaging over all periods Hispanics have a slight expected tenure advantage of about 0.14 years or about twenty-one days at the time of hiring. The bottom panel shows that Hispanic workers’ expected job tenure advantage grows at the one-year tenure mark to about one year. Hispanic workers lose their advantage during the 2001 and 2009 recessions, which is unsurprising given the large employment penalties documented for immigrant workers in 2009 and the high proportion of Hispanics in this period who are immigrants (Farber 2010; Tamborini and Villareal 2021).


Tables

Appendix
Appendix
Files in this Data Supplement:
- Adobe PDF - Lachanski_Online_Appendix.pdf - Appendix
In this issue


Jump to section
Related Articles
Cited By...
- No citing articles found.