
Abstract
How have inequalities in job stability evolved in the twenty-first century between demographic groups? I compute expected job tenures, akin to life expectancy in demographic research, for the population as a whole and by subgroups defined by selected ascribed characteristics (sex, race, and ethnicity) over biennial periods from 1996 to 2020. Racialized inequalities at hiring were the most persistent and large: white workers maintained an expected job tenure advantage at hiring relative to black workers in all periods. Inequalities in expected job tenure by sex were minimal at the time of hiring, but a male advantage emerges at the one-year mark in most periods. Hispanic workers maintained large advantages in expected job tenure relative to non-Hispanic workers in some periods and small disadvantages in others.
How has job stability by ascribed characteristics like sex, race, and ethnicity evolved over time? Wages and duration are the key attributes of a job, but the considerable literature on wage inequalities in the U.S. private sector over the last three decades has been accompanied by only a handful of articles tackling the evolution of employment duration inequalities (Diebold, Neumark, and Polsky 1997, 206; Farber 2010; Hollister 2011; Hollister and Smith 2014; Baum 2022; Molloy, Smith, and Wozniak 2024, 36). This article adopts David Neumark’s (2000, 1) definition of job stability as the expected duration of jobs, that is, the expected job tenure with a current employer. The main contribution is to operationalize this notion using formal demographic methods. These methods yield the expected job tenure, along with two related summary measures, for both the overall population and specific subgroups: men, women, blacks, whites, Hispanics, and non-Hispanics. I subsequently visualize how these summary measures evolved over the last quarter century to track continuity and changes in private-sector job stability within and between these groups.1
Population-level trends in private-sector job stability are important for several reasons. First, job stability proxies for related concepts such as income security, job security, and employment stability (Swinnerton and Wial 1995, 304; Alderotti et al. 2021; Molloy, Smith, and Wozniak 2024, 36).2 Second, researchers believe that workers prefer more stable employment arrangements (Bidwell 2013). From these two premises it follows that falling job stability is suggestive of declining job security, rising employment instability, declining income security, and falling worker power relative to their employers. Third, the fraction of workers with long tenures in equilibrium has substantial macroeconomic consequences (Hall 1982). Economistic theories of employment search and matching typically suggest that better employer-employee (employment relationship) matches lead to longer lasting jobs, all else equal. Higher job stability can reflect new efficiencies in how workers and employers meet (Autor 2001; Kroft and Pope 2014; Pries and Rogerson 2022). Fourth, in the last few decades, evidence has accumulated that declining job stability contributes to declining fertility (Oppenheimer 1988; Karabchuk 2020; Alderotti et al. 2021; Clark and Lepinteur 2022). Finally, economic sociologists believe that job stability sheds light on how labor markets are organized. Workers in more coordinated and social democratic systems, such as in Germany, France, and Belgium, are expected to have longer expected job tenures. Market-oriented and liberal systems such as the United States, Canada, and Ireland, on the other hand, are expected to yield shorter ones (Hall and Soskice 2001; Witt and Jackson 2016; Roberts and Kwon 2017; St-Denis and Hollister 2023, 21).
Group differences in job stability provide special insight into the structure of labor-market inequalities beyond pecuniary remuneration for several reasons (Diebold, Neumark, and Polsky 1997; Pries and Rogerson 2022; Molloy, Smith, and Wozniak 2024). First, searching for employment is costly. Low job stability for a group sheds light on otherwise hidden costs of labor-market participation borne by that group (Wilson 1987, 1996; Jargowsky 1997). Second, better employer-employee matches and more relative worker power should yield greater job stability (Bidwell 2013; Molloy, Smith, and Wozniak 2024, 36). Persistent advantages in job stability for a group point to either elevated worker power or a superior matching process for that group. Third, recent research has advanced the masked instability hypothesis, claiming that increasing population-level job instability is masked by women’s greater labor-force attachment (St-Denis and Hollister 2023). Women who would have previously left their employment relationships shortly after marrying young in previous generations now delay marriage and childbirth, sometimes indefinitely, and tend to maintain their employment relationships even after marriage and childbirth (Hollister and Smith 2014). Increasing female job stability potentially offsets declines in male job stability. Taking the literature on North American job instability seriously requires examining trends separately by sex (St-Denis and Hollister 2023, 19).3
Despite a wave of research in the 1990s concerned with the evolution of job stability for the population as a whole and by sociodemographic group, and continued general interest in the topic, Matissa Hollister (2011, 314) reports that research on “employment instability . . . lost its momentum” prior to the Great Recession. As a result of both changing methods and researchers’ choices of topics, researchers know little about the evolution of job stability in the United States for different demographic groups in the twenty-first century. I am not aware of any research since Hollister (2011) describing the evolution of the employment duration distribution by race or ethnicity before and after the Great Recession (Molloy, Smith, and Wozniak 2024; Baum 2022; Pries and Rogerson 2022; Hyatt and Spletzer 2017, 2016; Hollister and Smith 2014). Using novel administrative hiring records and new methods adapted from formal demography, I fill this gap in this article. Specifically, I point estimate parameters of period tenure table models for the U.S. population overall, by sex, and for selected racial and ethnic groups from 1996 to 2020. A tenure table does for the length of a job what a life table does for the length of a human life; it summarizes how long an employer-employee relationship will last at current rates of decrement under synthetic vintage assumptions (Silcock 1954; Stewman 1988; Lachanski 2023). The objective of this article is to use tenure table model estimates to explore trends in job stability for the population overall and inequalities in job stability by ascriptive characteristics.
BACKGROUND
Early research on U.S. job stability focused on measurement debates around the distribution of the length of employment relationships (Hall 1982; Ureta 1992).4 A second wave of research, summarized in Neumark (2000), focused on population trends and the evolution of differentials from the 1980s to the 1990s (Hollister 2011). A new wave of research in the wake of the Great Recession has documented how job tenures have evolved in the twenty-first century (Hollister and Smith 2014; Hyatt and Spletzer 2016, 2017; Pries and Rogerson 2022; Molloy, Smith, and Wozniak 2024). I review the second and most recent waves of research on population-level trends followed by the more limited research on group differences. Then I discuss the theoretical frameworks social scientists have proposed to summarize trends in the tenure distribution as well as measurement issues.
Researchers in the 1990s became increasingly concerned that job stability was falling over time and that long-term employment was disappearing. Francis Diebold, David Neumark, and Daniel Polsky (1997) and Neumark, Polsky, and David Hansen (1999) document considerable group heterogeneity in both the level and change in job separation rates from the 1980s to the mid-1990s, but only small declines in job stability for the overall working population. For instance, Diebold, Neumark, and Polsky (1997) report that blacks have greater tenure-specific probabilities of job survival than whites in the 1980s and early 1990s whereas Neumark, Polsky, and Hansen (1999, S58) find that “blacks have experienced the strongest declines in job stability, with rather pronounced declines among more tenured workers and in the aggregate” over the period from 1983 to 1995. They also find “evidence of more recent declines in job stability . . . more so for blacks and men than for women.” Overall, this line of research documents that black workers’ job stability was declining both in absolute terms and relative to whites from the 1980s through the 1990s. Over the same period, male workers’ job stability was declining both in absolute terms and relative to females. Hollister and Kristin Smith (2014) argue that male and single women’s population job tenures have continued to decline into the Great Recession, but that married women’s job tenures since the 1980s increased, yielding only small changes in the population’s mean tenure.
An area of consensus is that private-sector long-term employment relationships have declined for men since the 1970s (Farber 2010; Hollister and Smith 2014; Hyatt and Spletzer 2016; Molloy, Smith, and Wozniak, 2024). Neumark, Polsky, and Hansen (1999, S58) report declines in job retention “especially for older, more tenured workers” but argued that this did not constitute a secular trend. Katherine Stone (2013) reports that population-level stability in contingent work has concealed a growing prevalence of short-term work in the older population. A comparative study by Ryo Kambayashi and Takao Kato (2017, 364–67) indicates that, from 1982 to 2007, the protective effect of seniority in Japan against job loss for men remained stable while declining in the United States. Recent work by Raven Molloy, Christopher Smith, and Abigail Wozniak (2024) finds that mid-career separations for male workers have increased since the 1970s.
More recent research finds that, in the twenty-first century, jobs with short tenures make up a smaller fraction of the labor force than in the previous century (Hyatt and Spletzer 2016, 2017). Henry Hyatt and James Spletzer (2016, 370) argue that fluctuations in hiring over time can explain these trends. Michael Pries and Richard Rogerson (2022, 267–68) point out that job separation hazard, especially for employment relationships with less than six months of tenure, has also declined substantially.
Trends in Job Stability: Theory and Measurement
Three social forces, neither mutually exclusive nor collectively exhaustive, have been found to influence trends in job stability. The first is the tendency for managers to adopt practices and technologies leading to “greater numerical flexibility” in the number of workers employed starting in the late 1970s (St-Denis and Hollister 2023, 2; Cappelli 1999; Farber 2010; Hollister and Smith 2014). The gig economy, deunionization, outsourcing, increasing firm power, and automation-driven labor market disruption are all contributors to this ongoing “flexibilization” (Kalleberg 2009; Bidwell 2013; St-Denis and Hollister 2023). Researchers arguing for the centrality of flexibilization posit that small changes in job stability at the national level conceal larger offsetting trends for U.S. subpopulations. Job stability for single women and private-sector males has declined, but public-sector long-term employment remains robust and married women have become increasingly likely to remain with their employer after marriage and childbirth (Farber 2010; Hollister and Smith 2014). Drivers of the increase in female labor-force attachment include: the passage of the Family Medical Leave Act in 1993 “mandating 12 weeks of unpaid leave at the time of a birth, adoption, or to care for an ill family member” (Hollister and Smith 2014, 163) and increasing finetuning of fertility (Goldin and Katz 2002). Together, the stability of public-sector employment and married women’s increasing labor-force attachment mask instability at the population level. These researchers agree that population-level flexibilization and increasing labor-force attachment of (especially married) women have closed sex gaps in the realized tenure distribution, but they do not usually make clear predictions about the evolution of other group inequalities or male-female inequalities after the Great Recession (Hollister and Smith 2014; St-Denis and Hollister 2023). The strongest evidence supporting the central role of flexibilization remains the decline in long-term employment relationships for men since the 1970s (St-Denis and Hollister 2023).
A second perspective, first proposed by David Autor (2001, 1), points out that improving workforce analytics technologies should (eventually) lead to superior employer-employee matches over time. Economists expect superior matches to last longer on average (Pries and Rogerson 2022; Molloy, Smith, and Wozniak 2024). Screening increases the quality of each hire, potentially resulting in fewer but longer lasting hires (Pries and Rogerson 2022, 265). This perspective has considerable support from macroeconomic modeling exercises based on administrative datasets of U.S. employee job tenures, which have found falling job separation hazards since the late 1990s. Microlevel evidence from firms that adopt screening technologies also supports this perspective (Pries and Rogerson 2022; Autor and Scarborough 2008).
A third perspective centers labor-market dynamism as the key determinant of mean job tenure over time (Hyatt and Spletzer 2016; St-Denis and Hollister 2023). The concept of labor-market dynamism encompasses a variety of phenomena, including the creation and closure of firms, as well as changes within firms such as the development of new job positions and the obsolescence of existing ones. A long literature links these aspects of dynamism to greater job mobility and therefore less job stability (Haveman and Cohen 1994). Greater dynamism, potentially arising from higher levels of innovation or the economy nearing full employment, would tend to reduce job stability (Silcock 1954; St-Denis and Hollister 2023). Hyatt and Spletzer (2016, 365) hypothesize that population aging and declining U.S. innovation is leading to fewer new job openings and less reallocation of workers between firms. Together, these changes reduce labor-market dynamism and thus increase job stability. Screening reduces job separation hazards mainly at low tenures whereas declining labor market dynamism would tend to affect job separation hazards over the entire tenure distribution (Pries and Rogerson 2022). Hyatt and Spletzer argue that the overall distribution of tenure lengths has shifted right, suggesting a substantial role for declining business dynamism.
Although accounts emphasizing screening and secular declines in dynamism predict an increase in the length of expected job tenure at the population level over time, there is no obvious reason for either of these social forces to alter group differences in the job tenure distribution over the period studied. The limited empirical evidence available suggests a kind of neutrality in the effects of screening across groups. In a case study, Autor and David Scarborough (2008) find that new workforce analytics technology increased job tenures for black and white workers but had no significant impact on the difference in eventual tenures for black and white workers. Little research relates group differences in expected job tenures to labor market dynamism.
Recent research tends to investigate the realized distribution of job tenures at a given point in time using pooled cross-sections, modeling changes in the median or mean using time fixed effects (Ureta 1992; Neumark, Polsky, and Hansen 1999; Farber 1998, 2000, 2010). A problem with this population regression approach is that the cross-sectional distribution of tenure is affected as much by the history of new hires as by job separation conditions (Molloy, Smith, and Wozniak 2024, 57–61). A regression analysis with mean job tenure from repeated cross-sections on the left side and explanatory variables on the right side will confound changes in hiring and changes in job separations over time. For instance, a decline in hiring for a group will increase that group’s mean job tenure even if job separation conditions remain the same. Charles Baum (2022, 543) summarizes the weaknesses of the snapshot approach for understanding the distribution of the length of employment relationships, writing that “inferring tenure duration from active spells using median or average years of service for a company is akin to projecting life expectancy using the population’s current median age. An average population age of, say, 40 years, would tell us little about life expectancy.”
In contrast with the snapshot approach, methods based on tracking cohorts of workers over time can yield valid employer-employee period separation rates. One challenge for panel-based methods is that in the United States, publicly available datasets either do not have population representative samples or contain population representative samples for only a few cohorts (Jaeger and Stevens 1999; Hyatt and Spletzer 2016; Baum 2022; Pries and Rogerson 2022; Lachanski 2023). Whether using panels or repeated cross-sections, analysts typically consider group differences by incorporating race and ethnicity as controls on the right side of the population regression (Farber 2010, 235–37; Hollister and Smith 2014; Hyatt and Spletzer 2016, 366; Pries and Rogerson 2022; Molloy, Smith, and Wozniak 2024). In the population regression approach, differences in coefficients reflecting ascriptive characteristics are reported conditional on other controls, such as time trends, occupation, industry, and education. This procedure is helpful for understanding how ascriptive characteristics contribute to population-level trends but has the potential to obscure inequalities between ascriptive groups.5 For instance, it could be that, conditional on educational attainment, there are no racialized inequalities in job stability. Nonetheless, because the distribution of education differs by race, substantial inequalities in job stability by race persist (Hollister 2011; Lundberg et al. 2021).6 Hollister (2011, 314) remarks that research in the early 2000s “tended not to examine trends by demographic subgroups beyond gender.”7 As a result of methodological and substantive choices since then, researchers still know little about how job stability in the twenty-first century has evolved for the groups I investigate in this article: black workers, white workers, male workers, female workers, Hispanic workers, and non-Hispanic workers.
METHOD
This article describes the evolution of inequalities in job stability by ascriptive group. I model job stability for each group using a novel demographic approach that treats jobs as if they are a population subject to a decrement process. Specifically, I use tenure tables, analogous to life tables for human populations, to estimate period survival curves p(x) and period expected years of remaining tenure for a job with tenure x, ex.8 Period measures do not capture the survival experience of any specific cohort, population, or subpopulation but instead summarize the tenure distribution that would arise if rates of decrement held constant for a long time. For a human population, simple measures derived from life tables like life expectancy and life expectancy at a particular age (conditional life expectancy) capture cumulative mortality conditions for the human population. Decreases (increases) in these measures over time indicate that the balance of hazards has increased (decreased). For the population of jobs, measures derived from tenure tables like the expected tenure of a job with tenure x, ex, captures job stability after tenure x. Increases in ex over time indicate that job stability has increased after tenure x. Decreases in ex over time indicate that job stability has decreased after tenure x. Just as a trend in life expectancy captures the evolution of mortality conditions, trends in summary measures of job stability like the expected job tenure capture how employer-employee separation conditions have evolved over time.
A second tenure table parameter I use in this article is lx.9 In a human life table, lx captures the size of a cohort at time x that was of initial size l0. Demographers sometimes compute lx/ly, which captures the probability of surviving to x for someone who has already survived to y at period rates.10 In the tenure table model, lx/ly captures the fraction of employment relationships that have already survived to y and will continue to survive to x at period rates. The job survival curve p(x) describes the probability of survival from hiring to tenure x and can be computed from the lx function as p(x) = lx/l0.
I estimate the tenure table parameters in each period for the population overall and each subpopulation of interest using variable-r methods. The variable-r methods I use require two surveys of workers’ job tenure and a count of hires between both surveys for all individuals from the desired subpopulation. Detail on how these methods are used for estimation in the presence of data error are presented in appendix A (for details, see Lachanski 2023). From the estimated tenure table models, I extract three summary measures of job stability: the expected duration of a job at the time of hiring e0, the expected duration of a job conditional on it already having persisted for a year e1, that is, given that a job already has a year of tenure, and the conditional probability of “lifetime employment” l20/l5, which prior literature has defined as a job that lasts twenty years (Hall 1982, 721; Ureta 1992).11 The first two measures capture the expected tenure for a new employment relationship and an employment relationship that has survived for one year, respectively. The lattermost measure captures the probability of being in a lifetime employment relationship given that one has spent five years on the job. I discuss trends in e0 and e1 in the main text. I discuss trends in l20/l5 in online appendix B to conserve space.12 Ascriptive job stability inequalities are investigated by comparing estimated tenure table summary measures over time for different sex, race, and ethnic groups.13 Just as life expectancy inequalities between groups capture mortality disadvantages, expected job tenure inequalities compactly reflect group differences in job separation conditions.
Data and Measurements
A simple mapping from concepts arising in the demographic study of nonstable human populations to the nonstable population of jobs in the U.S. economy is presented in table 1. The variable-r method requires two counts of workers for a group of interest by tenure at different points in time and counts of population-appropriate hires between each point in time. The IPUMS Current Population Survey Job Tenure Supplement (IPUMS CPS JTS) includes consistently measured counts of workers by job tenure by race, sex, and ethnicity biennially from 1996 to 2020 (Flood et al. 2022). Hires for a variety of sociodemographic groups are available from the U.S. Census Bureau’s Quarterly Workforce Indicators (QWI) from 1994. I use both the QWI annual hires for the population and each group from 1996 to 2019 and the biennial IPUMS CPS JTS from 1996 to 2020 in my main analysis.
Human Populations Versus Employment Relationships as Populations
Specifically, I use the QWI’s count of accessions (hires) for the population, males and females, blacks, and whites, and Hispanics and non-Hispanics. Only employees in privately owned firms are included in the QWI hiring series. Thus I drop all public-sector workers from the IPUMS CPS JTS sample as well. Railroad workers and some agricultural jobs are excluded from the QWI. I attempt to correct for this potential bias by dropping farmers and rail transportation occupations from the IPUMS CPS JTS sample. Hiring by race and ethnicity are only available for the population aged fourteen and over in the QWI. U.S. Census privacy protections prevent them from releasing more granular age categories for hiring by race and ethnicity. Therefore, I include IPUMS CPS JTS data for the population of workers age fifteen and older in the main analysis to make the estimands comparable across all group comparisons (Lundberg et al. 2021). In appendix B, I include analogous results broken down for the overall population and by sex for the nineteen-to sixty-four-year-old age group.14 Table 2 presents case counts from the IPUMS CPS JTS in our final analytic sample. All our year-subpopulation cells are large, with cell sample sizes typically in the thousands.
IPUMS CPS JTS Broad Age Group Analytic Sample Case Counts
Rather than working with single years of tenure, I abridge the tenure data to intervals of [0,1), [1, 2), [2, 5), [5, 10), [10,15), . . ., [25,30), and a final interval from 30 to 40. This solves two problems. First, the variable-r method I use requires a nonzero population in each tenure cell to estimate between survey tenure-specific growth rates, a condition that is met for all subpopulations I study after abridging the data. Second, respondents on job tenure surveys exhibit digit preference in the form of a tendency to overreport job tenures ending in multiples of five (Diebold, Neumark, and Polsky 1997; Neumark, Polsky, and Hansen 1999; Farber 2010; Bidwell 2013). Abridging reduces the influence of digit-preference (Hobbs 2004; Lachanski 2023). In a simulation study in online appendix C, I show that inequalities in computed summary measures of job stability between subpopulations can capture group differences in employer-employee separation conditions under realistic levels of digit-preference after abridging.
RESULTS
To understand the persistence or change in job stability over time, I use the variable-r method to estimate period tenure tables for the population as a whole and selected groups from 1996 to 2020. Next, for the population as a whole and each subpopulation I investigate three measures: expected job tenure, expected job tenure conditional on being one year on the job, and the probability of lifetime employment (twenty years or more) with a single employer conditional on having spent five years with that employer. In table 3, I present an example of the period tenure tables output by the variable-r method for the U.S. population overall and three subpopulations: females, whites, and the Hispanics over the period between the January 2004 survey and that of January 2006. I report the number of jobs reaching tenure x, J(x), as estimated in each survey and estimates for lx, p(x) , and ex. I call this the 2004 to 2006 between-survey period as a shorthand and refer to all other between survey periods analogously.
Period Tenure Table Examples for U.S. Population and Selected Subpopulations, 2004–2006 Between-Survey Period
Period tenure tables for the population of employer-employee relationships can be interpreted exactly like period life tables for the population of humans. For instance, at decrement rates holding during the 2004 to 2006 between-survey period, the average new employer-employee relationship would last for 1.18 years (= e0), but a relationship that had already existed for a year would be expected to live around 5.14 years (= e1). For females, the respective estimates are 1.19 and 4.92 years respectively. For white workers, the estimates are 1.29 years and 5.22 years, respectively. Similarly, the probability of a worker reaching the twenty-year mark with an employer conditional on spending five years with them are l20/l5 = 1,257,130/6,884,721 = 0.18 for the population as a whole at 2004 to 2006 rates. For Hispanics and whites overall, the estimates are: 148,648/1,257,442 = 0.12 and 1,052,896/5,552,394 = 0.19. I present trends in e0 and e1 over time in figures 1 through 4. I discuss trends in l20/l5 in appendix B.

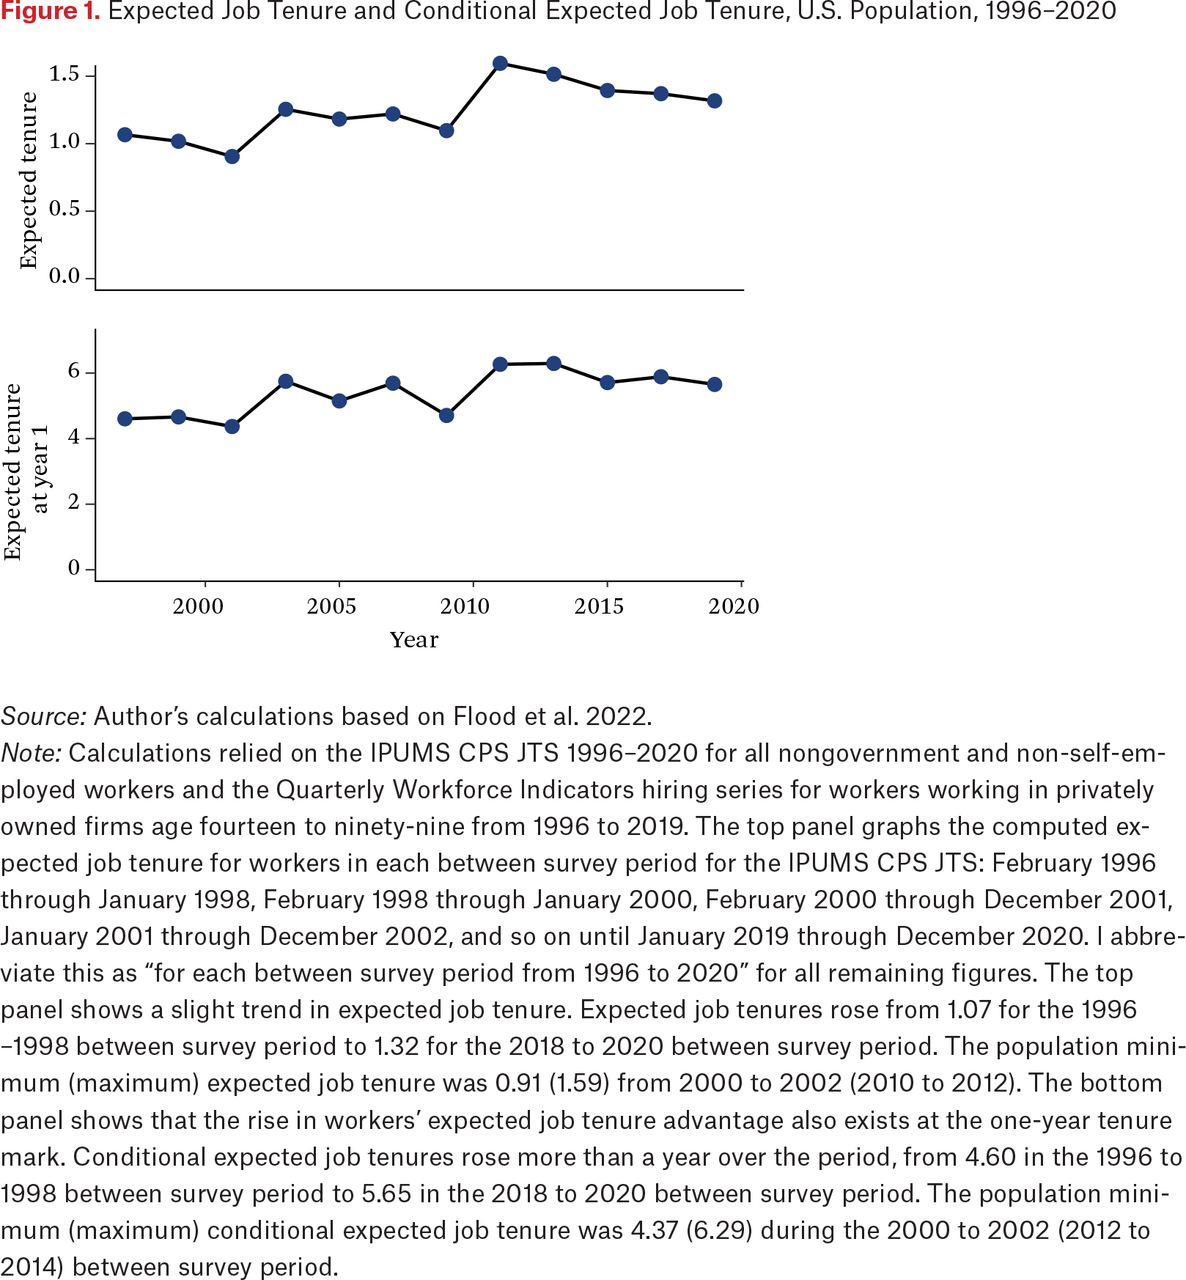
Expected Job Tenure and Conditional Expected Job Tenure, U.S. Population, 1996–2020
Source: Author’s calculations based on Flood et al. 2022.
Note: Calculations relied on the IPUMS CPS JTS 1996–2020 for all nongovernment and non-self-employed workers and the Quarterly Workforce Indicators hiring series for workers working in privately owned firms age fourteen to ninety-nine from 1996 to 2019. The top panel graphs the computed expected job tenure for workers in each between survey period for the IPUMS CPS JTS: February 1996 through January 1998, February 1998 through January 2000, February 2000 through December 2001, January 2001 through December 2002, and so on until January 2019 through December 2020. I abbreviate this as “for each between survey period from 1996 to 2020” for all remaining figures. The top panel shows a slight trend in expected job tenure. Expected job tenures rose from 1.07 for the 1996 –1998 between survey period to 1.32 for the 2018 to 2020 between survey period. The population minimum (maximum) expected job tenure was 0.91 (1.59) from 2000 to 2002 (2010 to 2012). The bottom panel shows that the rise in workers’ expected job tenure advantage also exists at the one-year tenure mark. Conditional expected job tenures rose more than a year over the period, from 4.60 in the 1996 to 1998 between survey period to 5.65 in the 2018 to 2020 between survey period. The population minimum (maximum) conditional expected job tenure was 4.37 (6.29) during the 2000 to 2002 (2012 to 2014) between survey period.
Figure 1 presents the results for the population, showing both expected job tenure in the top panel and expected job tenure conditional on making it to one year on the job in the bottom panel for each between survey period. The top panel shows that the expected job tenure has trended upward over the whole period but declined starting in the 2010 to 2012 between-survey period. This trend also appears in the conditional expected job tenure, which started at 4.60 years and rose to 5.65 years at the end of the period.
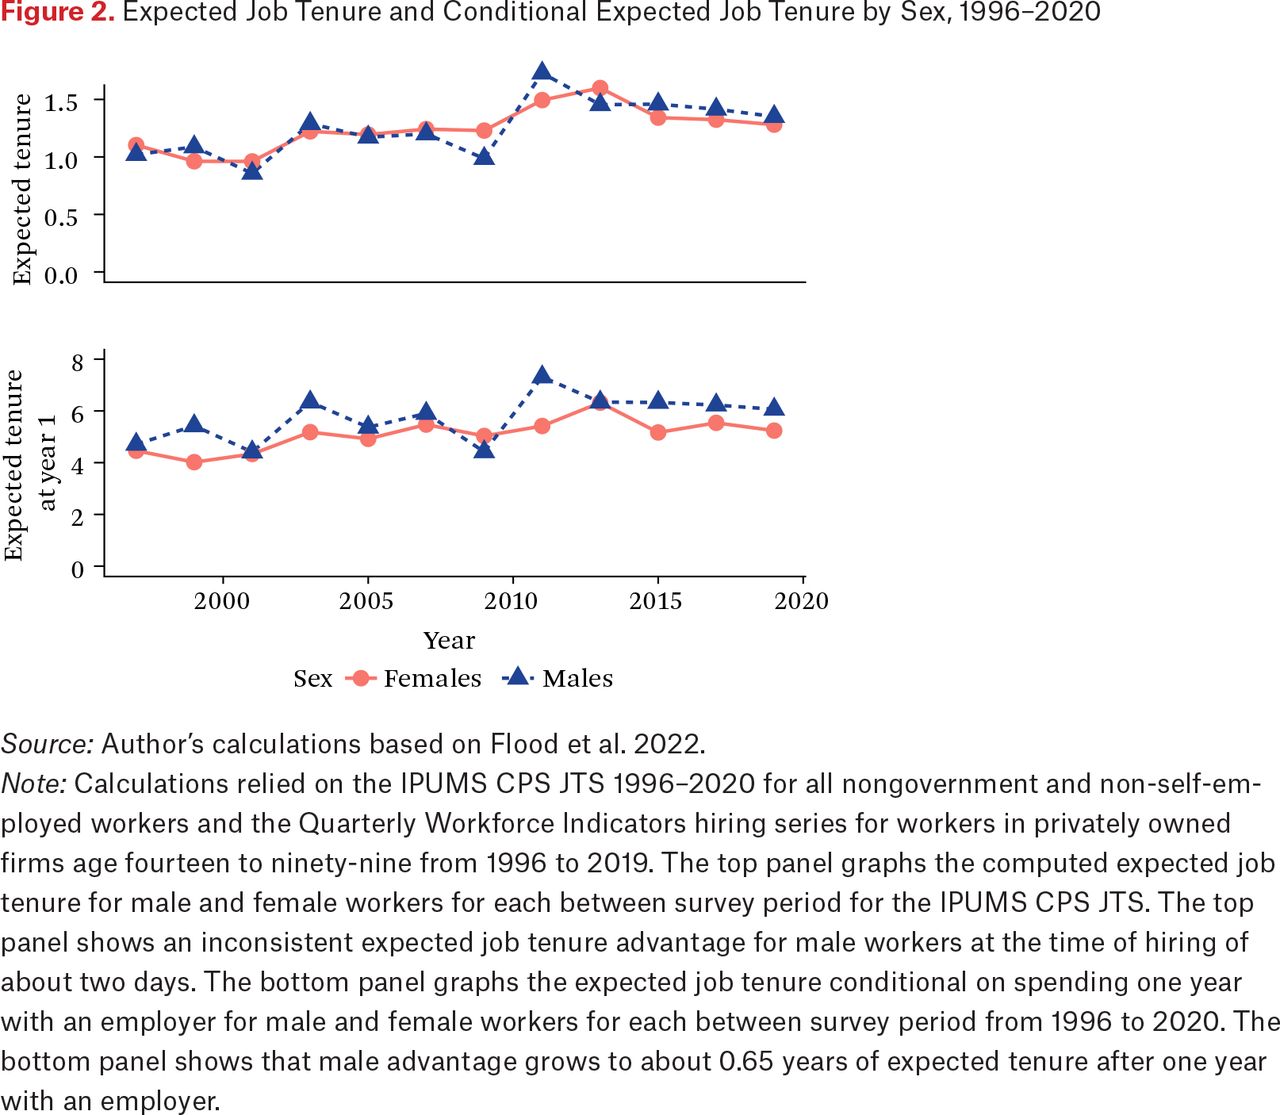
Figure 2 investigates group differences by sex. The trend in expected job tenure is shown in the top panel and conditional expected employment tenure in the bottom panel, for males and females. The expected job tenure and the conditional expected job tenure trend upward for males and females over the period. Both series exhibit drops in expected tenure during recessions. Women have slightly longer expected tenures than men at the point of hiring. Averaging across each between-census expected job tenure gives men an average expected tenure of 1.57 and women an average expected tenure of 1.62. A male advantage emerges at the one-year mark. Men’s average expected tenure conditional on spending one year with an employer is 5.74 years. The equivalent female estimate is 5.09 years.15 These findings suggest that the private-sector expected job tenure gap by sex likely closed between the mid-1980s and the late-1990s (Neumark, Polsky, and Hansen 1999).

Expected Job Tenure and Conditional Expected Job Tenure by Sex, 1996–2020
Source: Author’s calculations based on Flood et al. 2022.
Note: Calculations relied on the IPUMS CPS JTS 1996–2020 for all nongovernment and non-self-employed workers and the Quarterly Workforce Indicators hiring series for workers in privately owned firms age fourteen to ninety-nine from 1996 to 2019. The top panel graphs the computed expected job tenure for male and female workers for each between survey period for the IPUMS CPS JTS. The top panel shows an inconsistent expected job tenure advantage for male workers at the time of hiring of about two days. The bottom panel graphs the expected job tenure conditional on spending one year with an employer for male and female workers for each between survey period from 1996 to 2020. The bottom panel shows that male advantage grows to about 0.65 years of expected tenure after one year with an employer.
Figure 3 presents group differences by race. The trend in expected job tenure at the time of hiring is shown in the top panel and conditional expected job tenure is shown in the bottom panel. Expected tenure statistics are shown separately for blacks and whites. Figure 3 shows an upward trend in expected employment tenure for white workers. Black workers’ expected tenure increases until reaching a peak in the 2010 to 2012 between survey period, but then falls to below its starting point in the 1996 to 1998 between-survey period. White workers maintain a consistent advantage in expected job tenure at the point of hiring, but that advantage shrinks when both workers have spent one year on the job. White workers’ advantage at the time of hiring is 0.43 years or a little over five months. After one year on the job, this expected advantage shrinks to 0.22 years or between eleven and twelve weeks. In the 1996 to 1998, 2000 to 2002, 2010 to 2012, and 2014 to 2016 between-survey periods, black workers who have spent one year with an employer have a (small) outright advantage over white workers. However, throughout most of this period, white workers still experience more job stability than black workers. The consistent white advantage in expected job tenure aligns with Baum’s findings (2022, 554), that black workers’ jobs survive for less time than white workers’ do, all else equal.

Expected Job Tenure and Conditional Expected Job tenure by Race, 1996–2020
Source: Author’s calculations based on Flood et al. 2022.
Note: Calculations relied on the IPUMS CPS JTS 1996–2020 for all nongovernment and non-self-employed workers and the Quarterly Workforce Indicators hiring series for black and white workers age fourteen to ninety-nine from 1996 to 2019. Shown are the computed expected job tenure for black and white workers for each between survey period from 1996 to 2020. The top panel shows a consistent expected job tenure advantage for white workers at the time of hiring. The mean period size of the expected duration advantage at hiring is 0.43 years or about five months. The bottom panel shows that white workers’ expected job tenure advantage becomes less consistent at the one-year tenure mark. Black workers have substantial advantages in expected job tenure conditional on making it to one year in 2011 and 2015. White workers’ mean period expected job tenure advantage at the one-year mark is about 0.22 years (smaller than the equivalent male advantage of 0.65 years).
Racialized group differences in job stability exhibit an inverse pattern to group differences by sex. Group differences in job stability by sex emerged when studying the population of workers who had already spent one year on the job but were small at the time of hiring. Racialized differences in employment stability exhibit nearly the opposite pattern. Substantial racialized differences in favor of whites at the point of hiring shrink in individual periods when analyzing the population of workers who have made it to the one-year mark. Indeed, in four of the periods studied, black workers have a small, expected job tenure advantage conditional on their jobs surviving for one year.
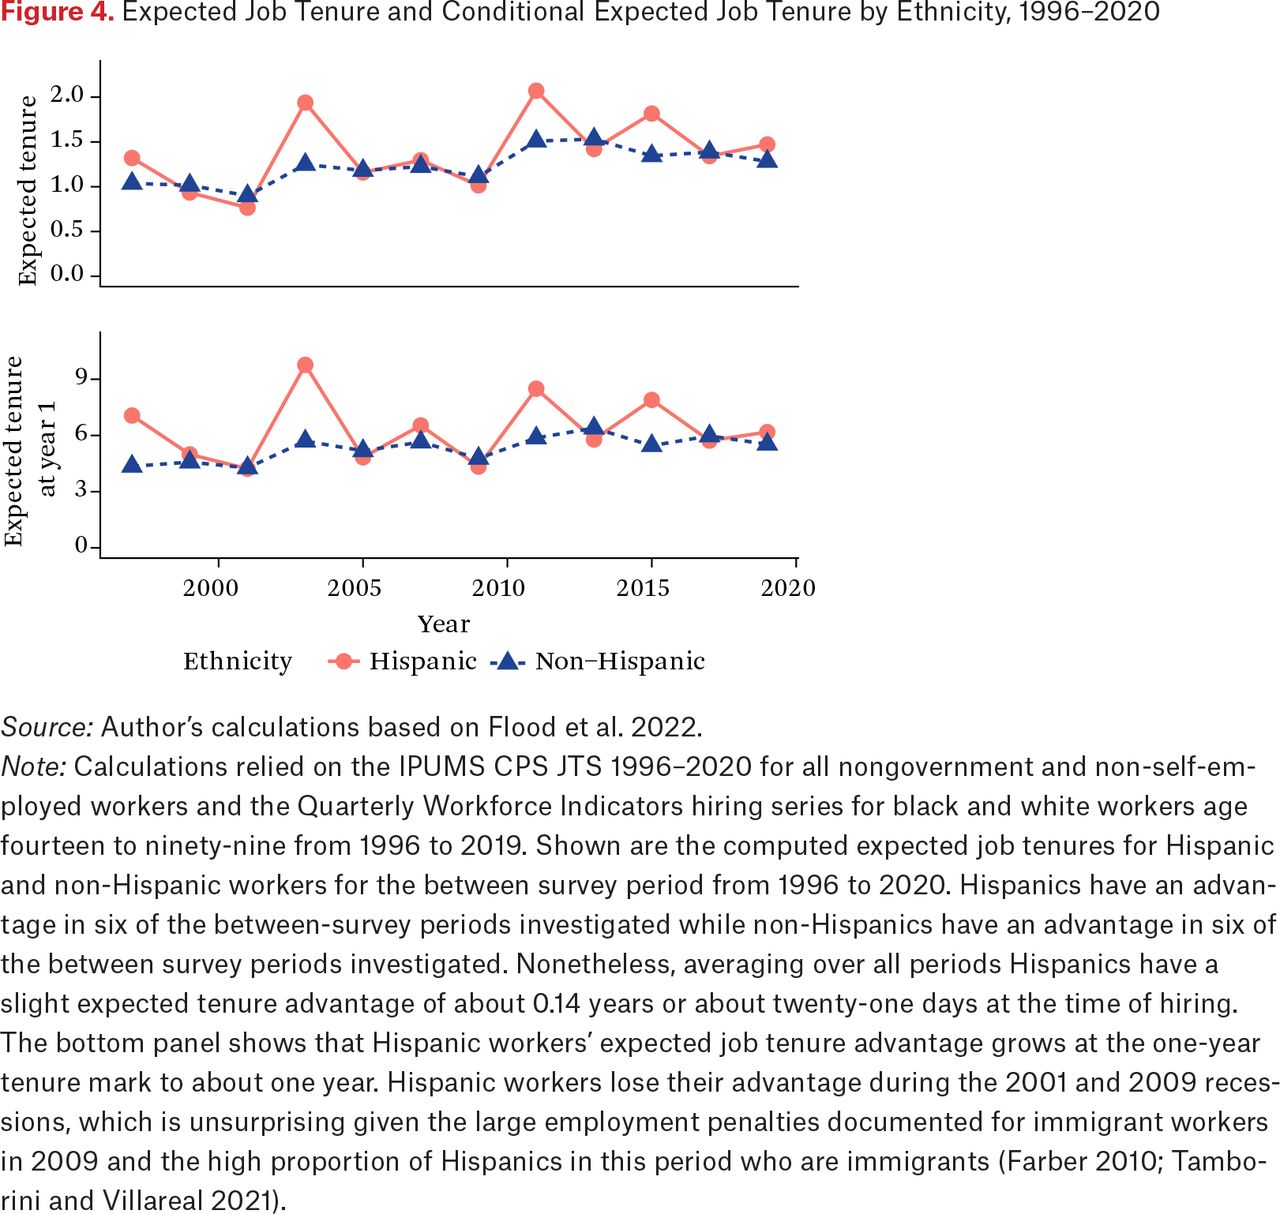
Figure 4 presents group differences by ethnicity broken down by Hispanic identification. Trends in expected job tenure are plotted in the top panel and conditional expected job tenure in the bottom panel for Hispanics and non-Hispanics. Both series trend upward over time. Hispanic workers, averaging across all periods, have an expected job tenure advantage of about 0.14 years. However, in half of the periods they have a slight disadvantage relative to non-Hispanics. After one year on the job, their expected job tenure advantage grows to one full year, but non-Hispanics retain an advantage in just under half of all periods.16

Expected Job Tenure and Conditional Expected Job Tenure by Ethnicity, 1996–2020
Source: Author’s calculations based on Flood et al. 2022.
Note: Calculations relied on the IPUMS CPS JTS 1996–2020 for all nongovernment and non-self-employed workers and the Quarterly Workforce Indicators hiring series for black and white workers age fourteen to ninety-nine from 1996 to 2019. Shown are the computed expected job tenures for Hispanic and non-Hispanic workers for the between survey period from 1996 to 2020. Hispanics have an advantage in six of the between-survey periods investigated while non-Hispanics have an advantage in six of the between survey periods investigated. Nonetheless, averaging over all periods Hispanics have a slight expected tenure advantage of about 0.14 years or about twenty-one days at the time of hiring. The bottom panel shows that Hispanic workers’ expected job tenure advantage grows at the one-year tenure mark to about one year. Hispanic workers lose their advantage during the 2001 and 2009 recessions, which is unsurprising given the large employment penalties documented for immigrant workers in 2009 and the high proportion of Hispanics in this period who are immigrants (Farber 2010; Tamborini and Villareal 2021).
DISCUSSION
In this article, I investigate whether job stability exhibits change or continuity in the post- and pre-Great Recession periods for different groups using novel demographic methods and new administrative hiring records. From 1996 to 2020, expected job tenures for the U.S. population in the private sector rose. If the stability of a typical employment relationship has decreased since the late 1990s, it has been offset by compositional factors at the population level.17 That expected job tenures increased for both sexes at the time of hiring challenges the ability of the masked instability hypothesis to explain U.S. labor-market trends in the twenty-first century but is consistent with perspectives emphasizing the growing importance of screening and declining dynamism. Indeed, at the start of this century Autor (2001, 27–28) correctly predicted that technology-aided job matching boards would lead to longer-lasting jobs. That expected job tenures for workers with a year of tenure have also increased for the population and both sexes points to a critical role for declining business dynamism (Hyatt and Spletzer 2016). I discuss group differences in the next section.
Assessing Group Differences in Job Stability
The finding that throughout the postindustrial era men and women have had similar expected job tenures may surprise labor-market scholars for at least two reasons.18 First, careful work on expected employment durations in the 1970s through the early 1990s reports a male advantage in employment survival and conditional probability of lifetime employment (Hall 1982; Ureta 1992; Diebold, Neumark, and Polsky 1997; Neumark, Polsky, and Hansen 1999; Hollister and Smith 2014; Molloy, Smith, and Wozniak 2024). Second, an academic and popular consensus holds that women tend to permanently leave their employers after childbirth, and this reduces females’ expected tenure (Hollister and Smith 2014). Both points have been challenged in recent research. Baum (2022, 561) finds “greater job stability for young female high school graduates than their male counterparts” and concludes that “any gender differentials” in job stability “are slight” among cohorts born in the late 1950s and early 1960s. Hollister and Smith (2014) document increasing labor attachment by married women from the early 1980s to the early 2000s as prime-age male labor-force attachment underwent a secular decline (Eberstadt 2022). In previous eras, stable employment for males in heterosexual relationships was taken for granted as a precondition for marriage and childbearing (Schneider, Harknett, and Stimpson 2018). Sarah Halpern-Meekin and Adam Talkington (2022) present evidence that these norms can break down; unemployed males in a nonmetropolitan setting had unstable work histories, were not actively seeking work, and yet often had children and did not see themselves as inherently unmarriageable. These social forces might have reduced male employment stability and thus contributed to male-female parity in job stability over the past quarter century.
Scholarship documents either approximate racial parity or even a black advantage in job stability that was fading throughout the 1980s and 1990s (Hall 1982; Neumark, Polsky, and Hansen 1999). Both the black disadvantage at the time of hiring and an occasional (conditional) black advantage in job stability plausibly reflect an extrapolation of the falling black job stability advantage. Compositional differences likely explain a part of the divergence: Hall (1982), Kenneth Swinnerton and Howard Wial (1995), Diebold, Neumark, and Polsky (1997), and Neumark, Polsky, and Hansen (1999) all include the public sector, which has been an important source of employment for black jobholders, in their analyses. My analysis focuses exclusively on the private sector.
I document an unstable Hispanic expected job tenure pattern that sometimes exhibits large advantages and sometimes exhibits small disadvantages relative to non-Hispanics. The slight overall Hispanic advantage in job stability may perversely reflect a kind of “job lock” engendered by the risks of changing employers that immigrants face. Elevated job immobility has been documented in the unauthorized immigrant population by Matthew Hall, Emily Greenman, and Youngmin Yi (2019), and guest workers by Xuening Wang (2021), but little quantitative research has examined the effect of immigration policy on the Hispanic population’s job mobility.
Measuring Group Differences in Job Stability
A spike in theoretical and empirical research on ethnicity, race, and sex-structured socioeconomic inequalities in the last decade has yielded surprisingly little attention to gaps in job stability despite a voluminous literature identifying stable employment as a key contributor to the well-being of the truly disadvantaged (Wilson 1987, 1996). As a result, I believe that several challenges for the measurement of job tenures remain underexplored.
First, regression analyses attempt to implicitly capture the job separation but neglect that tenure-specific separation rates and the history of hires can differ between groups. Males were hired more in each period of our data, but also tended to have greater separation rates at low tenures. This suggests that men’s mean tenure advantage documented in previous work arises from workers whose jobs survive for more than, say, a year. The bottom panel of figure 2 shows that this is in fact the case: men’s tenure advantage becomes persistent conditional on a job surviving for one year, with the notable exception of the Great Recession.19
Second, the measurement strategy throughout this article is based on a formal demographic analysis for nonstable populations applied to the population of jobs. The methods can appropriately handle dual job holding, but the CPS JTS dataset includes only a worker’s tenure at their main job (Hyatt and Spletzer 2016, 367). Baum (2022, 556) points out that although holding three jobs at once is rare, substantial fractions of the working population hold two jobs simultaneously at some point in their careers (Paxson and Sicherman 1996). If workers only report tenures at their longest-held job on the CPS JTS, which seems likely, then our expected tenure estimates are likely biased (Hyatt and Spletzer 2016, 367). Although Hyatt and Spletzer (2016, 368) find that the CPS JTS dataset captures main job tenures about as accurately as administrative data, the effect of differential trends in dual job holding on group differences is unclear.
Third, I have adopted the demographer’s norm of focusing on point estimation and visual inspection of trends rather than fixating on statistical significance (Preston, Heuveline, and Guillot 2001; Hendi 2023). As table 2 shows, the case counts in my sample are large, but I have not attempted to rule out the possibility that the group differences and time trends I document arise from sample error. Bayesian methods in organizational demography remain in their infancy and have not yet been applied to the problem of tenure table inference despite the continued growth of Bayesian inference in population research generally (Stewman 1988; Lynch and Zang 2022; Lachanski 2023). An alternative approach would be to attempt to replicate the findings I present from a cohort perspective using panel data from, for example, the Survey of Income and Program Participation, Panel Study of Income Dynamics, or National Longitudinal Survey of Youth.
Fourth, I have assumed that Hispanics, non-Hispanics, blacks, and whites constitute separate populations with individual statuses that are consistent and stable through time. This was never strictly true in U.S. history, but the quantitative significance of individual changes in racial identification was likely limited. It is now well known that substantial changes to Hispanic identification occur over time (Emeka and Vallejo 2011). Similarly, as populations with both white and black self-identification grows in the United States, standard demographic methods relying on a dichotomous characterization of these two groups may become increasingly untenable. The extension of demographic methods to situations in which individuals may have multiple racial classifications that change over time has posed problems for demographers and remains an active area of research (Alba 2020).
CONCLUSIONS
The upward trend in population-level expected job tenure over the 2000s and 2010s constitutes a break with the slight declines documented in the 1980s and 1990s (Neumark, Polsky, and Hansen 1999; Farber 2000; 2010). The break likely arises from a combination of increased screening and declining labor-market dynamism. In the model by Pries and Rogerson (2022), the impact of screening should rapidly diminish with the length of job tenure. However, I find that expected job tenure after one year on the job has also increased, consistent with an important role for declining labor-market dynamism. On the other hand, job stability differences by race remained moderate and exhibit continuity with trends previously documented in the 1990s (Neumark, Polsky, and Hansen 1999). A more optimistic story emerges when examining job stability inequality by sex, which has remained small throughout the period examined. Ethnic differences in job stability did not exhibit any clear trend over the period. I found no clear trend in lifetime employment for any group in the period under examination. Ascriptive gaps in job stability exhibit substantial continuities over the last quarter century.
This article focuses primarily on inequalities by ascriptive characteristics, but comparisons based on achieved characteristics are also possible using these methods. For instance, in appendix B, while attempting to rule out confounding of parity in expected job tenure by sex with education, a substantial divergence in expected tenure by educational attainment was uncovered that will be explored in future work. It is plausible that similar job stability inequalities exist between the public and private sectors as well as between industries. Period (conditional) expected employment duration and the conditional probability of reaching a certain tenure are only a few of many interesting estimands that can be computed using period tenure tables. With decrement data, the probability of a job ending in a quit, displacement, or firing are other interesting quantities that can be computed with these methods (Lachanski 2023). Future work should consider the demography of job separation, or whether jobs tend to end in different ways for different race-sex combinations.20 Similar work could be done on the 2020–2023 Great Resignation. Some speculate that white, highly educated workers were more likely to quit their jobs during the so-called Great Resignation that occurred during the COVID-19 pandemic (Kaplan and Hoff 2022). The framework I use in this article enables a principled answer to these questions.
APPENDIX A: DETAILS OF THE TENURE TABLE PARAMETER ESTIMATION ALGORITHM
Recent variable-r applications have included the estimation of the Net Reproduction Rate in China (Cai 2008), and the decomposition of age-specific growth rates into those arising from changes in birth, mortality rates, and migration (Horiuchi and Preston 1988; Murphy 2017). My proposed application of the variable-r relations borrows primarily from Michael Lachanski (2023). Lachanski (2023), in turn, utilizes work by Samuel H. Preston and Neil G. Bennett (1983), Preston and Ansley J. Coale (1986), and Preston (1987), which shows how two censuses and a measure of births can be used to construct intercensal period life tables using abridged data. Specifically, Preston, Patrick Heuveline, and Michel Guillot (2001, chap. 8) shows that the population aged x to x + dx at time t to t + dt is, at any point in time, related to the population aged y to y + dy via the growth rate of the population in the age interval a to a + da over t to t + dt and the probability of surviving from age y to age x as shown by fundamental nonstable population equation A1 below:
where J(x,t) is the number of jobs reaching exact age x and time t, lx/ly is the ratio of jobs surviving to y from time x in the stationary population (a conditional survival function), and r(a,t) is the age-a-specific growth rate at time t. This identity applies to any population over a short period of time.
If y = 0, then J(0,t) is the number of hires at time t, H(t). This substitution immediately transforms the equation above to:
relating the population aged x at time t to the number of births at time t multiplied by a function of age-specific growth rates from 0 to x and the probability of surviving to age x for the cohort born at time t. Because J(t) and p(x, t) are period t measures, the population history relating them to J(x, t) is captured by the age-specific growth rates r(a,t) at time t. The key idea is that J(x, t), H(t), and r(a,t) are all quantities that can be estimated with data. This allows us to solve for a survival curve at time t as a function of age x, p(x, t), and thus, the period tenure table for the population of employment relationships. The typical approach, which I summarize here, then constructs a midpoint population for which a version of this identity also holds. Substituting instantaneous growth rates, average annual births, and the midpoint populations generates the p(x, t) estimate. I construct tenure tables for the United States as a whole and selected groups using the p(x, t) terms from equation (A2).21
Suppose the population’s job tenure distribution is J(x, t1) at time t1 and J(x, t2) at time t2. Using equation (A2), with the population of jobs reaching tenure x at time t be J(x, t) one can write:
Multiplying these equations by one another and taking the square root of each side yields:
where the * superscript denotes the midpoint estimate. Note that here, I am using the notation age-specific survival probability, {x-y}px, notation from Preston, Heuveline, and Guillot (2001). The goal is to isolate and estimate  which will yield the period job tenure table. To do this, three discretization assumptions will be required.
Our first assumption is that the tenure-specific employment growth rate changes linearly during the time interval. This implies:
with the estimate of the constant tenure-specific employment growth rate r̄(j) being computable from data as shown by the second equality. The first equality will be exact if r(j, t) changes linearly in the interval or is constant. The more irregular r(j, t) is in the interval [t1, t2], the worse an approximation this will be. As in equation (A2), one can make the substitution of J(0) = H to obtain:
where H*can be estimated by summing hires over the interval we are interested in and dividing by the length of the interval t2 – t1.22
The second discretization assumption arises from the problem that variable-r formulas require exact tenures. Utilizing exact tenures can result in upward sloping job survival curves in the presence of high levels of heaping and rounding, a common problem arising from the use of demographic methods (Jaeger and Stevens 1999; Coale 1984; Stupp 1995, 234). As discussed in the main text, I address this problem by first abridging the data and working with grouped tenure intervals of [0, 1), [1, 2), [2, 5), [5, 10), [10, 15), [15, 20), [20, 25), [25, 30), and [30, 40]. How can one approximate the quantities on the right-hand side of equation (A3), which represent the values at the midpoint of the interval [t2, t1]? Preston, Heuveline, and Guillot (2001, 185) write, “When the data come in 5-year intervals, a convenient solution to this problem is to assume that the values” in an equation analogous to A1 “at the midpoint of an age interval can be approximated by the sum of values in the 5-year interval divided by 5.”
Of course, this logic can be extended to age intervals less than 5. I use the notation developed in Preston, Heuveline, and Guillot (2001) for discrete intervals:  for the estimated years of tenure a job survives for between 0 and 1 and
  for the estimated years of tenure a job survives for between tenures 2 and 5:
and corresponding Sj cumulation functions:
which adapts the solution in Preston, Heuveline, and Guillot (2001, 185) to the abridging scheme I used in the main text and naturally fills in the final interval.
The third and final discretization is to convert the  terms to lj terms in a principled fashion. Lachanski (2023) generalizes Preston’s (1987) estimator when tenure interval lengths are unequal to yield:
Equation A5 yields the lx column from the nLx estimates. All other tenure table variables, for example, ex and p(x) can be computed from the estimated lx and nLx values.
FOOTNOTES
↵1. All code and data required to replicate this article are available at the linked OpenICPSR repository (Lachanski 2024; https://www.openicpsr.org/openicpsr/project/207601/version/V6/view).
↵2. Indeed, Giammarco Alderotti and his colleagues (2021) define employment stability as a combination of high job stability and low unemployment such that workers can obtain long-term employment. Job security typically refers to workers’ perceptions about their ability to retain their current jobs (Neumark 2000, 1–2; Kalleberg 2009, 7). Although they are conceptually distinct, employment stability, job stability, and job security are typically thought to be highly related. Researchers would be skeptical, for instance, if an analysis showed that a job security proxy and job stability were anticorrelated (Molloy, Smith, and Wozniak 2024, 36, 62–65). This article focuses on job stability.
↵3. In addition, more practical uses of expected job tenure are related to the remediation of group inequalities. As Charles Baum (2022, 544) points out, estimating the penalties in wrongful termination lawsuits requires a group-specific estimate of how long a given employment relationship would have lasted had their employment continued. Estimates of the job survival times by group, such as black workers with a college degree employed in the automotive industry, help set a baseline for such investigations.
↵4. Robert Hall (1982) finds that substantial numbers of workers would obtain lifetime employment, which he defines as twenty years or more with a single employer. His analysis concludes that black and white males had similar opportunities to get lifetime jobs, but that women were severely disadvantaged when it came to securing such employment. Manuelita Ureta (1992) argues that Hall’s method generates distorted employment stability estimates when labor force participation varies over time. Because women had been entering the labor force in the 1970s through the 1980s, Hall’s method likely underestimates how long women’s employment relationships would survive. Using a statistical model for employer-employee separation rates, Ureta reports that black workers faced substantially lower job stability than white workers and that the gap between men and women’s job stability was lower than Hall estimates.
↵5. By contrast, researchers tend to study job tenures separately by sex, obviating this critique.
↵6. This article focuses on trends in job stability in ascribed characteristics rather than achieved characteristics like education. In appendix B, I briefly discuss trends in job stability for different education-sex groups to show that key main text results are not confounded by education.
↵7. For instance, little research in the 2010s directly investigated ethnic differences in job stability, such as Hispanic versus non-Hispanic job tenure distributions (for a rare example of such research, see Farber 2010). Christopher Tamborini and Andrés Villarreal (2021) focus on differential job loss and underemployment among the immigrant population, which is disproportionately Hispanic, but do not directly address ethnic differences.
↵8. Earlier research focuses on estimating the survival curve rather than the full tenure table model (Swinnerton and Wial 1995, 1996; Diebold, Neumark, and Polsky 1996, 1997; Neumark, Polsky, and Hansen 1999; Heisz 2005; St-Denis and Hollister 2023). The tenure table model was proposed as an idealized model of the survival distribution of jobs by Herbert Silcock (1954), but data and estimation difficulties prevented researchers from computing period tenure table models for populations of employment relationships until recently (Stewman 1988; Lachanski 2023). A more typical approach, pursued in K. F. Lane and J. E. Andrew (1955), for example, was to present the tenure table as an idealized model and then estimate job survival times using a parametric model—for example, an exponential distribution (Stewman 1988). More recent work has applied survival analysis to longitudinal job tenure data, as in Baum (2022).
↵9. Technically, lx and nLx are the estimated parameters of the tenure table. Once these key parameters are obtained, p(x) and ex are then determined endogenously.
↵10. Formally, lx is defined as the survival curve. The lx parameter can then be multiplied by S to track the survival of an entire hypothetical vintage or population of initial size l0 = S. A typical value for S is 100,000 (Keyfitz and Caswell 2005). The probability of an individual member of a cohort surviving to x is then numerically equivalent to the relative frequency lx/l0. When the population under investigation is large, the ratio lx/l0 also captures the fraction of the cohort that will survive to age x at period rates. This equivalence, which I exploit throughout the article, can be justified by an appeal to the law of large numbers when S is sufficiently large.
↵11. The idea behind this nomenclature is not that twenty years spans the entire career or a lifetime of work but simply that it was unlikely that anyone would have two jobs spanning twenty or more years in a lifetime. See St-Denis (2021, 245, 359–61) for a critique of the use of twenty years to demarcate what constitutes a “lifetime” job.
↵12. Online appendixes B and C can be found at https://www.rsfjournal.org/content/11/1/224/tab-supplemental.
↵13. The study of group differences in job tenures found its earliest incarnation in organizational demography (Silcock 1954; Stewman 1988). For instance, Herbert Silcock (1954) reports differences in job separation hazards by sex, skill, and marital status. Organizational demography’s research efforts are distinguished from the present effort on two dimensions. First, although constructing a national tenure table to track the mortality of jobs was an early ambition of organizational demographers (Stewman 1988, 180–81), appropriate data for this task did not become available until the twenty-first century. Second, that work tended to focus on fitting a (typically parametric) completed length of service curve for particular industries or firms (Stewman 1988, 174–78; O’Reilly III et al. 1989, 28–30). The development of indirect estimation methods in demography was generally ignored by organizational demographers. By contrast, this research applies indirect point estimation methods to new datasets to obtain nonparametric tenure table models that reflect national, population-level trends in job separation rates for each group.
↵14. The QWI and IPUMS CPS JTS sampling frames are not precisely aligned in our racial comparisons: expected job tenures are biased for both whites and blacks because the sampling frame for IPUMS CPS JTS respondents draws from workers aged fifteen and older rather than aged fourteen and older as in the QWI. On the other hand, the QWI does not include hiring data for workers aged one hundred and older whereas the IPUMS CPS JTS in principle does. I expect the bias induced by age mismatches between the IPUMS CPS JTS and QWI to be slight.
↵15. In appendix B, I conduct checks on these surprising results in three ways. First, I show that they hold when using an alternative age group consisting of workers aged nineteen to sixty-four. Second, I show that similar parity holds when considering each sex’s expected tenure within education groups. Third, I visualize the fraction of each birth-year cohort that obtained lifetime employment at ages near retirement and find evidence consistent with these surprising results.
↵16. This article appears to be the first investigation of expected job tenure by Hispanic ethnicity so earlier literature to set expectations is scant.
↵17. In appendix B, I show that the findings reported for the population age fifteen and older discussed here also hold for the age nineteen to sixty-four group. Therefore, changing age composition of the working population is unlikely to be driving these trends. Other unobserved compositional effects might be present.
↵18. On the other hand, it is well known that women are likely to work in occupations that offer more stable jobs, such as administrative and clerical domains.
↵19. This is also consistent with males’ advantage in lifetime employment conditional on spending five years with an employer discussed in appendix B. This pattern is also present in the supplementary results computed for the male and female population age nineteen to sixty-four in table B.2.2. and figure B.2.2.
↵20. Some research has already begun along these lines. In a working paper, Elizabeth Wrigley-Field and Nathan Seltzer (2020) show that displacements explain a substantial amount of black-white employment inequalities, which would suggest that blacks are at elevated risk of being laid off on a per-employment relationship basis relative to whites.
↵21. Space considerations prevent us from giving a full exposition of these relations and their historical context, which can be found in a companion article (Lachanski 2023).
↵22. Specifically, equation A2 suggests that the estimation of a job survival curve for a specific group requires regularly spaced counts of jobs indexed by tenure for that group as well as the number of hires of that group between surveys.
- © 2025 Russell Sage Foundation. Lachanski, Michael. 2025. “U.S. Trends in Job Stability by Sex, Race, and Ethnicity from 1996 to 2020.” RSF: The Russell Sage Foundation Journal of the Social Sciences 11(1): 224–46. https://doi.org/10.7758/RSF.2025.11.1.11. The author gratefully acknowledges funding from NIH T32 HD007242 grant, the Institute of Education Sciences under PR/Award #3505B200035, IPUMS-INDIRA 2022, the International Max Planck Research School for Population Health and Data Science (IMPRS-PHDS), and the 2023 Otto Pollak Fund while working on this research. This project would not have been possible without considerable guidance from Sam Preston. The author received helpful comments from Xi Song, Diego Alburez-Gutierrez, Irma Elo, Michel Guillot, David Neumark, Manuelita Ureta, Eugenio Paglino, Rehana Odendaal, Andres Villatoro, Joyce Kim, Wendy Roth, Herb Smith, Michael Cline, Emilio Parrado, Jonah Davids, Rebecca Johnson, Phyllis Moen, Julie Cai, Tim Riffe, Jennie Brand, Tom VanHeuvelen, Eddie Hunsinger, Fabio Rojas, Minjae Kim, Byungkyu Lee, Xavier St-Denis, Ivan Williams, Jose Monteiro Da Silva, Masoud Movahed, Bob Schoen, Michael Davis, Jere Behrman, Erlend Fleisje, and participants at the IPUMS NDIRA 2022 conference, the 2023 IMPRS-PHDS Annual Academy, the 2023 Russell Sage Foundation Conference on the 2020 Census, the 2023 ASA Annual Conference, and the Rationality and Society Committee of the ASA. Editors Zhenchao Qian and Trevon Logan gave detailed feedback that substantially improved the article. Jikai “Kyrie” Yang provided great research assistance. Three anonymous reviewers also gave helpful suggestions on an earlier draft. Direct correspondence to: Michael Lachanski, at mikelach{at}sas.upenn.edu, Population Studies Center, 3718 Locust Walk, McNeil Building, Philadelphia, PA 19104, United States.
Open Access Policy: RSF: The Russell Sage Foundation Journal of the Social Sciences is an open access journal. This article is published under a Creative Commons Attribution-NonCommercial-NoDerivs 3.0 Unported License.
REFERENCES
In this issue


Jump to section
Related Articles
Cited By...
- No citing articles found.