
Article Figures & Data
Figures
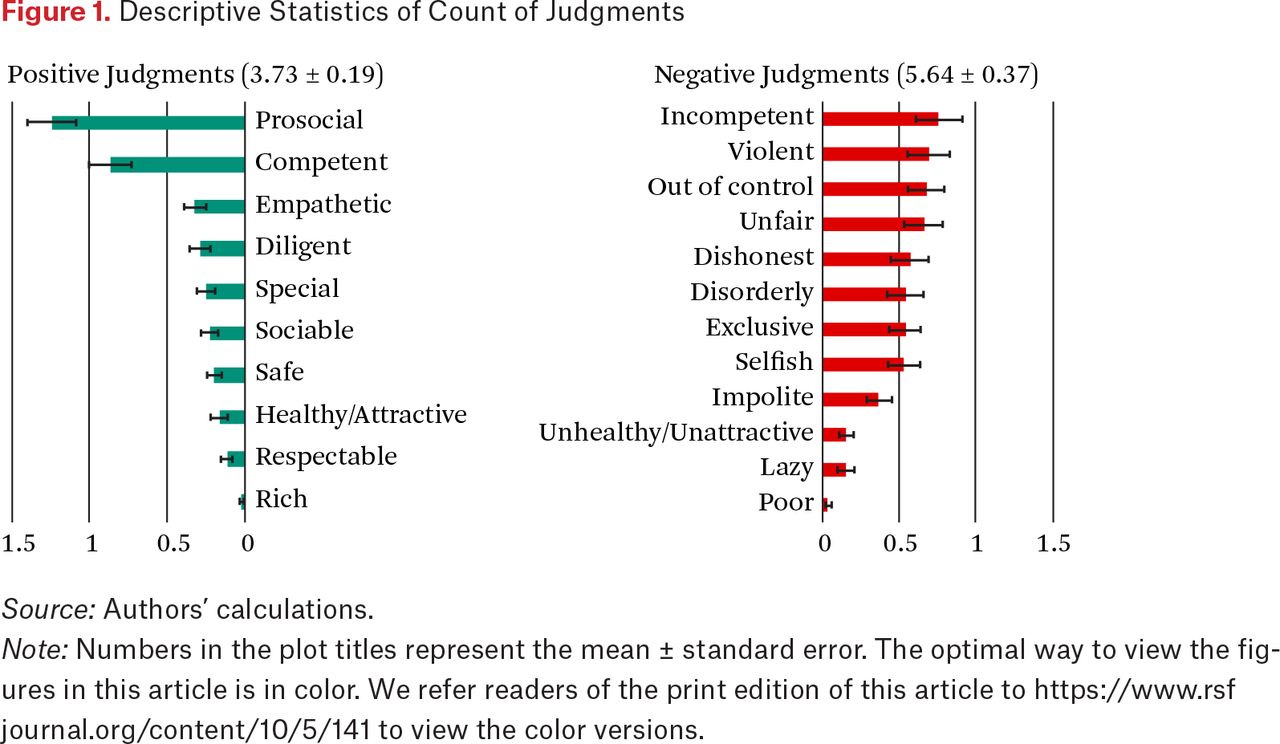
- Figure 1.
Descriptive Statistics of Count of Judgments
Source: Authors’ calculations.
Note: Numbers in the plot titles represent the mean ± standard error. The optimal way to view the figures in this article is in color. We refer readers of the print edition of this article to https://www.rsfjournal.org/content/10/5/141 to view the color versions.
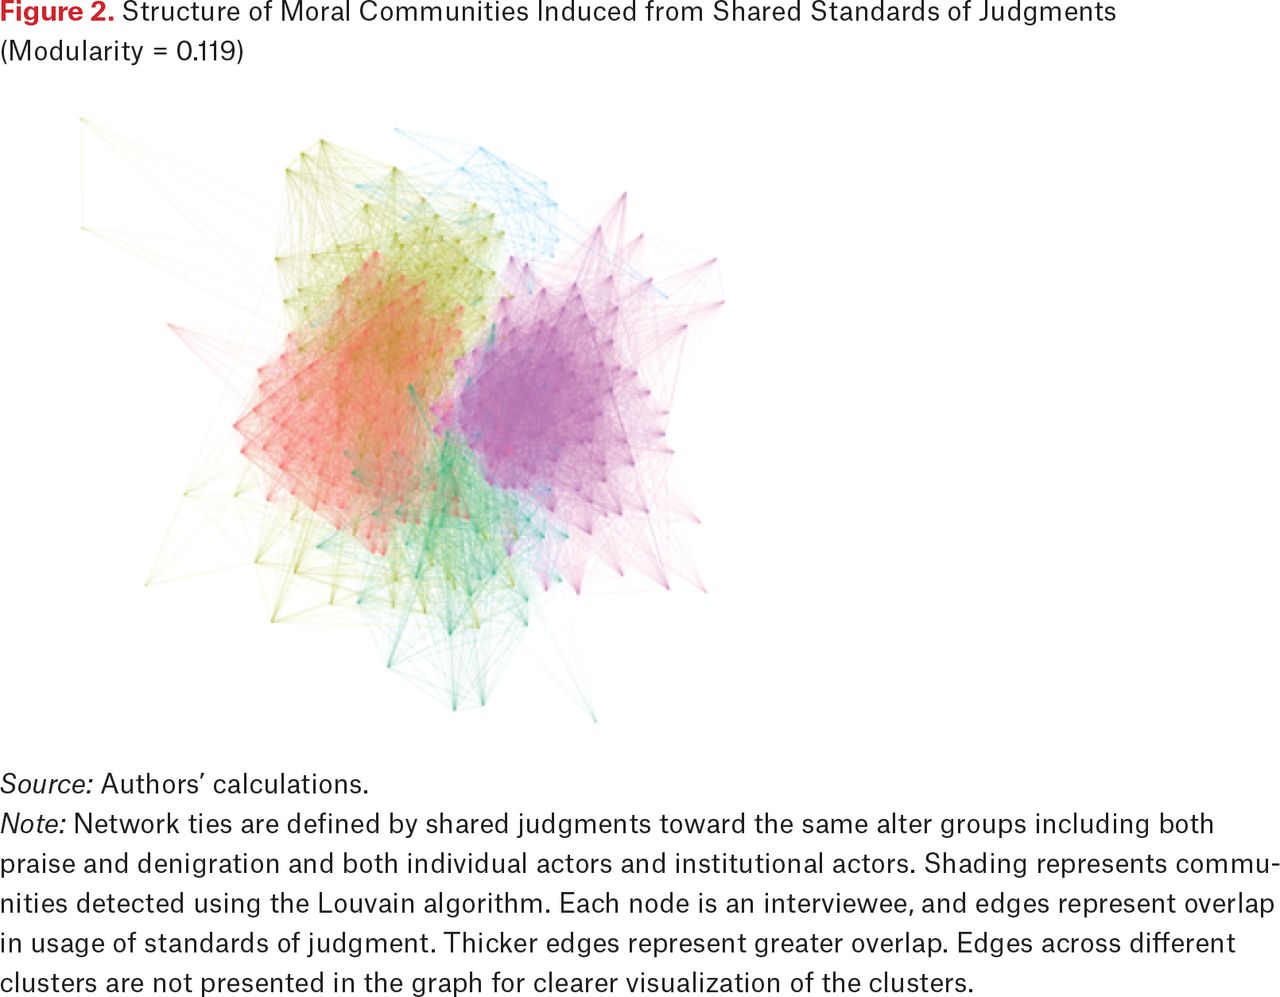
- Figure 2.
Structure of Moral Communities Induced from Shared Standards of Judgments (Modularity = 0.119)
Source: Authors’ calculations.
Note: Network ties are defined by shared judgments toward the same alter groups including both praise and denigration and both individual actors and institutional actors. Shading represents communities detected using the Louvain algorithm. Each node is an interviewee, and edges represent overlap in usage of standards of judgment. Thicker edges represent greater overlap. Edges across different clusters are not presented in the graph for clearer visualization of the clusters.
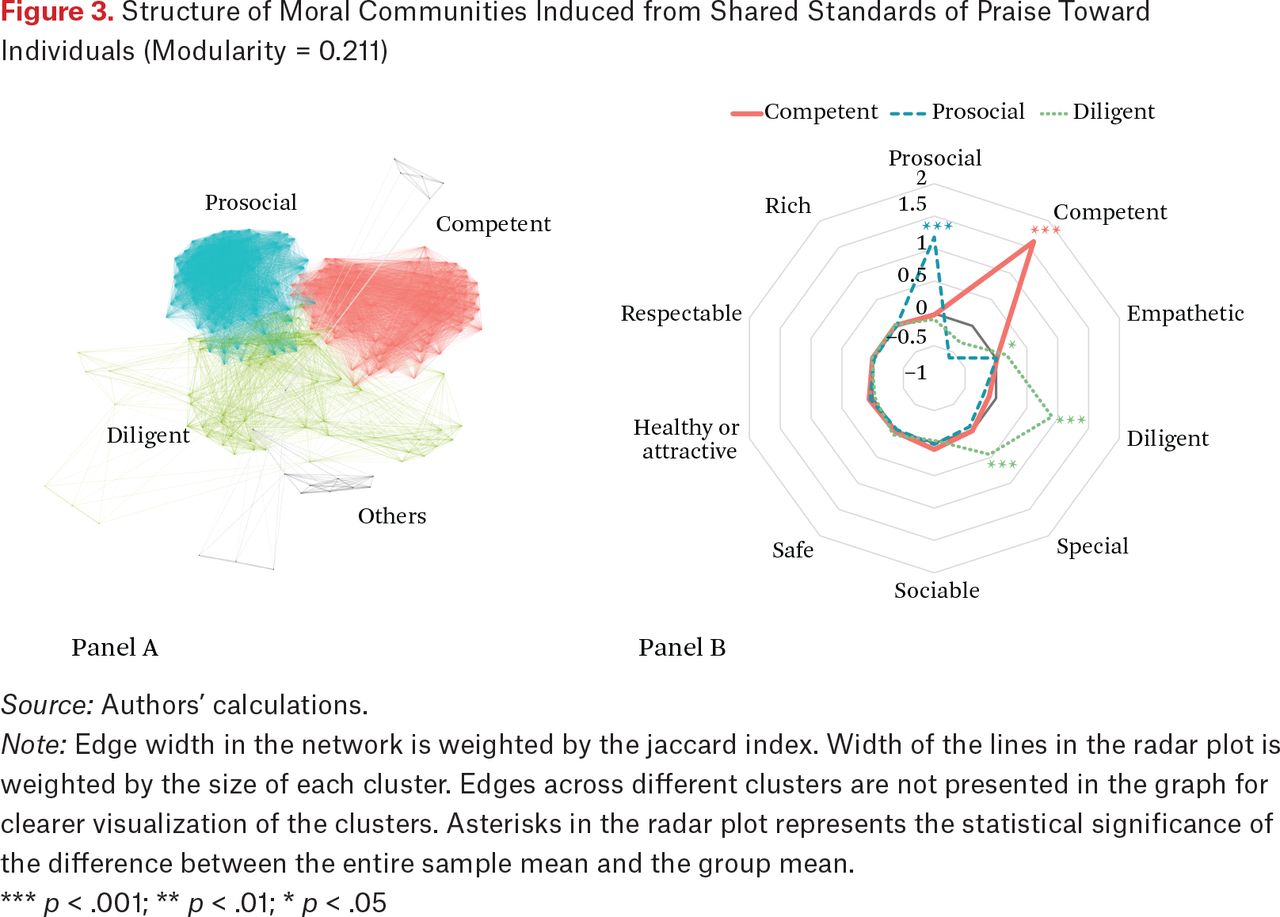
- Figure 3.
Structure of Moral Communities Induced from Shared Standards of Praise Toward Individuals (Modularity = 0.211)
Source: Authors’ calculations.
Note: Edge width in the network is weighted by the jaccard index. Width of the lines in the radar plot is weighted by the size of each cluster. Edges across different clusters are not presented in the graph for clearer visualization of the clusters. Asterisks in the radar plot represents the statistical significance of the difference between the entire sample mean and the group mean.
*** p < .001; ** p < .01; * p < .05
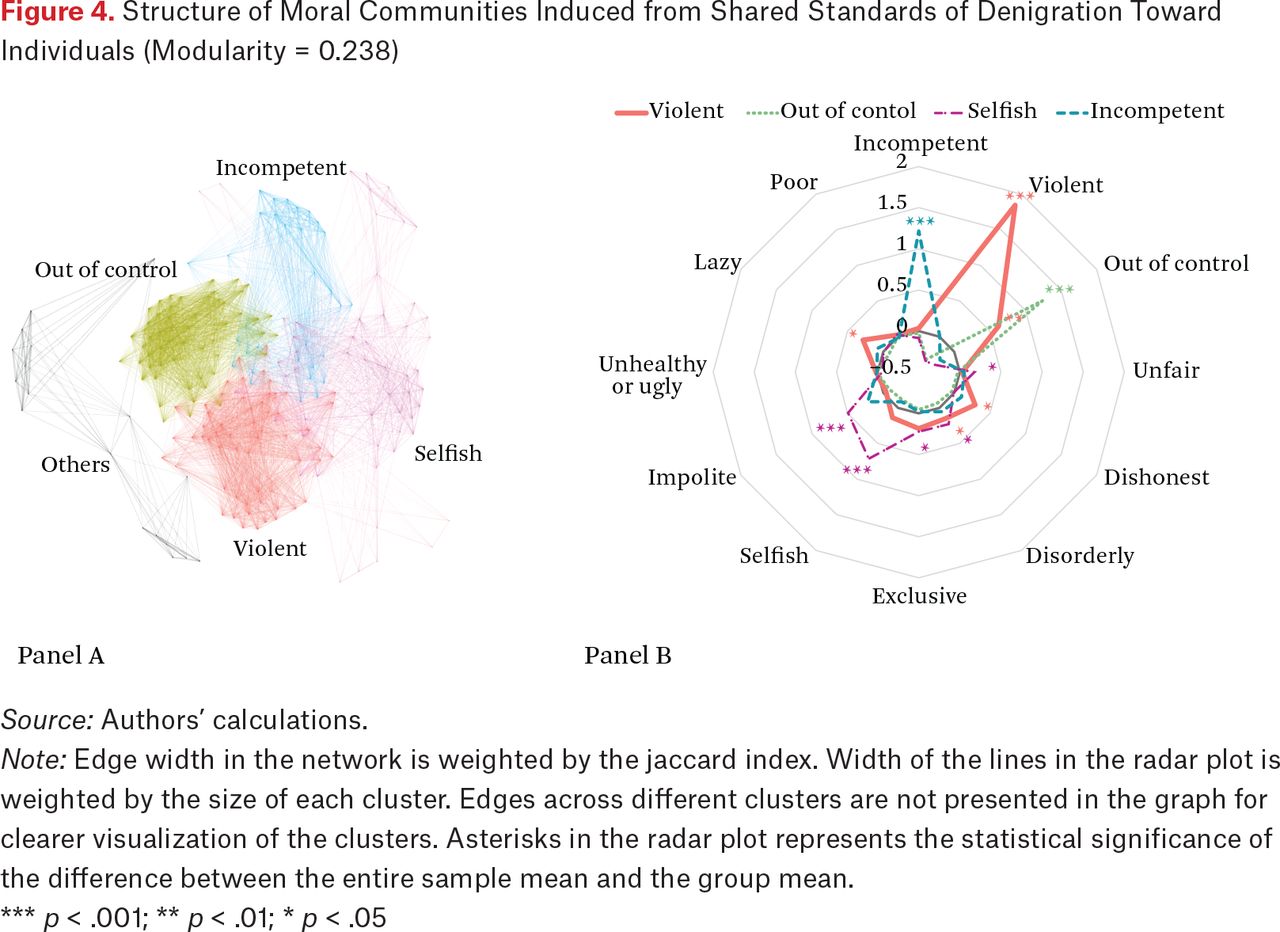
- Figure 4.
Structure of Moral Communities Induced from Shared Standards of Denigration Toward Individuals (Modularity = 0.238)
Source: Authors’ calculations.
Note: Edge width in the network is weighted by the jaccard index. Width of the lines in the radar plot is weighted by the size of each cluster. Edges across different clusters are not presented in the graph for clearer visualization of the clusters. Asterisks in the radar plot represents the statistical significance of the difference between the entire sample mean and the group mean.
*** p < .001; ** p < .01; * p < .05
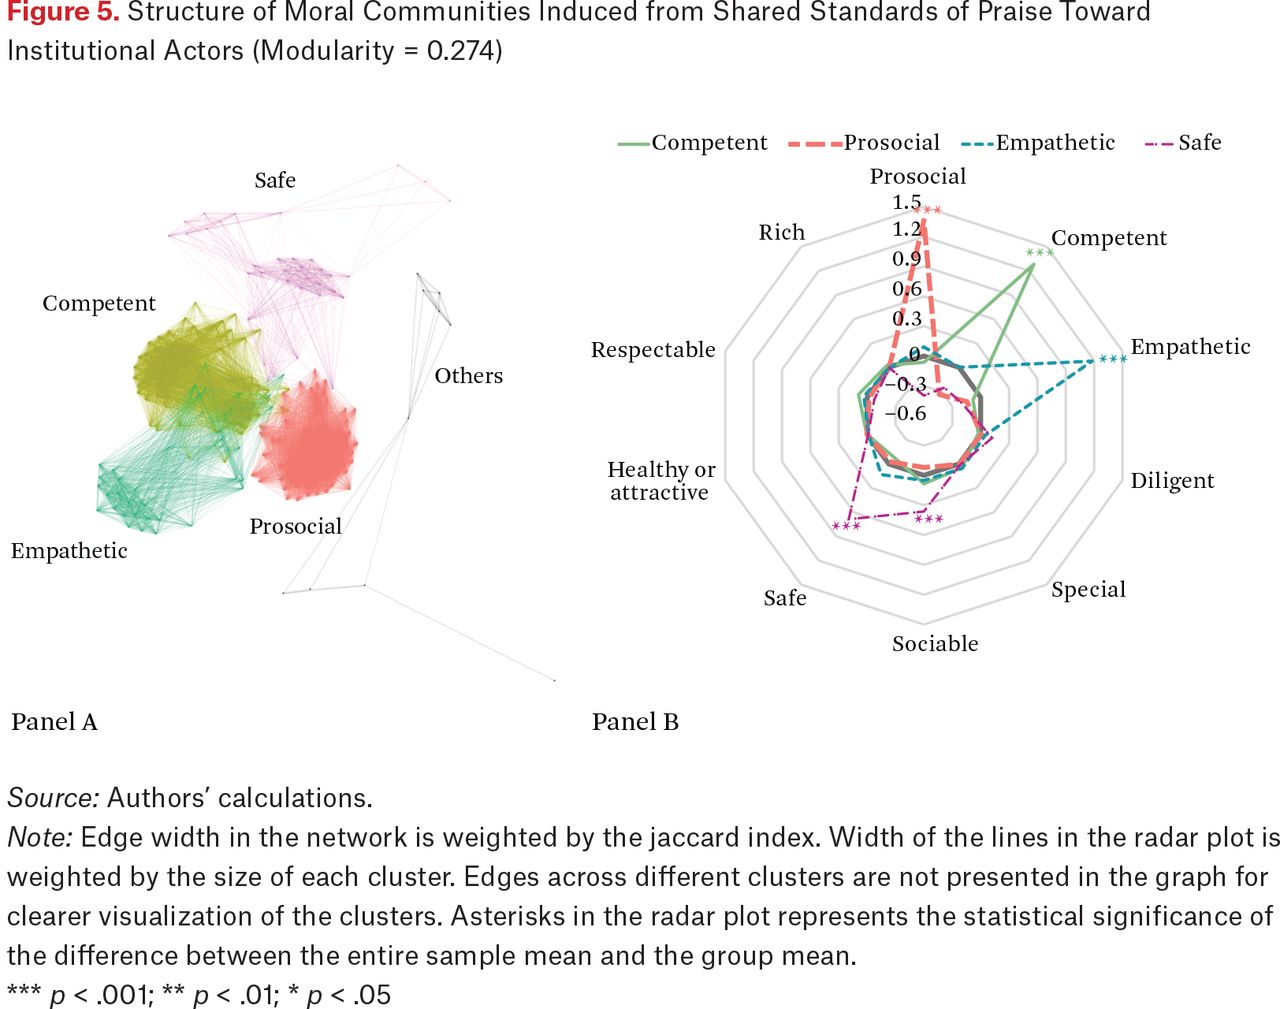
- Figure 5.
Structure of Moral Communities Induced from Shared Standards of Praise Toward Institutional Actors (Modularity = 0.274)
Source: Authors’ calculations.
Note: Edge width in the network is weighted by the jaccard index. Width of the lines in the radar plot is weighted by the size of each cluster. Edges across different clusters are not presented in the graph for clearer visualization of the clusters. Asterisks in the radar plot represents the statistical significance of the difference between the entire sample mean and the group mean.
*** p < .001; ** p < .01; * p < .05
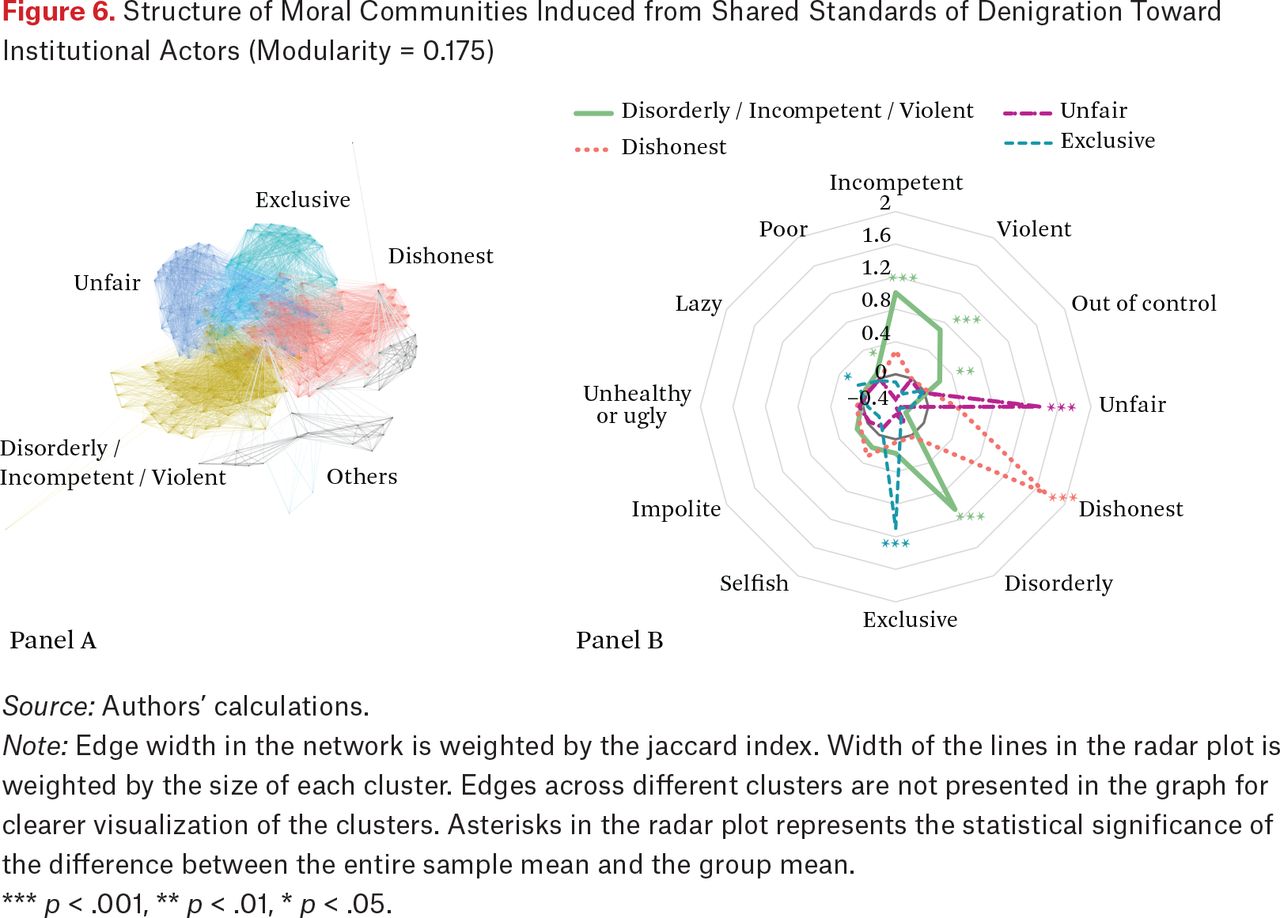
- Figure 6.
Structure of Moral Communities Induced from Shared Standards of Denigration Toward Institutional Actors (Modularity = 0.175)
Source: Authors’ calculations.
Note: Edge width in the network is weighted by the jaccard index. Width of the lines in the radar plot is weighted by the size of each cluster. Edges across different clusters are not presented in the graph for clearer visualization of the clusters. Asterisks in the radar plot represents the statistical significance of the difference between the entire sample mean and the group mean.
*** p < .001, ** p < .01, * p < .05.
- Figure 7.
Difference Between the AIC from Null Model and the AIC from Model with Each Demographic Variable Added
Source: Authors’ calculations.
Note: Null models predict membership of clusters using only coder-fixed effects. The AICs from the null models are compared with models where each of the demographic variables is added to the coder-fixed effects.


Tables
In this issue


Jump to section
Related Articles
Cited By...
- No citing articles found.