
Abstract
Suburbs were once a haven for advantaged, White families to avoid city life and access high-status schools. This urban-suburban divide, however, has changed in recent decades as suburban communities (and their school districts) have diversified. This study provides an updated cross-sectional portrait of recent racial-ethnic segregation and inequality between and within urban and suburban school districts in U.S. metropolitan areas. We find that the urban-suburban divide remains an important stratifying force—a substantial portion of racial-ethnic residential and school segregation, as well as racial-ethnic inequality in school poverty and test scores, occurs between urban and suburban school districts. Significant segregation and inequality also occur between and within suburban school districts. Suburban stratification is a key feature of the geography of inequality, warranting theoretical and methodological attention.
The suburbs play an important part in both reflecting and creating inequalities in the American educational system. Population growth, government-subsidized home mortgages, and highways spurred the suburban boom after World War II, and White suburbanites created new smaller, more homogenous school districts than the large urban districts they left (Jackson 1985). School considerations did not predominantly drive suburbanization, but once suburban school districts were established, they provided a new school option for (White) parents. Although large urban districts were historically seen as the highest quality option in metropolitan areas, White suburban exodus and an influx to cities of Black families whose children had suffered under the segregated school systems of the South reduced the desirability of many northern cities’ school districts (Mirel 1993). In the wake of desegregation cases like Brown v. Board of Education (1954),1 which threatened Whites’ ability to send their children to racially-ethnically homogenous schools, White flight out of cities—and out of urban school districts—accelerated and persisted throughout the latter half of the twentieth century (Clotfelter 2004a; Logan, Zhang, and Oakley 2017).
Inequalities between urban and suburban school districts were exacerbated by enrollment and funding policies. Although Brown v. Board ruled segregation within school districts unconstitutional, subsequent landmark court cases such as Milliken v. Bradley (1974) did not require metropolitan areas or regions to desegregate across school district lines,2 leading to a pattern of largely Black and Hispanic urban school districts surrounded by predominantly White suburban districts. School funding formulas based on local property taxes led to vast resource inequalities between higher-income suburban and lower-income urban districts, creating a legacy of underinvestment that school finance reforms have gradually (and unevenly) addressed in some states (Card and Payne 2002; Jackson, Johnson, and Persico 2016). From this history of segregation and urban public school disinvestment emerged a common schema associating urban school districts with widespread school failure, social disorder, and unsafe conditions, contrasted with suburban public school districts as havens of educational opportunity and academic rigor (Holme 2002; Johnson 2014; Lewis-McCoy 2014; Rhodes and Warkentien 2017). Our assessment of the geography of opportunity and the relevance of the urban-suburban divide has adhered to a historical “Chocolate cities, Vanilla suburbs” framework that warrants renewed attention (Farley 2021; Lacy 2016; Lichter, Thiede, and Brooks 2023).
How different are suburban and urban school districts? How much variation is there among suburban school districts? Answering these questions, and updating the common urban-suburban schema, requires careful attention to school district geography and to the growing diversification of the suburbs. In this study, we attend to both issues with a new portrait of the geography of urban and suburban racial-ethnic educational inequality in the twenty-first century. Specifically, we document racial-ethnic residential and school segregation and racial-ethnic inequality in school poverty and test scores among urban and suburban school districts. Our findings point to the durability of the urban-suburban divide but also substantial inequality among suburbs, demonstrating the need to abandon the idea of suburb as a homogenous social category.
SCHOOL DISTRICTS AND THE URBAN-SUBURBAN DIVIDE
The U.S. education system has been described as a geography of inequality, where racially, ethnically, and economically marginalized populations often live in areas of concentrated disadvantage and attend low-performing schools (Chetty et al. 2014; Logan, Minca, and Adar 2012). School districts are a key stratifying force because, through jurisdictional maps, they formally couple residential choices with access to public schools, local property tax rates, and local community composition (Lareau and Goyette 2014). School district reputation and perceived advantage or disadvantage are thus local amenities that are reflected in housing costs (Nguyen-Hoang and Yinger 2011)—positional goods over which families compete in residential markets (Goldstein and Hastings 2019). Perhaps this linkage explains why most racial-ethnic and income segregation in large metropolitan areas occurs between school districts, rather than between schools and neighborhoods within districts (Fiel 2013; Owens, Reardon, and Jencks 2016; Stroub and Richards 2013). In many metropolitan areas, school district lines actually create sharp racial-ethnic and economic discontinuities between adjacent neighborhoods (Monarrez and Chien 2021). Metropolitan areas in the Northeast and Midwest, fractured by many small school districts surrounding large city districts, fit this pattern most closely (Bischoff 2008; Clotfelter 2004a). In areas where large school districts are countywide and heterogeneous (mostly in the South), between-district segregation is less salient, though recently, small, largely White communities have sought to secede from countywide systems to create their own exclusive havens of opportunity, such as in the Memphis, Tennessee, and Jefferson County, Alabama, areas (Taylor, Frankenberg, and Siegel-Hawley 2019).
School district geography is not merely a general organizing force of inequality—it also intersects with and carries forward the inertia of urban-suburban divisions forged by racially and ethnically exclusive policies of the mid-twentieth century. Political struggles over desegregation and resource allocation, along with the history of state-subsidized White suburbanization, have generated a relational dynamic in which suburban school districts are viewed as an alternative to city school districts. Yet in recent studies of school district inequality and segregation (see Hanselman and Fiel 2017; Owens, Reardon, and Jencks 2016; Reardon, Kalogrides, and Shores 2019; Rich, Candipan, and Owens 2021), the underlying spatial hierarchy (and history) juxtaposing suburban versus urban school districts is unexamined. This oversight in the literature loses the urban-suburban political distinction that is critical to correctly characterizing the geography of educational inequality (Fischer 2008; Fischer et al. 2004; Lichter, Parisi, and Taquino 2015). To address this gap, we adopt a common framework identifying distinct urban and suburban places within each metropolitan area—which we then link to the overlaying map of school district boundaries. These steps enable us to measure the scale of residential and school racial-ethnic segregation, as well as racial-ethnic inequality in school poverty and test scores, and the share that is attributable to differences across the urban-suburban divide, as well as differences among suburban school districts.
Diversity and Segregation Within the Suburbs
Black-White residential segregation across the city-suburban divide declined after 1960 as the proportion of Black (and other non-White) households living in suburbs rapidly increased (Fischer 2008; Fischer et al. 2004), although Black-White city-suburban segregation increased slightly in recent decades (Lichter, Parisi, and Taquino 2015). These studies—and this article—use the information theory index, a measure of segregation that can be decomposed into its geographic sources, like city-suburban segregation. Although suburbs as a whole became more racially and ethnically diverse, the process did not lead to predominantly integrated suburban communities. Hispanic-White, Asian-White, and Black-White residential segregation within a given suburb and between suburban communities increased between 1990 and 2010, accounting for a growing proportion of total segregation in metropolitan areas (Lichter, Parisi, and Taquino 2015). During this time, suburbs as a whole also became home to more poor residents, but not all suburbs experienced an equal increase in poverty rates (Kneebone and Berube 2013). Racial-ethnic and economic segregation across the city-suburban line and between suburbs are thus both key components of total residential segregation.
Given the link between residence and school enrollment, the racial-ethnic and economic diversification of suburbs has led to changes in school segregation. Majority–non-White suburban schools became more prevalent during the 2000s, and exposure to non-White student peers in suburban schools increased for all groups from 1994 to 2007 as the student population became less White (Frankenberg 2012; Fry 2009). Segregation measures that take demographic changes into account show that Hispanic-White and Asian-White segregation among all suburban schools increased slightly during the 1990s and 2000s, whereas Black-White segregation declined slightly (Fry 2009; Reardon and Yun 2001). Sean Reardon, John Yun, and Tamela Eitle (2000) show that school segregation between urban and suburban districts accounted for a substantial proportion of White–non-White and multiracial segregation in the early 1990s, and that most segregation among all suburban schools occurred between suburban districts, rather than between schools within the same suburban district. In the 2000s, segregation between suburban schools declined for most groups, though urban school segregation declined faster (Stroub and Richards 2017). Yet, consistent with patterns in the 1990s, the majority of suburban segregation nationwide occurred between school districts.
The extent to which these segregation trends have persisted into the 2010s, and whether uneven distributions of racial-ethnic groups across (and within) suburban school districts has also produced racial-ethnic inequality in schooling conditions within suburbs, remains unclear. In this article, we first evaluate recent racial-ethnic school and residential segregation between urban and suburban districts, among suburban districts, and within urban and suburban school districts in metropolitan areas. We hypothesize that although urban-suburban racial-ethnic segregation is substantial, segregation between suburban school districts is also a large component of total segregation. We then evaluate racial-ethnic inequality in school characteristics: exposure to poor school peers, average academic achievement on standardized tests, and growth in standardized test achievement (one measure of school effectiveness). Mirroring the segregation analyses, we document inequality between urban and suburban school districts, between suburban districts, and within school districts in metropolitan areas. Our findings evaluate the common narrative that suburban schools provide more educational opportunities than urban schools while also examining inequality among suburban schools.
DATA AND METHODS
We analyze the geographic components of school and residential racial-ethnic segregation and school inequality within U.S. metropolitan areas. We focus on metropolitan areas as the bounds of a family’s choice set for residential and school enrollment decisions, following most scholarship on segregation. Families choose a metropolitan area for job or educational opportunities, links to family networks, or attraction to regional amenities. Then, within the metropolitan area, families choose a residence in a particular city, suburb, or town, which is served by a local geographically defined school district. Schools and neighborhoods, the most granular units of analysis in our study, nest within school districts.
Information about schools’ geographic location and enrollment come from the National Center for Education Statistics’ (NCES) Common Core of Data (CCD). The CCD Public School Universe file includes 44,446 elementary schools that enroll at least five fourth graders in 2015–16 and that are not classified as virtual, alternative, or special education facilities (our criteria for study inclusion). We identify an additional 10,190 private schools serving at least five fourth grade students in the CCD Private School Survey file from 2015–16.3
We retrieved shapefiles for all elementary and unified school districts in 2015–16 from the NCES EDGE web portal and used geospatial techniques to identify the public schools contained within each of their boundaries.4 We then match school districts to the core-based statistical areas (CBSAs) where they are located. CBSA geographic delineations come from the Census TIGER/Line file (Manson et al. 2016); they were updated in 2013 by the Office of Management and Budget based on housing and employment patterns. For eleven large CBSAs, we use smaller CBSA division delineations, resulting in a sample of 398 total metropolitan areas.5 In cases where metropolitan area boundaries crosscut school district jurisdictions, we adjust CBSA boundaries so that they are coterminous with district boundaries by assigning districts to the single metropolitan area that contains the largest share of its residential population.6 In total, our metropolitan sample contains 6,644 school districts and 48,206 public and private elementary schools, which represents 86 percent of all fourth grade students in 2015–16.
We match neighborhoods to school districts and metropolitan areas following a similar geographic hierarchy. The primary units of analysis are Census tracts (2016 TIGER/Line boundaries), nested within school district boundaries. When school district boundaries crosscut tracts, we create tract partitions. Of the 74,004 census tracts in the 2016 TIGER/Line file, 71 percent of tracts were circumscribed within one district and 29 percent span school districts and are partitioned into unique district-tract units, resulting in 111,638 total neighborhoods (tracts or district-tract partitions) and 79,876 metropolitan neighborhoods. We compute population counts in district-tract partitions by aggregating age by race and ethnicity counts from 2010 decennial block-level data.
We analyze segregation between racial-ethnic dyads (White-Black, White-Hispanic, White-Asian) using fourth-grade school enrollment counts from the 2015–2016 NCES CCD and neighborhood counts of children ages five through nine from the 2010 Census. CCD data identify Hispanic students as a distinct racial category, with all other groups comprising non-Hispanic individuals. We mirror this by using census block age-based counts for non-Hispanic White and Hispanic populations. Black and Asian populations, however, are not classified by Hispanic ethnicity and by age at the census block level.7 Our analyses omit other racial-ethnic groups (for example, multiracial, Native American). Total school and neighborhood segregation for each metropolitan area is computed using Theil’s Information Theory Index (H), which describes the degree of racially or ethnically uneven sorting among accounting units (schools, neighborhoods) relative to the racial-ethnic composition of broader analytical units (school districts, metropolitan areas). H is used widely among segregation scholars because, along with several favorable computational properties (Reardon 2009, 2011), it can be additively decomposed, key for our analyses.8 This enables us to identify, for instance, how much of a metropolitan area’s total neighborhood or school segregation owes to segregation within districts versus between them (for recent examples, see Owens 2016; Owens, Reardon, and Jencks 2016; for formula and derivation, see Reardon 2011; Theil 1972).
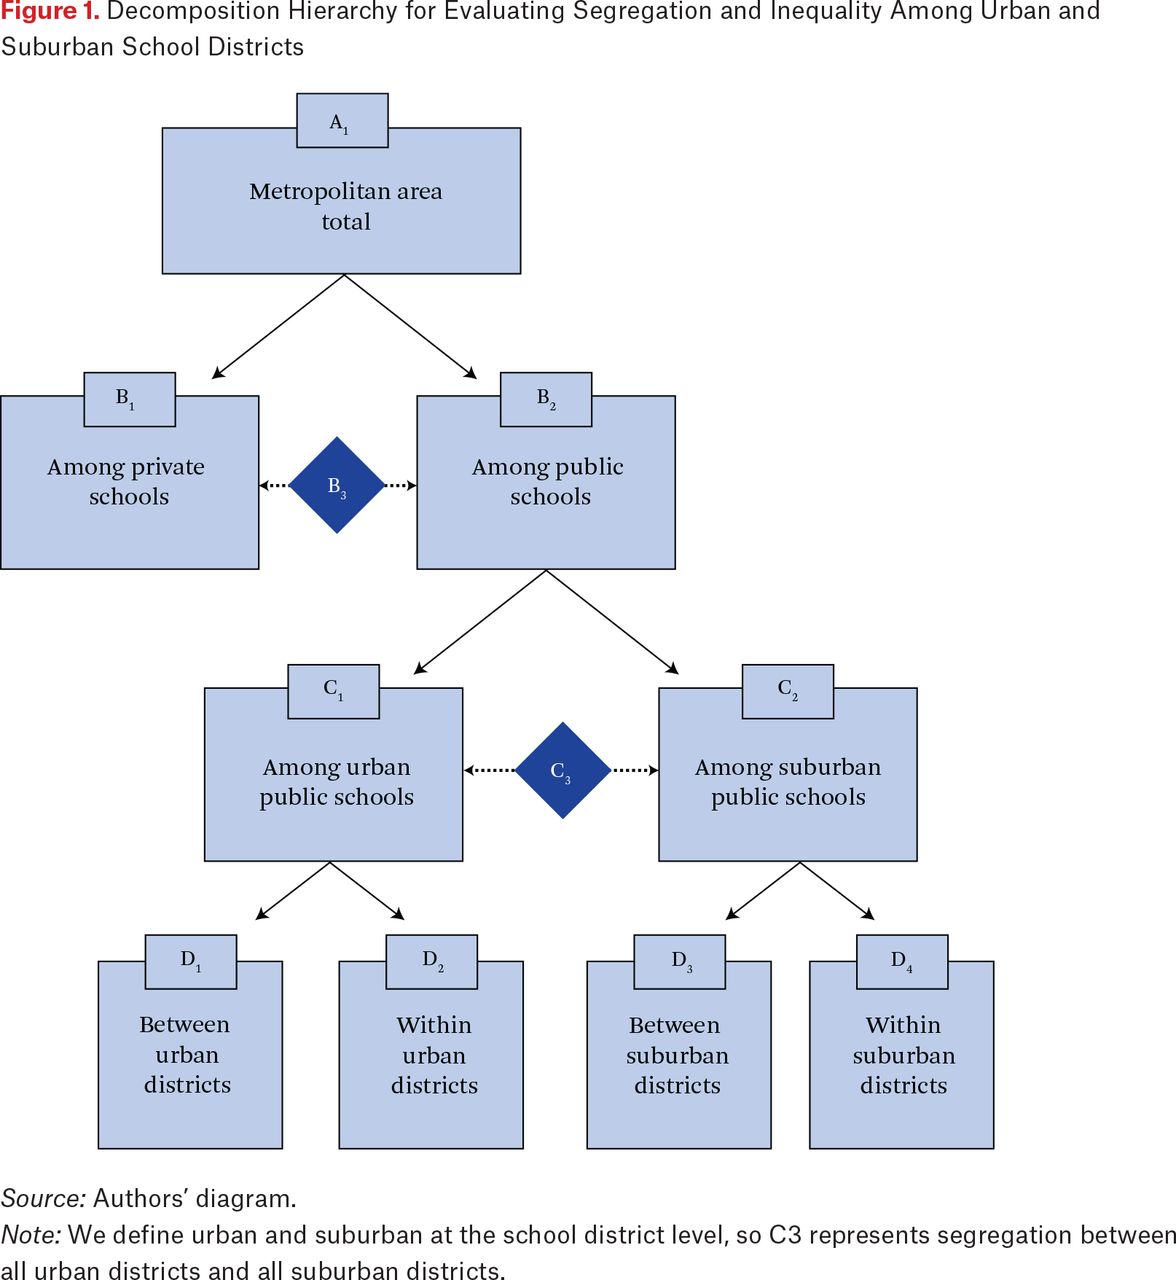
Our decomposition analysis, diagramed in figure 1, emphasizes the distinction between urban and suburban school districts. We classify school districts as urban or suburban based on whether they overlap substantially with the most populated city in a metropolitan area—an approach we discuss further in the results section.9 We first decompose total school segregation for the metropolitan area (A1) into segregation among private schools (B1), segregation among public schools (B2), and segregation between public and private school sectors (B3). We include private schools in our segregation analyses because private schools, like suburban schools, may be used as an alternative to urban schools, so they are an additional source of inequality in the school ecosystem (Murnane and Reardon 2018). By classifying school districts as urban versus suburban, we harness insights about the distinct contribution to total segregation that occurs among urban public schools (C1), among suburban public schools (C2), and between all urban public and all suburban public schools (C3). We further decompose segregation among public schools into within- and between-district components. We decompose segregation among all urban schools as segregation between (D1) versus within (D2) districts; we similarly decompose segregation among all suburban schools as between (D3) versus within (D4) districts. Notably, the additive property of H enables us to identify how much total school segregation is attributable to segregation between public school districts by summing D1, D3, and C3. Likewise, total within-district public school segregation is the sum of D2 and D4. We similarly decompose neighborhood segregation between and among urban and suburban public school districts.

Decomposition Hierarchy for Evaluating Segregation and Inequality Among Urban and Suburban School Districts
Source: Authors’ diagram.
Note: We define urban and suburban at the school district level, so C3 represents segregation between all urban districts and all suburban districts.
We then decompose racial-ethnic inequality in three school characteristics between urban and suburban schools using the same structure diagrammed in figure 1. Following Paul Hanselman and Jeremy Fiel (2017), we measure inequality using Theil’s Inequality Index (T). H and T are similar indices with desirable measurement properties, including scale invariance, the transfer principle, and computational advantages. Key to our analytic aims, both indices are also additively decomposable. Whereas H measures unevenness in how population counts are distributed across units (schools), T measures inequality in how continuous variables (test scores, poverty rates) are distributed across these units. Hanselman and Fiel provide a detailed discussion of T and demonstrate its decomposition for an analysis of schools in California. We extend their method here by considering urban versus suburban inequality in all U.S. metropolitan areas. Notably, total T describes both inequality within racial-ethnic groups as well as inequality between racial-ethnic groups. Given our interest in historical urban-suburban racial-ethnic divides, we present results only for the latter.
We measure White-Black, White-Hispanic, and White-Asian inequality for three public school characteristics.10 First, we measure each school’s percentage of children receiving free or reduced-price lunch (FRPL)—a proxy for exposure to poverty, a key predictor of children’s educational success and educational achievement gaps (Reardon 2016; Reardon et al. 2021). Students are eligible for FRPL if their family income is at or below 185 percent of the federal poverty threshold for their family size. Although FRPL provides a crude measure for poverty exposure (Harwell and LeBeau 2010), it is the only widely available measure of economic disadvantage in school administrative datasets. We compute percentage FRPL for each public school using provided CCD counts and report summary statistics in table 1. Suburban schools have notably larger shares of White students and smaller shares of Black and FRPL-eligible students, as well as higher test score levels but only slightly higher test score growth.
Summary Statistics for Urban and Suburban Public Schools in Sample Metropolitan Areas, 2015–2016
We measure schools’ test score achievement levels as compiled by the Stanford Education Data Archive (SEDA, v.3.0) from state standardized exams. Erin Fahle and her colleagues (2019) provide detailed information about computational methods used to normalize test scores for comparability across states in a metric standardized vertically across all grades. We use a provided school-level variable that pools test scores between 2008 and 2016 for both math and reading scores using an Empirical Bayesian estimation method.
School achievement level is a familiar marker of school quality built into school accountability policies such as No Child Left Behind and a salient criterion for residential sorting (Nguyen-Hoang and Yinger 2011). However, the academic performance of a school reflects both the composition of children attending—influenced by family background and community—as well as the effectiveness of the school to improve student scores. Many scholars and policymakers are interested in evaluating the unique contribution of schools to student learning over time, net of compositional family background and community influences (Condron, Downey, and Kuhfeld 2021; Downey 2019). Test score growth is a better, though not perfect, measure of school effects or quality.11 Thus we also analyze inequality in average school test score growth, measured as the change in scores within cohorts over time. These data, pooled across cohorts from 2008 to 2016, are also provided by SEDA and are similarly normalized relative to national academic performance benchmarks (such that some schools with below-average growth can register negative relative values even as student test scores increase over time). Following Hanselman and Fiel (2017), we transform test score level and growth so that they have a mean of 100 and a standard deviation of 15. This enables us to characterize school quality as an interval-ratio variable (never falling below zero)—a requirement for calculating and decomposing T.
RESULTS
We first describe how we identify urban and suburban school districts before presenting patterns of school and residential segregation and inequality in school characteristics between urban and suburban districts and among suburban districts.
Identifying Urban and Suburban School District Geographies
We conceptualize urban and suburban school districts as communities defined in relation to one another within metropolitan areas: suburban districts serve as alternatives to large urban school districts within a choice set. Our goal is to identify urban and suburban school districts within metropolitan areas. However, the Census Bureau and other agencies do not define suburbs. In addition, in many cases school district and place boundaries do not perfectly map onto one another. The first challenge is to identify which cities, towns, and municipalities—defined as places by the census—in metropolitan areas are urban or suburban. The census identifies principal cities as the largest incorporated place in a CBSA as well as incorporated places with large populations and workforces over a given threshold size (see OMB 2010). CBSAs can have more than one principal city, and CBSA titles reflect up to three principal city names based on descending population size. For example, the Chicago-Naperville-Arlington Heights metropolitan division in Illinois is named by its three largest cities. Following Daniel Lichter, Domenico Parisi, and Michael C. Taquino (2015), we identify the first-listed city (the largest) as urban and consider all other places in a metropolitan area as suburban. This fits our conception of a metropolitan area as a bounded choice set, where residential options are defined in relation to an urban central city. In this study, therefore, suburbs are places other than the largest city in a metropolitan area.
Other quantitative studies in this volume define suburban residential neighborhoods as those outside any principal city (Lichter, Thiede, and Brooks 2023). We focus on the largest principal city because often other principal cities were formerly suburban alternatives to the largest city and then grew into cities themselves—boomburbs (Lang and LeFurgy 2007)—and many such principal cities are considered suburbs in local parlance. For example, Arlington Heights, Illinois, grew as a commuter suburb to Chicago, and though its population now qualifies it as a principal city, it remains conceptualized locally as a Chicago suburb. We echo the call of other scholars for nuanced measures of suburbs that account for local understandings or inner-suburban and outer-suburban distinctions (Lichter, Thiede, and Brooks 2023). Our approach purposefully operationalizes a common urban-suburban schema to apply in all metropolitan areas, which Whitney Airgood-Obrycki, Bernadette Hanlon, and Shannon Rieger (2021) describe as a census-convenient definition. As we show, not all metropolitan areas follow a traditional schema of one central urban place surrounded by suburbs. Here we explicitly categorize metropolitan areas based on their configuration of urban and suburban school districts.
The second challenge is to classify school districts as either urban or suburban, depending on their geographic overlap with places classified as such. To do so, we apply geospatial techniques to 2010 Census block-level population data to partition the residential population of a place across the school districts that serve it (for example, 70 percent of a place’s population resides within the boundaries of one school district and the remaining 30 percent in another school district). About 82 percent of places in metropolitan areas are served by only one district, another 11 percent by two districts, 4 percent by three districts, and more than 99 percent by five or fewer districts. This step allows us to describe how much of a place is served by a given district, but we are also interested in describing districts by how many places they serve. Thus we perform a similar, converse partition exercise of school district residential population across places. School districts are more likely to span places than places are to span school districts. Only about 19 percent of all school districts in metropolitan areas serve just one place; in other words, 81 percent of include at least part of multiple places. Seventy-five percent serve four or fewer places, and 96 percent serve fewer than ten.
We define urban districts as those where at least 50 percent of the largest city’s population is in the school district’s boundaries and at least 50 percent of the school district’s population is in the largest city’s boundaries. The 50 percent threshold is admittedly blunt; in most cases, however, the share of a place’s population served by a district is near either zero or one. Fewer than two hundred places (1 percent of roughly 15,500 places in metropolitan areas in our sample) are split, a school district serving between 40 and 60 percent of the place’s population. From the district perspective, splits are more common (in about 10 percent of some 6,600 districts, between 40 and 60 percent of a district’s population resides in different places). In most cases, though, place boundaries overlap with near zero or near 100 percent of a district’s boundaries, based on population. Therefore, the 50 percent cut point is not especially consequential. Urban districts are thus those serving the largest city in a CBSA. We identify 431 urban districts and consider all other districts suburban.
We next classify our 398 CBSAs according to their unique makeup of urban and suburban districts. Table 2 presents these classifications, along with the number of school districts and fourth graders represented by each.
Classification of Core-Based Statistical Area (CBSA) Divisions by Urban-Suburban School District Geography
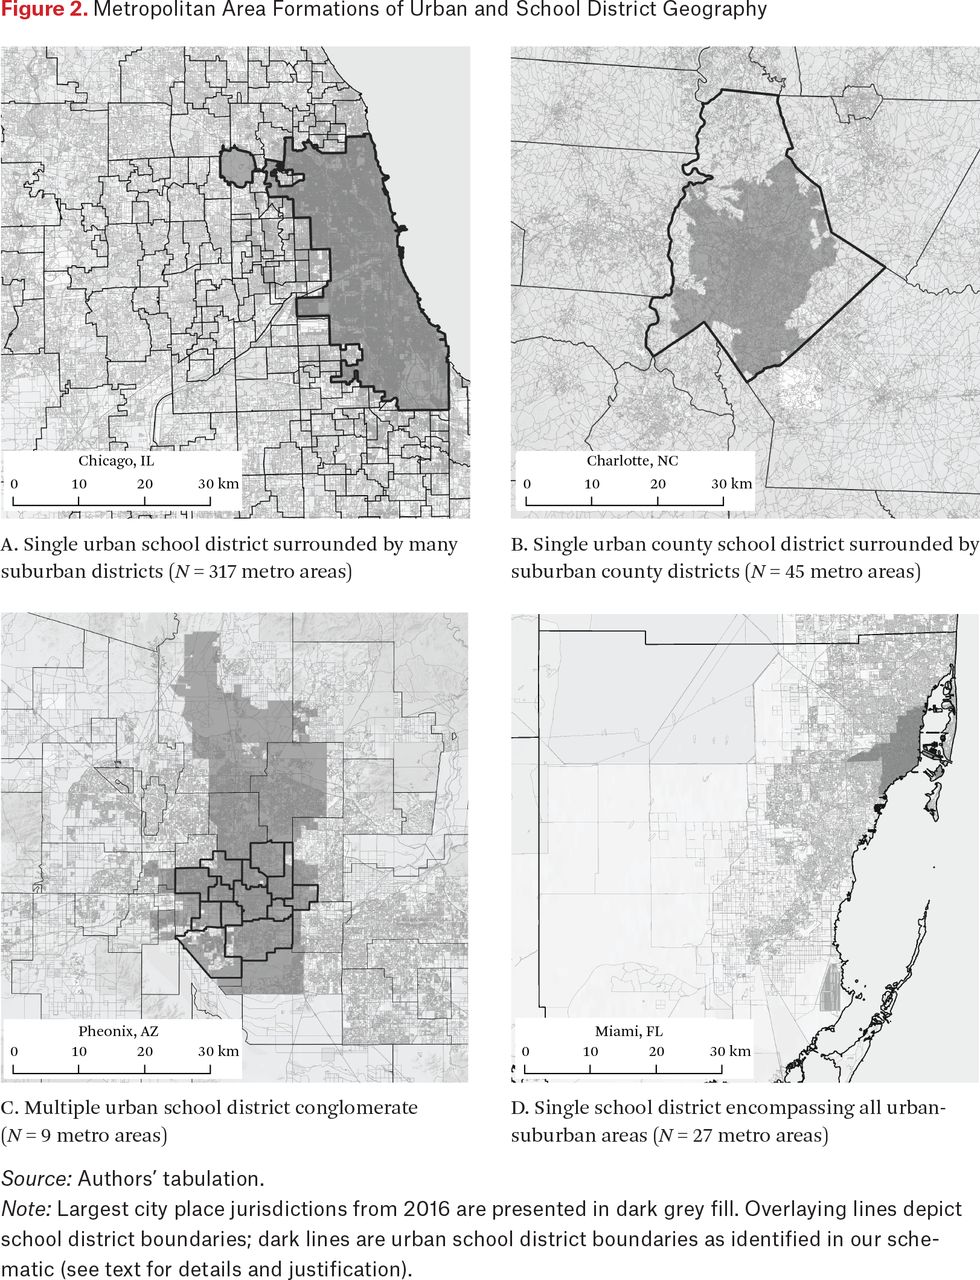
In 317 CBSAs, one urban district serves the largest city.12 For example, the district boundary for Chicago Public Schools (CPS) is nearly coterminous with the city of Chicago; more than 99 percent of the population in Chicago’s boundaries are in CPS’s boundaries and over 99 percent of the population in CPS’s boundaries are in the city’s boundaries. This is illustrated in figure 2, panel A, where the dark gray shaded area is the largest city’s (Chicago) boundaries and overlaying dark lines are the urban school district’s (CPS) boundaries. These 317 single urban school district metropolitan areas fit the classic idea of one large urban district and many suburban districts.

Metropolitan Area Formations of Urban and School District Geography
Source: Authors’ tabulation.
Note: Largest city place jurisdictions from 2016 are presented in dark grey fill. Overlaying lines depict school district boundaries; dark lines are urban school district boundaries as identified in our schematic (see text for details and justification).
In twenty-seven CBSAs, only one school district serves the entire CBSA. Many of these are in the South, where school districts and counties are often coterminous. For example, as figure 2, panel D shows, the Miami-Dade County Public School district (black boundary line), the fourth largest school district in the country, spans the entire Miami–Miami Beach–Kendall metropolitan area (the city of Miami’s boundaries are shaded in dark gray). We drop such cases from our analysis because urban-suburban distinctions occur entirely within a single large district rather than between school districts.
In forty-five metropolitan areas, the majority of the largest city’s population is served by a single district, but less than 50 percent of the district’s population resides within the largest city. These cases are often metropolitan areas that include county districts that cover an area well beyond the largest city. For example, figure 2, panel B, shows that the city of Charlotte, North Carolina, (shaded gray) is served by the Charlotte-Mecklenburg school district (black boundary line), which serves all places in Mecklenburg County. Distinct from the previous type, “single urban county school district” metropolitan areas have other districts as well, but the district serving the urban place does not delineate between city and suburbs, instead including both.
Last are the nine CBSAs where no single district serves a majority of the city, for example, Phoenix, Arizona. Cross-referencing population share data with investigations of maps and online research, we identify the districts serving substantial or meaningful proportions of the city population—such as the many elementary districts serving Phoenix that are in the Phoenix Union High School boundaries, which covers the entire city (see figure 2, panel C). We consider these districts as a collective urban district and all other districts as suburban in these multiple urban school district metropolitan areas.
Our classification procedure provides one framework for linking the geography of public education to the common urban-suburban schema (for an alternative approach, see Bathia et al. 2023, this issue). As we show, not all metropolitan areas comport neatly to the mental map many researchers have, lending support to the call for alternative definitions of urban and suburban places that match shifting social, demographic, and institutional geographies (Airgood-Obrycki, Hanlon, and Rieger 2021; Lacy 2016; Lichter, Thiede, and Brooks 2023). For the analyses that follow, we focus on results for the single urban school district metropolitan areas (see figure 2, panel A) because they fit the typical conceptualization of city-suburban delineation in metropolitan areas. In the appendix, we present results for all metropolitan area types. In an online supplement, we provide two datasets identifying the classification schema used for each metropolitan area and each school district—a tool we hope other researchers will incorporate.13
Urban and Suburban Segregation
Next we evaluate patterns of school and neighborhood racial-ethnic segregation within and between urban and suburban school districts. Prior work has demonstrated the salience of school districts for both residential and school segregation. Here we report how these patterns map onto urban and suburban school districts.
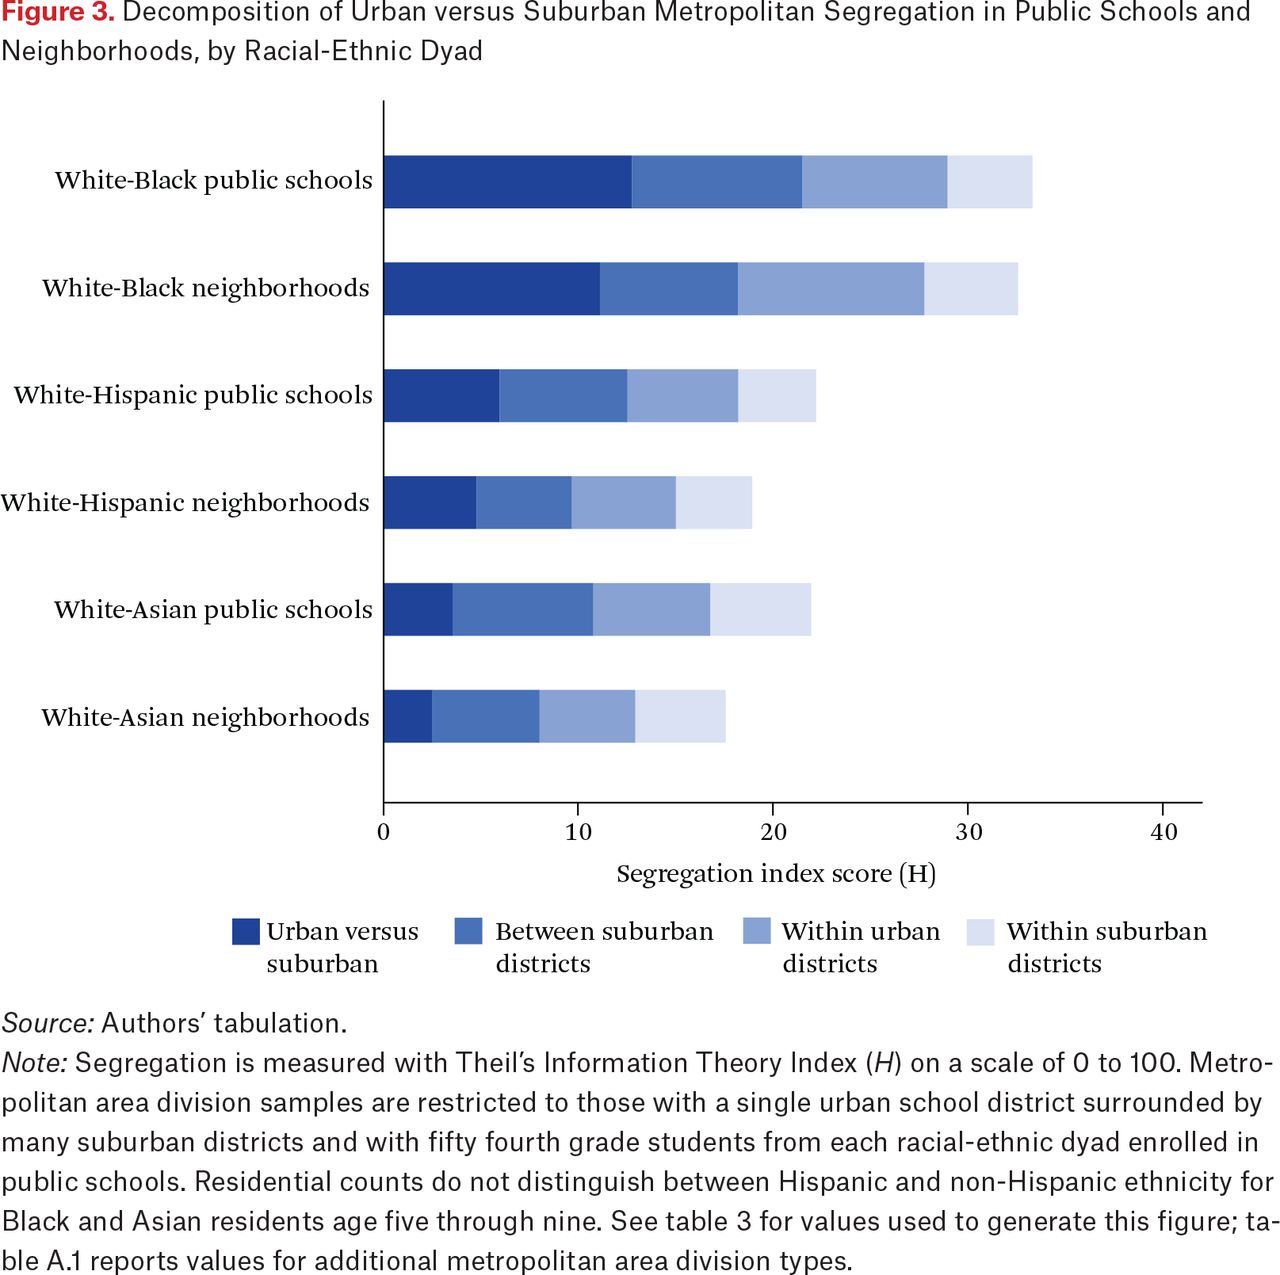
In table 3, we present estimates of school and residential segregation for single urban school district metropolitan areas, and results are illustrated in figure 3. Although we identified 317 single urban school district metropolitan areas, table 3 focuses on White-Black trends and reports values only for metropolitan areas with at least fifty Black and fifty White fourth graders (N = 264). Total school segregation in 2015–16 registers as H = 33.11 (panel A). In the segregation literature, this is a relatively high value of H, indicating that White and Black children are very unevenly distributed across schools within metropolitan areas. This summary measure is an unweighted average across all metropolitan areas. The highest total White-Black school segregation is observed in Milwaukee-Waukesha-West Allis, Wisconsin (H = 67.31), and the lowest is in Barnstable Town, Massachusetts (H =9.54).
Decomposition of White-Black School and Residential Segregation

Decomposition of Urban versus Suburban Metropolitan Segregation in Public Schools and Neighborhoods, by Racial-Ethnic Dyad
Source: Authors’ tabulation.
Note: Segregation is measured with Theil’s Information Theory Index (H) on a scale of 0 to 100. Metropolitan area division samples are restricted to those with a single urban school district surrounded by many suburban districts and with fifty fourth grade students from each racial-ethnic dyad enrolled in public schools. Residential counts do not distinguish between Hispanic and non-Hispanic ethnicity for Black and Asian residents age five through nine. See table 3 for values used to generate this figure; table A.1 reports values for additional metropolitan area division types.
Table 3 reports three separate decompositions for total school, public school, and neighborhood H by subcomponent, including the value and proportion of the total that each subcomponent represents. We begin by noting, from panel A, that segregation between private and public schools accounts for a small share of total school segregation (2 percent). Segregation is also low between schools within the private school sector (H = 1.02, or 3 percent of total school segregation). We present these results to clarify that although private schools once featured prominently in the history of school desegregation, providing an outlet for school White flight among families unwilling or unable to move (Clotfelter 2004b), they contribute very little to total White-Black school segregation today. Private schools do still matter in some large districts—for example, Philadelphia has a large private school sector and segregation both among private schools and between public and private schools is above average. However, we find little average impact across metropolitan areas nationally because parents have many other ways to avoid unappealing public school options, such as living in their preferred districts or enrolling their child in public charter schools (Rich, Candipan, and Owens 2021). Indeed, table 3 reveals that most segregation occurs among public schools, which we have decomposed into segregation between urban and suburban districts, segregation among urban schools, and segregation among suburban schools. Thus, even though panel A provides the most complete portrait of school segregation, we shift the remaining discussion of school segregation to panel B (limited to public schools) so that the findings are more directly comparable to other results for which private school data is unavailable.14
Panel B of table 3 reveals three important findings. First, the urban-suburban divide explains 38 percent of total public school segregation in sample metropolitan areas. Scholarship demonstrates high levels of between-district segregation, but this finding reveals that most between-district segregation reflects uneven White-Black distributions across a single district line—between a large city district and all suburban districts. The urban-suburban divide accounts for 59.7 percent of total between-district segregation (100*12.79 /[12.79+8.63]). (Because this sample of metropolitan areas has only one urban district, there is no between-district segregation among urban districts.) To put this value in perspective, we provide comparable estimates in figure 3 for White-Hispanic and White-Asian dyads. The bar plots in figure 3 report total segregation for each racial-ethnic dyad (the bars for schools represent panel B of table 3), shaded by subcomponent. White-Hispanic and White-Asian public school segregation is lower than White-Black segregation overall (that is, the total bars are smaller). But perhaps more strikingly, segregation between urban and suburban districts (the darkest shade area) explains a lower proportion of total White-Hispanic and White-Asian public school segregation, 27.0 percent and 16.2 percent, respectively, relative to 38.4 percent for White-Black segregation. Segregation between the single urban district and all suburban districts accounts for 47.8 percent of White-Hispanic and 33.1 percent of White-Asian between-district segregation. The higher salience of the urban-suburban divide among White and Black children is, we posit, evidence of the inertia of Black suburban exclusion and its relationship to the “bright lines” of school district boundaries. Indeed, many White families rule out entire urban school districts when considering where to live (Saporito and Lareau 1999)—a behavior consistent with historical patterns of White flight from desegregating school districts (Logan, Zhang, and Oakley 2017). At the same time, White-Hispanic and White-Asian segregation appear to follow alternative patterns—with higher baseline levels of shared diversity in suburbs but also, in some pockets, rising segregation. Our decompositions center on cross-sectional data (for a complementary picture with attention to trends over time, see Lichter, Thiede, and Brooks 2023; Bathia et al. 2023, this issue).
Of course, the urban-suburban divide does not capture the whole segregation story. A second key finding in panel B of table 3 is that segregation among suburban schools (H = 12.96) accounts for 38.9 percent of total White-Black segregation—a greater share than that explained by the urban-suburban divide. Notably, most suburban school segregation is explained by uneven White-Black sorting between suburban school districts (100*8.63/12.96 = 66.6 percent). This suggests that despite evidence of Black suburbanization in more recent decades, population flows have not occurred evenly across suburban school districts (Frankenberg 2012). Instead, Black children tend to be more highly concentrated in some suburban school districts than others. We explored this in the metropolitan area surrounding St. Louis, Missouri, which has a high H of 44.20 between suburban districts (H = 55.36 overall). About 25 percent of all Black fourth graders in the metropolitan area attend public schools in the St. Louis City School District, and another 50 percent are concentrated in just twelve of the 117 outlying suburban districts. In contrast, just 2 percent of White fourth graders from the metro area attend public schools in the St. Louis City School District; the same twelve suburban districts enrolling a majority of Black students enroll just 10 percent of the White student population share.
Returning to figure 3, we see that 47.4 percent of total White-Hispanic school segregation (100*10.51/22.18—the sum of the between and within suburban district components) occurs in suburban schools, mostly due to sorting between rather than within suburban districts. White-Asian segregation is substantially lower overall (H = 22.0) and follows a different pattern: this racial-ethnic dyad is the only one where a majority (56.5 percent) of total segregation is due to segregation among suburban schools. Again, most of the suburban segregation occurs between rather than within suburban districts. Although we can only speculate on the reasons why White-Asian segregation follows this distinct pattern, we suspect that it may reflect Asian Americans’ earlier and higher suburbanization levels compared to Hispanic or Black families, greater income diversity among Asian American families, and perhaps distinct flows of immigrant populations from urban enclaves to established suburban school districts in a handful of major metropolitan areas, such as in Northern and Southern California, Seattle, and New York City.
A third finding to emerge from the decomposition analysis is that residential segregation of children age five to nine (panel C of table 3) tracks closely with public school segregation. For each dyad in figure 3, residential segregation is slightly lower than its school segregation counterpart, but the relative proportion of each subcomponent is roughly similar. Note, however, that White-Black segregation within urban districts is higher for neighborhoods than for schools. Urban districts may be one area where private school enrollment provides an outlet for White avoidance of White-Black integration; in these cases, public schools are less segregated because a larger subset of children are not included in the public school population even though they live within the district in segregated neighborhoods. This finding underscores the dynamic interplay between both residential and school sorting, as well as the calculations parents may make in an increasingly complex school choice environment (Cuddy, Krysan, and Lewis 2020; Rich, Candipan, and Owens 2021).
Overall, the decomposition analysis reveals considerable public school and residential segregation between urban and suburban districts and among suburbs for all racial-ethnic dyads, with the highest levels of segregation between White and Black students. Our presentation has focused only on metropolitan areas with a single urban school district. Table A.1 reports parallel findings for each racial-ethnic dyad for metropolitan areas with an urban county district and multiple urban districts. These metropolitan areas do not fit the “classic” urban-suburban schema, as detailed in the previous section. And, as expected, the urban-suburban divide accounts for a substantially smaller share of total segregation in these two metropolitan area types (for example, 14.3 percent and 9.2 percent of total White-Black public school segregation for urban county and multiple urban district metropolitan areas, respectively, relative to 38.4 percent for single urban school district metropolitan areas). This finding validates our classification framework illustrated in figure 2, but also suggests that a classic understanding of urban-suburban divides is inappropriate for one-fifth of metropolitan areas. Perhaps more important, our findings update and echo previous findings (Reardon, Yun, and Eitle 2000) that segregation between suburban districts warrants considerable attention from education policymakers whose emphasis on urban school reform may overlook new formations of segregation.
Urban and Suburban Educational Inequality
We now turn to documenting whether segregation between and among urban and suburban districts co-occurs with meaningful racial-ethnic inequalities in school characteristics. Table 4 and figures 4 and 5 present a parallel decomposition analysis to the previous section for single urban school district metropolitan areas. In these results, we estimate Theil’s Inequality Index (T) in three public school characteristics: FRPL composition, school average test score level, and school average test score growth.
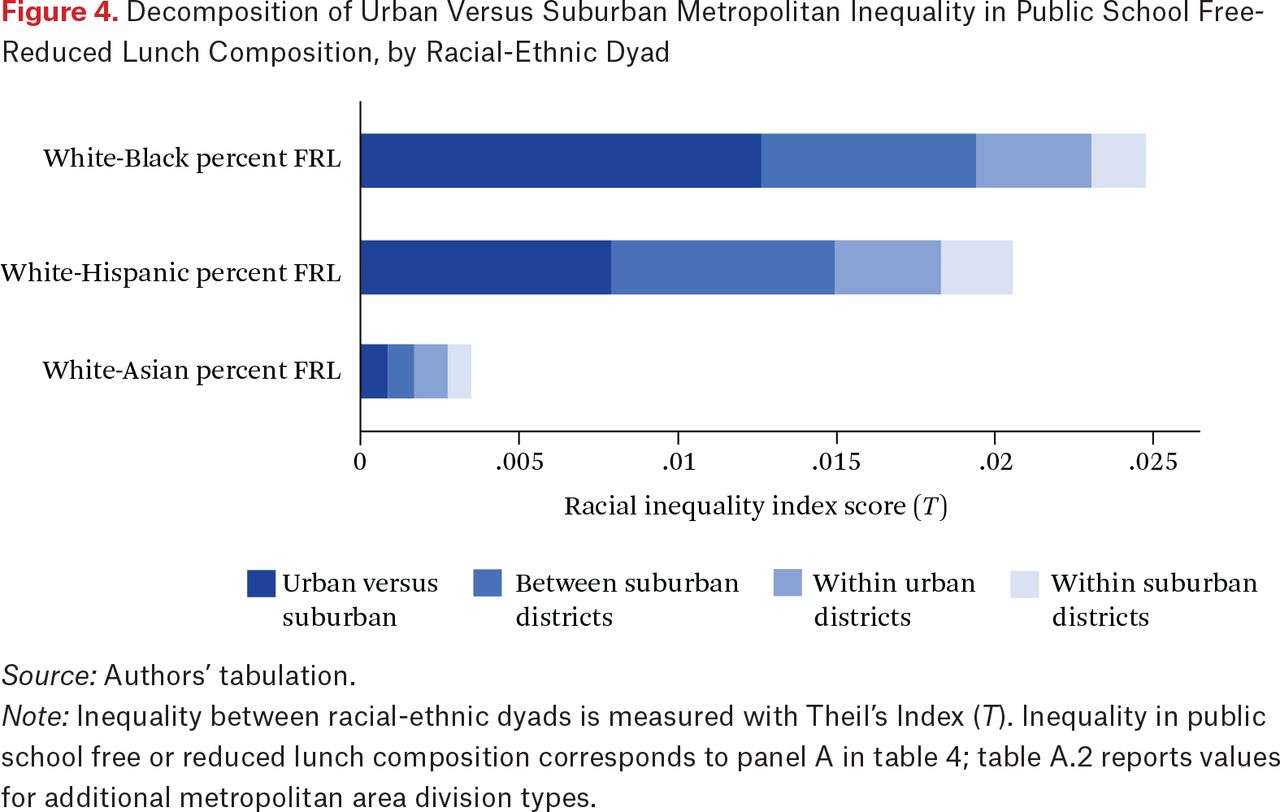
Decomposition of Urban Versus Suburban Metropolitan Inequality in Public School Free-Reduced Lunch Composition, by Racial-Ethnic Dyad
Source: Authors’ tabulation.
Note: Inequality between racial-ethnic dyads is measured with Theil’s Index (T). Inequality in public school free or reduced lunch composition corresponds to panel A in table 4; table A.2 reports values for additional metropolitan area division types.
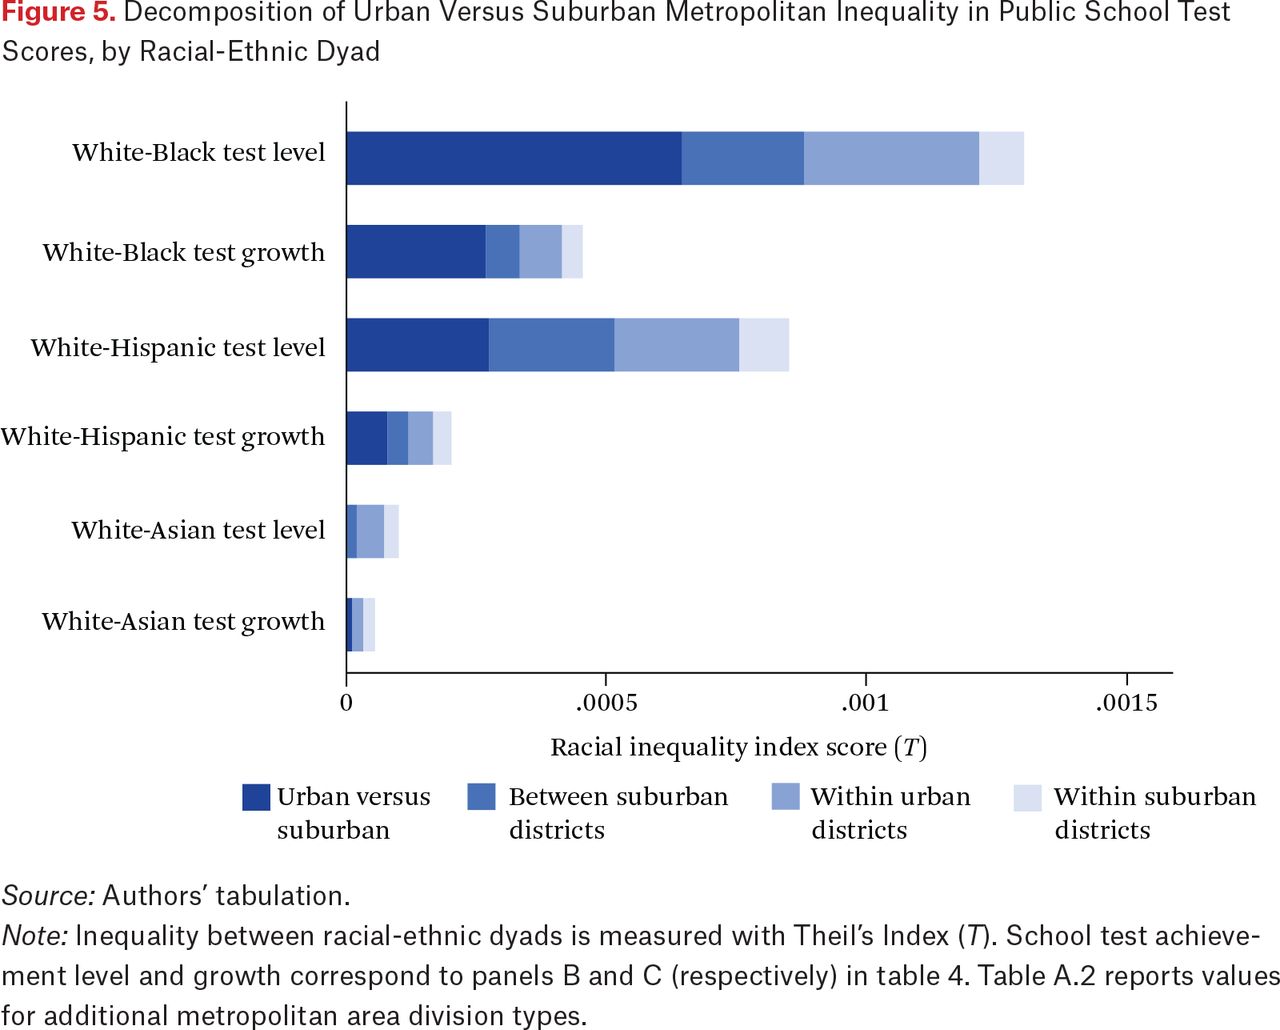
Decomposition of Urban Versus Suburban Metropolitan Inequality in Public School Test Scores, by Racial-Ethnic Dyad
Source: Authors’ tabulation.
Note: Inequality between racial-ethnic dyads is measured with Theil’s Index (T). School test achievement level and growth correspond to panels B and C (respectively) in table 4. Table A.2 reports values for additional metropolitan area division types.
T measures how even FRPL rates are among schools, and one important caveat is that most FRPL inequality occurs within racial-ethnic groups, not between them (on this point, see Hanselman and Fiel 2017). That is, FRPL rates vary between schools serving students of the same race-ethnicity, as well as between schools serving students of different races and ethnicities. Our analyses focus on whether the urban-suburban divide creates racial-ethnic inequality in children’s neighborhood and schooling experiences, so we focus here only on between–race-ethnicity inequality.
Decomposition of White-Black Inequality in School Percent FRPL and Achievement Test Level and Growth
Table 4, panel A presents results for school FRPL composition inequality among White and Black students. The metric of T is specific to the variable analyzed, so the component decomposition is more substantively meaningful than the total level. Inequality between urban and suburban schools accounts for 51 percent of total inequality in school FRPL composition between White and Black students. That is, to the extent that White and Black students attend schools with different FRPL compositions, about half of that is due to differences between urban and suburban schools. Underlying these patterns are the intersecting forces of racial-ethnic segregation and socioeconomic inequality. The average FRPL rate in urban schools, where Black students are more highly concentrated than White students, is 69 percent; in contrast, the average FRPL rate in suburban schools, where White students are more highly concentrated than White students, is 48 percent (table 1). Thus, disproportionate concentrations of Black and White students—as well as disproportionate levels of Black economic disadvantage (especially in urban areas), leads Black students to have particularly high rates of exposure to peer FRPL in urban schools.
Interestingly, the average difference in FRPL rate between White students’ urban and suburban schools is 13 percentage points, relative to 16 for Black students. That is, attending suburban versus urban schools provides a greater reduction in school FRPL composition for Black students than for White, even though in absolute terms Black suburban students are still exposed to higher FRPL rates than White students are. Consistent with the segregation results, racial-ethnic inequality between suburban districts is also significant. More than a quarter of White-Black inequality in school FRPL rates occurs between suburban districts. Although poverty has “suburbanized” in recent decades, it has not done so equally across suburbs, creating higher- and lower-income suburbs, with Black families often living in poorer suburbs. Returning to the example of the St. Louis CBSA, the average FRPL rate is 65 percent in Black suburban students’ schools versus 34 percent in White suburban students’ schools. This finding is consistent with research showing that Black children have higher exposure to poverty in neighborhoods and school districts even if they move out of racially or ethnically isolated cities; these families may still live in suburbs that are relatively poorer or poverty-adjacent (Pattillo 1999; Reardon, Fox, and Townsend 2015; Sharkey 2014). As Angela Simms (2023, this issue) shows, differences in the economic power between White and Black suburban families can lead to substantial differences in educational services between racially-ethnically segregated suburban districts.
Figure 4 presents these results graphically for White-Black inequality in the top bar, followed by White-Hispanic and White-Asian inequality in school FRPL rates. Like results for segregation, inequality in school FRPL rates is greater between White and Black students than White and other groups. White and Asian students have much lower inequality in school FRPL rates, attending schools with similar mean rates (38 percent for the average White student versus 41 percent for Asian students). Urban-suburban inequality accounts for a smaller proportion of total White-Hispanic (39 percent) and White-Asian (25 percent) inequality (for full results for all racial-ethnic dyads, see table A.2). Figure 4 also emphasizes that inequality between suburban districts is a considerable source of school FRPL rate inequality between White and non-White students, accounting for one-quarter to one-third of total racial-ethnic inequality in school FRPL rate, depending on racial-ethnic dyad. Altogether, results show that White students attend schools with lower FRPL rates than non-White students, and that one reason is the uneven sorting of White and non-White, especially Black, students across urban and suburban districts and among suburban districts of different socioeconomic status.
Panels B and C of table 4 turn from school composition to measures of school test score achievement. Panel B of table 4 reveals that Black and White students attend schools with unequal test score levels—the average Black student’s school has a mean test score one standard deviation below that of the average White student (though, as noted, the bulk of inequality in school test scores occurs among the schools of students of the same race-ethnicity). The urban-suburban divide is a substantial source of inequality, accounting for half of the total. Test scores are about 20 percent of a standard deviation higher in suburban schools than in urban ones for White students, while the urban-suburban differences are about half a standard deviation higher for Black students. Thus the urban-suburban divide accounts for a large proportion of White-Black inequality in school test score levels both because Black students are less likely to attend suburban schools, which have higher test scores, and because suburban schools provide a greater test score advantage for Black than White students.
Turning to test score growth, urban-suburban inequality accounts for 59 percent of total White-Black inequality, a greater share attributable to this divide than for segregation, FRPL composition, or test score level. First, total racial-ethnic inequality in school average test score growth is much smaller than test score level, only about one-third as large (and racial-ethnic inequality in both test score measures is smaller than for FRPL exposure). This affirms other research showing that test score level often reflects student body composition and large racial-ethnic inequalities in home or neighborhood resources, whereas students of different racial-ethnic groups do not attend schools of markedly different quality or effectiveness, as measured by test score growth (Downey, Quinn, and Alcaraz 2019; Hanselman and Fiel 2017). That said, inequality between suburban and urban schools accounts for more than half of the existing inequality. As for test score level, the difference in the urban and suburban schools of White students is not that large, whereas suburban schools provide a more substantial advantage for Black students.
Figure 5 presents the White-Black inequality results of table 4 as well as for White-Hispanic and White-Asian inequality. For all racial-ethnic dyads, inequality in test score levels is much larger than test score growth. Urban-suburban inequality accounts for a significant proportion of White-Hispanic inequality in test score level (32 percent) and growth (39 percent), though not the majority like for White-Black inequality. Urban-suburban inequality is actually slightly negative for White-Asian test score level, indicating that the distribution of school test scores is actually closer to equal between urban and suburban sectors than overall among schools. Inequality between suburban and urban school test score growth accounts for about 20 percent of overall inequality in White and Asian students’ schools. Figure 5 also demonstrates that inequality among suburban districts is not as stark for test scores as it is for segregation and FRPL composition. In fact, inequality between schools within urban districts accounts for a greater or similar proportion of inequality in test score levels and growth as inequality between suburban districts for all racial-ethnic dyads.
CONCLUSION
Historically, the urban-suburban divide has delineated meaningful racial-ethnic inequality in U.S. metropolitan areas. Our examination of modern-day suburban and urban school districts adds complexity to the urban-suburban dichotomy.
On the one hand, a substantial portion of public school segregation and residential segregation—more than a third for Black-White segregation—in metropolitan areas is due to segregation between a single urban district and all suburban districts. Suburban school poverty rates are lower, while suburban schools’ test score levels and growth are higher than those of urban schools, and the urban-suburban divide accounts for half of Black-White inequality in these measures. This finding demonstrates persistence in the historic role of suburbs as havens of White exclusion and as an exit pathway for White flight from cities where Black migration increased. The urban-suburban divide is a weaker stratifying force for Asian-White and Hispanic-White comparisons, perhaps because Asian and Hispanic populations grew most precipitously in an era of immigration that followed racialized suburbanization.
On the other hand, inequality between suburban districts is an important stratifying factor as well. More than a third of Black-White segregation and substantial proportions of racial-ethnic inequality in school FRPL rate and test scores occur among suburban schools, especially between suburban districts. The suburbs are not a monolith (Frankenberg 2012; Hanlon 2009), and though the suburbs as a whole have become more racially and ethnically diverse and seen rising poverty rates, population flows have not occurred equally to and from all suburban communities. Sorting between and within suburban communities is an important part of metropolitan inequality, and researchers should move away from emphasizing a single urban-suburban divide to investigate inequality both between and within these sectors. One challenge to this effort is that researchers rarely define and operationalize a precise geography of suburban versus urban communities (Airgood-Obrycki, Hanlon, and Rieger 2021). We address this challenge here with a systematic review of school district geographies. In addition to the descriptive insights revealed, we encourage future researchers to use the supplementary online geographic dataset we have provided that identifies urban school districts and classifies metropolitan areas by their urban or suburban school district configuration.
Other important tasks remain for researchers. First, this article focuses on recent, cross-sectional segregation and inequality. The growing racial-ethnic and economic diversification of suburbs over the past few decades suggests that patterns of segregation and inequality within and between urban and suburban school districts likely changed over time. Future research should examine changes in both which districts are suburban according to our classification system, given that population changes and district secession or consolidation may have occurred, and racial-ethnic segregation and school inequality between and within urban and suburban districts. Daniel Lichter, Brian Thiede, and Matthew Brooks (2023) provide a model for analyzing trends that would work well with our existing framework; Erica Frankenberg and her colleagues (2023, this issue) demonstrate the importance of examining the causes and consequences of changes to administrative boundaries, such as school districts or attendance zones.
Second, this article focuses on differences among Black, Hispanic, and Asian students and White students. Inequality among non-White groups (such as between Black and Hispanic children) also exists within and between urban and suburban school districts, though these patterns may emerge through different processes than White–non-White inequalities, depending on each group’s timing and prevalence of suburbanization, immigrant incorporation, and complex relational dynamics with other non-White communities. Documenting additional racial-ethnic comparisons is important for understanding whether, how, and for whom the racial-ethnic diversity of suburbs translates to racially-ethnically integrated and equal places. Third, although we document segregation and school inequalities between and within urban and suburban school districts, we do not examine the factors that lead to these inequalities. This is an important area for future research—for example, how do school inputs like funding, teacher instruction, or curriculum vary between districts? Work by Simms (2023, this issue) provides a valuable case study that suggests racial-ethnic differences in social and economic power across segregated suburban districts helps explain the inequality dynamics, but more work is needed. Other work could examine how housing policy or regional political structuring contribute to inequalities between municipalities.
Finally, this study takes a macro-level perspective to describe the links between suburbanization, segregation, and racial-ethnic inequality in the United States. We focus on metropolitan areas whose school district geography fits a traditional urban-suburban schematic (most metropolitan areas), but within this set, our summary statistics mask important variation and mechanisms. We hope that future efforts to understand suburban and urban educational dynamics build on (or improve on) our national framework to provide place-specific accounts of suburban inequality. Doing so will help us move from the classic, simplified urban-suburban schema into a more nuanced understanding of segregation and inequality, where urban and suburban school districts interlock to form spatially stratified geographies of opportunity.
Apart from the methodological and empirical inroads this article makes—and the new areas of inquiry it opens—we conclude here with a broader comment about the complex relationships involving race-ethnicity, geography, education, and housing policy. Jurisdictional boundaries, both municipality and school districts, are key drivers of racial-ethnic inequality in opportunities and outcomes, including in education. Moreover, jurisdictional boundaries are also the result of racial-ethnic inequality: boundary lines are often drawn to preserve advantaged groups’ advantages, such as majority-White school district secession or political district gerrymandering. Boundaries create real inequalities in the types and affordability of housing that is built, the funding regimes for public goods, and the political appetite for integration. Policies that overcome these barriers may be necessary to achieving inequality. For example, the Metco program is a voluntary school integration program between disadvantaged neighborhoods in Boston and its more advantaged suburban neighborhoods. Magnet schools in San Antonio, Texas, and Hartford, Connecticut, have been successful in drawing in advantaged families from the suburbs to the city school districts. These policies are promising but largely voluntary; past legal decisions and the structure of school district and jurisdictional governance limit the progress that can be mandated. Moreover, the urban-suburban divide has dominated regional policy discussions, while inequalities between suburban communities have been neglected. Integrating and equalizing places remain vexing policy challenges, and regional, cross-sector policy responses will be key in reducing the pernicious persistence of the urban-suburban divide while amplifying the need to curb suburban inequality.
Appendices
Decomposition of School and Residential Segregation Between Racial-Ethnic Dyads by Metropolitan Division Urban-Suburban School District Geography
Decomposition of School Inequality Between Racial-Ethnic Dyads by Metropolitan Division Urban-Suburban School District Geography
FOOTNOTES
↵1. Oliver Brown, et al. v. Board of Education of Topeka, et al., 347 U.S. 483 (1954).
↵2. Milliken, Governor of Michigan, et al. v. Bradley, et al., 418 U.S. 717 (1974).
↵3. We focus on fourth graders to capture segregation and inequality among a single cohort of children at the elementary school level, where the link between residential location and school assignment is most common. Combining multiple grades can conflate segregation with variation in the grade structure offered at schools within a district (Stroub and Richards 2013). Private schools are schools not supported by public funds.
↵4. The CCD provides school district administrative codes, which often match the geographic district. In some cases, these codes identify a broader administrative boundary (such as a charter school network) rather than the school district for whom the school provides educational services. For this reason, it is conventional to identify school districts using this geographic approach (see Reardon, Kalogrides, and Shores 2019).
↵5. We exclude CBSAs classified as micropolitan, as well as three CBSA metropolitan areas or divisions where multiple districts cover both urban and suburban places: Wilmington, Delaware; Jacksonville, North Carolina; and Elgin, Illinois. This excludes thirty-four districts (17,098 fourth graders) from the analysis.
↵6. As a result, metropolitan area delineations in this study are modified. School district boundaries are unchanged.
↵7. Nationally, about 3 percent of Black Americans and 1 percent of Asian Americans of all ages identified as Hispanic in the 2012 to 2016 data (U.S. Census Bureau 2017, table B03002).
↵8. H can also measure segregation among all racial-ethnic groups, but these multiracial indices mask which groups drive segregation patterns. We chose to measure segregation by dyad because the historical development of suburbs privileged White families, warranting a focused examination of their separation from Black, Hispanic, and Asian families.
↵9. We favor this strategy over using district locale codes provided by the CCD (which are used, for example, in Reardon, Yun, and Eitle 2000; Bathia et al. 2023, this issue). The locale codes use location addresses to classify schools into four main categories: principal city, suburban, town, and rural. NCES then classifies school districts as city, suburban, town, or rural based on which type of school the majority of students attends. Under this framework, many metropolitan areas have several urban districts whereas others have no urban districts, and these classifications may not map onto local delineations of urban and suburban. Our strategy aligns more closely to theoretical interests in the urban versus suburban geography as a relational choice set.
↵10. We do not have nationwide data on private school FRPL receipt or standardized exams, so the analysis of inequality focuses on public schools only.
↵11. Evaluating change in annual measures of student performance is imperfect because it combines differences that occur over the school year along with differences that occur over the summer. Learning loss in the summer is more common among low-SES children, suggesting that SES differences in home environment are more salient when school is out of session and that this form of inequality is reduced during the academic year. An accurate measure of school effectiveness should account for this summer learning gap, but it requires exams twice per year (fall and spring) which is uncommon across school systems (Downey, von Hippel, and Broh 2004). School growth scores have been suggested as the best measure of school learning effectiveness that is standardized and that is widely available (Reardon et al. 2021).
↵12. Five CBSAs are classified as single urban school district even though they do not meet the 50 percent of place + 50 percent of district thresholds. We consider the Indianapolis City Schools District and the Oklahoma City Schools District to be the urban districts serving those places, even though they serve only about 36 percent and 44 percent of their respective cities, due to their names signaling a strong urban-suburban divide. Kentucky has a “county” and an “independent” school system that distinguishes between districts serving cities and the remainder of CBSAs, so we classify Bowling Green Independent School District and Elizabethtown Independent School District as the urban district of their respective CBSAs even though they do not serve the majority of the population. Finally, in North Carolina, we consider the Asheville City district to be the urban district of its CBSA because it is almost entirely within the city limits and serves 46 percent of the city, splitting with the county district.
↵13. Datasets may be downloaded at https://peter-rich.com/data/rsf_owens&rich.zip.
↵14. Total public school segregation in panel B (33.31) does not equal segregation among all public schools in panel A (31.32). This is not an error—it occurs because H measures population unevenness at each geographic level relative to the total metropolitan population; panel B’s total metropolitan population differs from panel A because it excludes private school students. The substantive difference in our findings is minor, but this illustrates that panel B generalizes only to children attending public schools.
- © 2023 Russell Sage Foundation. Owens, Ann, and Peter Rich. 2023. “Little Boxes All the Same? Racial-Ethnic Segregation and Educational Inequality Across the Urban-Suburban Divide.” RSF: The Russell Sage Foundation Journal of the Social Sciences 9(2): 26–54. DOI: 10.7758/RSF.2023.9.2.02. Authors contributed equally to this article. The authors are grateful to the volume editors and participants in the volume conference at the Russell Sage Foundation for constructive feedback. Direct correspondence to: Ann Owens, at annowens{at}usc.edu, Department of Sociology, University of Southern California, UPC MC 1059, Los Angeles, CA 90089-1059, United States; Peter Rich, at peter.rich{at}cornell.edu, Jeb E. Brooks School of Public Policy, Cornell University, Martha Van Rensselaer Hall, Ithaca, NY 14853, United States
Open Access Policy: RSF: The Russell Sage Foundation Journal of the Social Sciences is an open access journal. This article is published under a Creative Commons Attribution-NonCommercial-NoDerivs 3.0 Unported License.
REFERENCES
In this issue


Jump to section
Related Articles
Cited By...
- No citing articles found.