Abstract
Lack of preparation in science leads to high rates of attrition among science, technology, engineering, and mathematics (STEM) majors, even among students who are highly oriented toward STEM. Using data for twenty-seven countries from the 2006 Program for International Student Assessment, we compare the United States with other industrialized countries in terms of fifteen-year-olds’ science achievement and their expectations to focus on STEM in the future. The United States trails most countries in the mean science achievement of the general student population and among students expecting to pursue STEM majors or careers. Lack of curricular standardization in the United States is related to this lower science achievement. Countries with higher curricular standardization exhibit higher average science achievement scores; science achievement and students’ future orientation toward science are also better aligned in these countries. We discuss the implications of these findings for American colleges and universities as they seek to reduce student attrition in STEM fields.
- STEM attrition
- curriculum
- standardization
- science achievement
- cross-national research
In response to growing concern about the declining U.S. competitiveness in the global economy (National Academy of Sciences 2007), in 2009 the Obama administration launched the Educate to Innovate campaign to improve the participation rates and performance of U.S. students in science, technology, engineering and math (STEM). More recently, the President's Council of Advisors on Science and Technology urged institutions of higher education to increase the rates of students earning degrees in STEM fields. The council predicts that the United States needs more than a million STEM professionals over the next decade than are currently projected if the country is to remain a global leader in science (Olson and Riordan 2012).
About half of all college students in science, technology, engineering and math leave STEM fields before completing a college degree. Using data that tracked students from 2003 onward, the U.S. Department of Education reported that while 28 percent of all bachelor's degree candidates declared a STEM major, nearly half (48 percent) of this group had left STEM fields by 2009. Among these STEM leavers about half switched to a non-STEM degree and half dropped out of college. While the attrition rate in STEM is similar to attrition rates for other majors, increasing STEM retention in college by even a small percentage could be a cost-effective way to produce the STEM professionals that the nation needs (Chen and Soldner 2013).
Lynn Reimer and her colleagues (this volume) focus on one potential way to increase student retention in STEM—improving the learning experiences of students in undergraduate STEM courses. Although enhancing undergraduate STEM courses could help reduce the high rates of attrition from STEM majors, even the best instruction in undergraduate courses may come too late for students who arrive at college with a lack of science knowledge and preparation. Research finds that lack of preparation in science leads to high rates of departure from STEM fields, even among students who are highly oriented toward STEM (Chen and Soldner 2013). Thus the very diverse levels of science proficiency that American students bring with them to college create an additional challenge for colleges and universities as they seek to increase the rates of students earning degrees in STEM fields.
This paper examines student science achievement in the precollege years, focusing on students who indicate they plan to major in science or pursue a science career. It compares the United States with other industrialized countries in terms of science achievement and determines the degree to which cross-national variations in standardization of the curriculum are related to science achievement, net of other country-level factors such as teacher quality and economic development. Curricular standardization refers to the degree to which students within a nation are exposed to the same curriculum. In this paper, we distinguish between three degrees of curricular standardization: educational systems in which the central government determines the curriculum for all students in the nation; educational systems in which regional or local agencies have some ability to adapt the centrally mandated curriculum; and educational systems in which there is no central government intervention in designing the curriculum, such that students within the same nation may be exposed to very different curricula. We then examine cross-national variations in students’ future orientations toward STEM to determine whether curricular standardization is related to the alignment of students’ science achievement with their plans to pursue a STEM major or career. We use data from the Program for International Student Assessment (PISA) 2006. In addition to assessing the science achievement of fifteen-year-olds in fifty-seven countries, PISA collects extensive data on student backgrounds and their expectations about the future. Conducted by the Organization for Economic Development and Cooperation (OECD) and widely used in comparative research on education, PISA is considered to be the best source of comparative cross-national data on adolescents’ science achievement, orientations toward science, and their educational experiences more generally. These data do not allow us to establish a direct causal link between curricular standardization and the propensity of students to choose STEM fields. However, if among similarly situated students, those in countries with more standardized curricula are more likely to major in STEM fields, the correlation would be consistent with the hypothesis that curricular standardization is related to differential rates of choosing STEM majors. Future research could build on this preliminary evidence to understand how structural variations in educational systems matter for student preferences and other outcomes.
Our analyses indicate that the mean science achievement scores of both the general student population and students aspiring to enter STEM fields are lower in the United States than in most other developed countries. This outcome is related, in part, to the lack of standardization of the curriculum in the United States. We find that countries in which all students are exposed to a more standardized curriculum in primary and secondary school have higher average science achievement scores, net of other factors. In these countries, students’ science achievement and future orientation toward science are also better aligned, in that higher achievers are significantly more likely to consider pursuing a STEM major or career than lower achievers. In countries that lack a standardized science curriculum, such as the United States, the greater diversity of science preparation for students who arrive on campus expecting to pursue a STEM degree poses a challenge to college and universities; we discuss the implications of these findings for higher education institutions as they seek to reduce student attrition in STEM fields.
BACKGROUND
It is well established that individual educational and occupational choices are shaped during adolescence, when students start to clarify their personal identities and ambitions. Proficiency in science and expectations to pursue a science career during the adolescent years are especially important precursors to the subsequent likelihood of completing a STEM degree in college. Using nationally representative data that followed students from eighth grade to young adulthood, Robert Tai and his colleagues (2006) examine whether science-related career expectations among eighth graders predicted the field of the college degrees they earned several years later. Among students who earned a bachelor's degree, those who as eighth graders expected to have science-related careers at age thirty were 1.9 times more likely to earn a life science degree than those who did not expect a science-related career and 3.4 times more likely to earn physical science and engineering degrees than students without such expectations.
The Tai and colleagues findings underscore the importance of the alignment between achievement and expectations in predicting the likelihood of earning a college degree in science. Fifty-one percent of all high achievers (those who scored at least one standard deviation above the average in math) who also expected to pursue science-related careers completed a bachelor's degree in the physical sciences or engineering. In contrast, 34 percent of average achievers who expected a science-related career attained such a degree. Only 19 percent of high achievers who expected a nonscience career and 10 percent of average achievers who expected a nonscience career attained a degree in the physical sciences/engineering (Tai et al. 2006, 1144).
Using longitudinal data that followed students over their college years, Todd Stinebricker and Ralph Stinebricker (2011) find that when students enter college they are as open to a math or science major as they are to any other, but many students move away from math and science after realizing that their grades in that field will be substantially lower than they expected. Further, changes in beliefs about grade performance tend to arise because students realize that their ability in math and science is lower than they thought rather than because they realize that they are not willing to put substantial effort into math or science majors. These findings suggest that students are more likely to be pushed out of STEM fields due to their poorer than expected performance, thus leading to high rates of attrition from STEM majors. Along with prior achievement, race and gender matter; much research has examined gender and racial differences in science achievement and expectations in an attempt to understand why women and minorities remain underrepresented in STEM fields (Maple and Stage 1991; Xie and Shauman 2006).
Beyond individual-level factors, the structure of educational systems has been found to be related to individuals’ performance and preferences, as well as the variation in these factors across the student population. For example, nations vary greatly in the degree of standardization in their educational systems.1 In highly standardized systems, all students are exposed to a standardized curriculum and learning standards are mandated by a centralized body. In many standardized systems, to gain a given credential, students are also required to demonstrate their curricular knowledge by passing exit examinations centrally administered by an education authority. Students’ exam performance may also determine university admission and preferred fields of study (Bishop 1997, 2006).
Research finds that nations with standardized curricula and exit exams tend to have less inequality in student performance. Some evidence suggests that standardization is related to smaller performance gaps among secondary students from different class backgrounds (Ayalon and Gamoran 2000) and smaller gender inequalities in math achievement (Ayalon and Livneh 2013). Other research finds that standardization is related to smaller negative effects of tracking (Bol et al. 2014) and reduces opportunities for school decision makers to favor their own interests over student performance (Wößmann 2005).
The potential benefits of standardization can be illustrated from the perspectives of students, parents, teachers, and schools. For students, standardized curricula and examinations serve as incentives or extrinsic rewards for them to take more rigorous courses and spend more time on homework (Bishop 2006). In standardized systems, students in different tracks and schools are exposed to the same curricula and standards, so their exposure to knowledge is much more equal (Ayalon and Livneh 2013). Moreover, when educational decisions are based on students’ performance in externally administered centralized examinations, parents have ample information on the performance of their children against an established standard (Wößmann 2005). As a result, both students and their parents may be better able to monitor their educational progress and gain a clearer understanding of how their achievement, as measured by test scores, compares to that of other students in the nation. Indeed, Hyunjoon Park (2008) finds that the greater accountability and transparency of standardized education systems enables parents and students from all socioeconomic backgrounds to assess and monitor the student's performance in comparison to established standards. Finally, in countries with a highly standardized curriculum, teachers and school administrators are not allowed to modify the content of curricula or exams according to students’ ability grouping (Stevenson and Baker 1991). Instead, teachers tend to invest much effort in helping all students meet nationally mandated standards, regardless of students’ ability level or class background (Bol et al. 2014).
In contrast to highly standardized educational systems found in much of the world, the U.S. educational system has long been marked by a lack of standardization. Historically, curricula, teacher training, learning standards and a host of other factors have been determined at the state and district level rather than the national level. This highly decentralized education decision-making leads to substantial variation in educational curricula across the nation. For example, in Kansas, debate has raged for years about whether to teach evolution, such that some students have not learned the principles of evolution and key biological concepts essential to a comprehensive science education (Subotnik, Edmiston, and Rayhack 2007).
Since the 1990s, however, the United States has been moving toward greater curricular standardization, at least at the state level. By the early 2000s, every state had developed and adopted its own learning standards and had a definition of proficiency requirements for each grade level and high school graduation. In an attempt to create greater curricular standardization, many state leaders agreed in 2009 to develop the Common Core State Standards. By June 2014, forty-three states had adopted unified, internationally benchmarked standards in math and language arts for kindergarten through twelfth grade with the goal of providing students with the necessary knowledge and skills for college and the workforce (Grossman, Reyna, and Shipton 2011). The development of standards for science is the next step in this process (National Research Council 2012). It is an open question whether the Common Core will fulfill the goal of a unified system of national curricular standards applicable to all states and districts and whether the purported benefits of greater curricular standardization will be realized.
Curricular Standardization, Science Achievement, and Expectations
Most research to date has considered how standardization relates to students’ achievement in mathematics or reading. We know of no research that has considered the relationship between curricular standardization and science achievement. It is reasonable to expect that in standardized systems, where all students are exposed to science and math curricula more equally and their course-taking patterns are more homogeneous, overall student achievement in science may be higher. Thus, we predict hypothesis 1: Countries in which all students are exposed to the same curriculum and standards exhibit higher mean science achievement. Additionally, a more standard exposure for all students to the science curriculum may mean that students cannot activate their preferences and thus avoid science coursework, thus we predict hypothesis 2: In countries where all students are exposed to a standard curriculum, gender and social class gaps in science achievement are smaller.
Finally, we predict that standardized systems may be more effective in strengthening the linkage between science performance and future orientation toward a STEM major or career such that in countries with standardized educational systems, high science achievers may be more likely to pursue science-based fields of study and careers. This is because they gain valuable information about their standing relative to the whole student population and are more likely to consider this information in their subsequent educational decisions and career choices. In contrast, in countries that lack curricular standardization, such as the United States, students receive weak and highly varied signals about their performance in specific academic domains and students’ science achievement and their interest in science should be less aligned. Thus we predict hypothesis 3: The higher the curricular standardization is, the greater the alignment of students’ science achievement and their future orientation toward STEM fields.
DATA AND METHODS
We compare the United States with several other industrialized countries on metrics related to students’ performance in science and their expectations to focus on STEM in the future. We then examine whether the alignment between adolescents’ science achievement and their plans to major in a STEM field in college vary with the institutional features of national educational systems, net of individual-level factors. One goal of this analysis is to examine whether the low level of standardization in the U.S. educational system is related, in part, to the high attrition rate of college students from STEM fields in the United States.
The main source of data for this study is PISA 2006, an international survey testing fifteen-year-old students’ cognitive skills on math, reading, and science. It collects data from all OECD countries and several non-OECD countries on one of the three subjects every three years. The latest survey to focus on science proficiency and engagement was completed in 2006 and included fifty-seven countries. Because we are interested in comparing the United States to other industrialized countries, we exclude countries whose gross domestic product (GDP) per capita is below $12,000 in 2005, as calculated by the World Bank (2005) to produce a sample of 211,766 students in twenty-seven countries.
The analyses proceed in three stages. First, we examine the descriptive statistics for all countries to see how the United States compares in terms of student science performance. We then select the subset of students in each country who indicate that they plan to major in STEM or pursue a STEM career, and describe the average science performance of this group of students who, on the basis of their plans, are most likely to pursue a STEM major in college. Finally, we use hierarchical linear modeling to examine whether national level variations in the organization of educational systems are related to adolescents’ science achievement and the alignment of science achievement with plans to major or work in a STEM field in the future, net of individual-level factors and other country-level factors.
Specifically, we determine whether the level of standardization of the educational curriculum within a country is related to mean student science achievement as well as a greater alignment of students’ science achievement with their plans to pursue a STEM major or career, such that students who score high on the science test are more likely to consider a future in STEM. For this analysis, we pool the twenty-seven countries and run a hierarchical linear model, adding two dummy variables—highly standardized curriculum and moderately standardized curriculum—as country-level independent variables, with unstandardized curriculum as the reference category. Again, these analyses do not establish causal relationships between curricular standardization and students’ science performance or their future orientation toward a science major or career. Although we control for several country-level factors for which data are available and that may be related to performance or future orientation, other unobserved country-level factors through which curricular standardization operates are possible. Nonetheless, these analyses can determine whether a correlation between curricular standardization and these outcomes, net of other factors, exists for a wide range of countries.
Variables
Future Orientation Toward STEM
We use the PISA future orientation index to measure students’ future plans to major in STEM or pursue a STEM career. It is based on students’ level of agreement with four statements: I would like to work in a career involving science; I would like to study science after secondary school; I would like to work on science projects as an adult; I would like to spend my life doing advanced science. This index is especially relevant to the study of how attitudes during adolescence translate into the subsequent choice to major in a STEM field or to pursue a STEM career later in life. The index was constructed so that the average OECD student has an index value of zero and about two-thirds of the OECD student population scored between the value of –1 and 1 (OECD 2007). A positive value indicates a student responded more positively to the questions used to comprise the index than students on average across all OECD countries; a negative value indicates that a student responded less positively than the OECD average.2
Science Achievement
The PISA data include comparable achievement scores for each student derived using state-of-the-art assessment methodology. Five plausible values of the science test score were used as a representation of the range of students’ science abilities. The plausible values transfer a point estimate of achievement to a distributional estimate of achievement. We make use of the plausible values of student science achievement in generating all descriptive statistics.
Curricular Standardization
Following Guillermo Montt (2011), we categorize national educational systems into three types: systems in which the central government determines the curriculum, systems in which regional or local agencies have some ability to adapt the centrally mandated curriculum, and countries in which there is no central government intervention in designing the curriculum. The information about curricular standardization is based on World Data on Education Edition 6 (UNESCO 2006). We generate a dummy variable for highly standardized systems, and a dummy variable for moderately standardized systems, to contrast with the unstandardized systems in our models. In seven of the twenty-seven countries, the central government has primary responsibility for determining the curriculum. The majority (sixteen) fall into the second category, where regional or local agencies have some ability to adapt the centrally mandated curriculum. In four countries, including the United States, the government has no responsibility for designing the curriculum or setting curricular standards.3 This curricular standardization measurement closely corresponds to whether a country has a central exit exam: three of the four countries where the government has no responsibility for designing curriculum also have no central exit examinations. Six of the seven countries where the government determines the curriculum also have central exit examinations.
This measure captures variation across countries in the degree to which students are exposed to the same or different content of learning. In countries where the curriculum is centrally determined, all students are exposed to the same science curriculum and in many cases, students are required to demonstrate their science knowledge on an externally based exit exam. In countries like the United States where curricular content is determined at the state and district level, variation in student exposure to science content is significant and evaluated with assessments that are also highly variable across states and districts. As the United States moves toward greater curricular standardization with the implementation of the Common Core Standards, the comparison of countries with different levels of curricular standardization may provide useful predictions of the possible impact of rising curricular standardization in the United States.
Individual-Level Controls
We control for a wide range of individual-level variables. In the analysis of science achievement, we include gender, immigrant status, family socioeconomic status (SES), science self-efficacy, science learning hours, and science activities as control variables. Prior research has established that females and immigrants tend to earn lower scores on science tests relative to males and native students (Levels and Dronkers 2008). In contrast, students from higher SES families have score advantages over other students. Students are coded as immigrants if they are either foreign born or native born to immigrant parents. Family SES is measured by an index of economic, social, and cultural status (ESCS index). PISA derived this index from student's home possessions, the highest level occupation of either parent, and the highest level of education of either parent expressed as years of schooling (OECD 2009).
Additionally, research has determined that students’ self-efficacy in sciences (Areepattamannil and Kaur 2012) as well as the time they spend in science-related activities and their knowledge about science-related careers (Kjærnsli and Lie 2011) are related to science achievement and may shape students’ future orientation toward STEM. Thus we include a measure of science self-efficacy, based on students’ ratings of the ease with which they believe they could perform eight specific scientific tasks. Science activities are measured by students’ reports of how frequently they watch television, borrow or buy books, visit websites, listen to radio, read magazines and newspapers, or attend a club related to science. Science learning hours is measured by the hours spent in science classes. In the analysis of future orientation toward STEM fields, we include these individual-level controls as well as controls for individual science achievement and career information about STEM fields in predicting future orientation. Coupled with high achievement in science, more information about science careers should boost understanding and preparation for a future in the field, and also reduce stereotypes about who goes into science (Kjærnsli and Lie 2011). This variable is derived from students’ reports of their level of information about science-related careers, the steps to take if they want a science-related career, as well as the kind of companies that hire people for science-related careers.4
Country-Level Controls
Although curricular standardization is the key independent variable of interest, we control for several other country-level variables to ensure that the relationships between standardization and the outcome variables are robust, net of these other factors. We include GDP per capita and Gini coefficient in 2005, which measure the level of economic development and economic inequality of a country. Research shows that more economically developed countries have higher quality educational systems and thus higher levels of achievement as measured by test scores (Baker, Goesling, and LeTendre 2002). At the same time, students (especially female students) in these countries are less likely to aspire to study in a STEM field or pursue a STEM career (Charles and Bradley 2009). In highly unequal societies, family resources may be distributed more unequally, which may contribute to the unequal performance and expectations among students from different social classes (Chiu and Khoo 2005). Also, the more unequal the gender distribution in college STEM fields within a country, the less likely fifteen-year-old girls may be to expect to enter STEM fields (McDaniel 2010). Thus we created a measure of the gender segregation in field of study for each country. This measure, based on OECD estimates (Vincent-Lancrin 2008), ranges from zero to fifty with an average of twenty-seven across all OECD countries in 2005.5
Teacher quality is related to students’ achievement (Goldhaber and Brewer 2000) and also may be related to their future orientation toward STEM fields. Countries such as Finland that earn high achievement scores on cross-national assessments are known for their high-quality teachers (Darling-Hammond 2010). We created an average teacher quality measure for each country indicating the number of teachers with a college degree or higher in each school in the country. Finally, prior research finds that the achievement of peers is related both to students’ own academic self-concept and to their actual achievement. When a student is immersed in an environment where peers generally have high achievement levels, a student's self-concept as well as her actual achievement may be depressed through the process of comparing herself to these high-achieving peers (Nagengast and Marsh 2012; Marsh and Hau 2003; Marsh et al. 2015). To account for this possibility, we aggregated the individual-level science achievement scores into a country-level science achievement score and include it in both hierarchical linear models (HLM). Moreover, some high-achieving countries (Japan and New Zealand, for example) tend to have below-average levels of self-efficacy, and some low-achieving countries (such as the United States and Portugal) tend to have above-average levels of self-efficacy. In the analysis where students’ future orientation is the dependent variable, we control for the national average of science self-efficacy because it is reasonable to assume that this pattern may reflect some country-level cultural aspects that affect student motivation and learning. The descriptive statistics of all variables are included in table 1.
Descriptive Statistics for All Variables Used in the Analyses
Methods
Our HLM analyses begin with a model that includes all individual-level variables in the model and allows for country-specific random effects. Then, we add country-level variables to the model and focus mainly on whether curricular standardization is related to different intercepts of student achievement or future orientation (γ01j). The final models add cross-level interactions to the previous model to assess whether the relationship between student achievement and future orientation significantly varies in countries with different levels of curricular standardization. This requires modeling the slope of science score to be predicted by curricular standardization (γ11j).6 We add interactions between curricular standardization and gender (γ21j) and SES (γ31j) to examine whether the gender gap and the social class gap in science achievement and science orientation differ by level of curricular standardization at the country level. The final HLM equation is as follows:

RESULTS
1. How do U.S. students compare with students in other countries in terms of science achievement?
Figure 1 shows the relationship between country-level mean science scores and standard deviation in science scores for the full student population surveyed in each country. The scenario of a high average and low variability in scores is optimal because it indicates that a large proportion of students are achieving a high level of science proficiency. Finland demonstrates this pattern most clearly and far exceeds all other countries in that it exhibits a high mean science score (563) and a low variability in scores (SD=85). Canada, Japan, Korea, the Netherlands, and Australia are also high-achieving countries in this regard. The United States, Great Britain, and New Zealand have relatively high standard deviations, meaning that students’ science scores vary substantially. But whereas the New Zealand shows high variability (SD= 107) coupled with high mean achievement (530), the United States has a low mean achievement score (489) relative to most other countries.

Mean Science Score and Standard Deviation, by Country
2. How do U.S. students who aspire to major in STEM and pursue STEM careers compare in terms of performance in science?
We have shown evidence for the high dropout rate of U.S. STEM students, and argued that it is in part because of a lack of mastery to science knowledge and skills at the earlier stages of education. The lack of mastery is undoubtedly reflected by the lower average science score for the United States. At the same time, many low performers may not expect to pursue a science field of study or career and thus will not enter the science pipeline. For this reason, it is useful to compare the achievement levels of students wanting to pursue a STEM major or career. For them to attain their goals, they need to have been well prepared in high school on basic science knowledge and skills to meet the academic requirements in college STEM fields. Students who aspire to major in STEM fields but have low science achievement scores are more likely to struggle in college STEM courses and are at much greater risk for switching out of STEM into other majors or dropping out of college completely. In fact, statistics from the U.S. Department of Education show that 48 percent of STEM majors leave their initial STEM field (Chen and Soldner 2013).
Figure 2 shows average science score by country for the subset of students who aspire to a science career according to whether their future orientation index is above average (index>0) (aspiring students). The average score of aspiring students in the United States is 500. Although higher than that of the full sample of U.S. students, the mean score of aspiring students in the United States is lower than those of their counterparts in most other developed countries including Australia (551), Canada (542), Finland (601), and Japan (566). Thus, even among students highly oriented toward STEM, the United States trails most other developed countries in science performance.
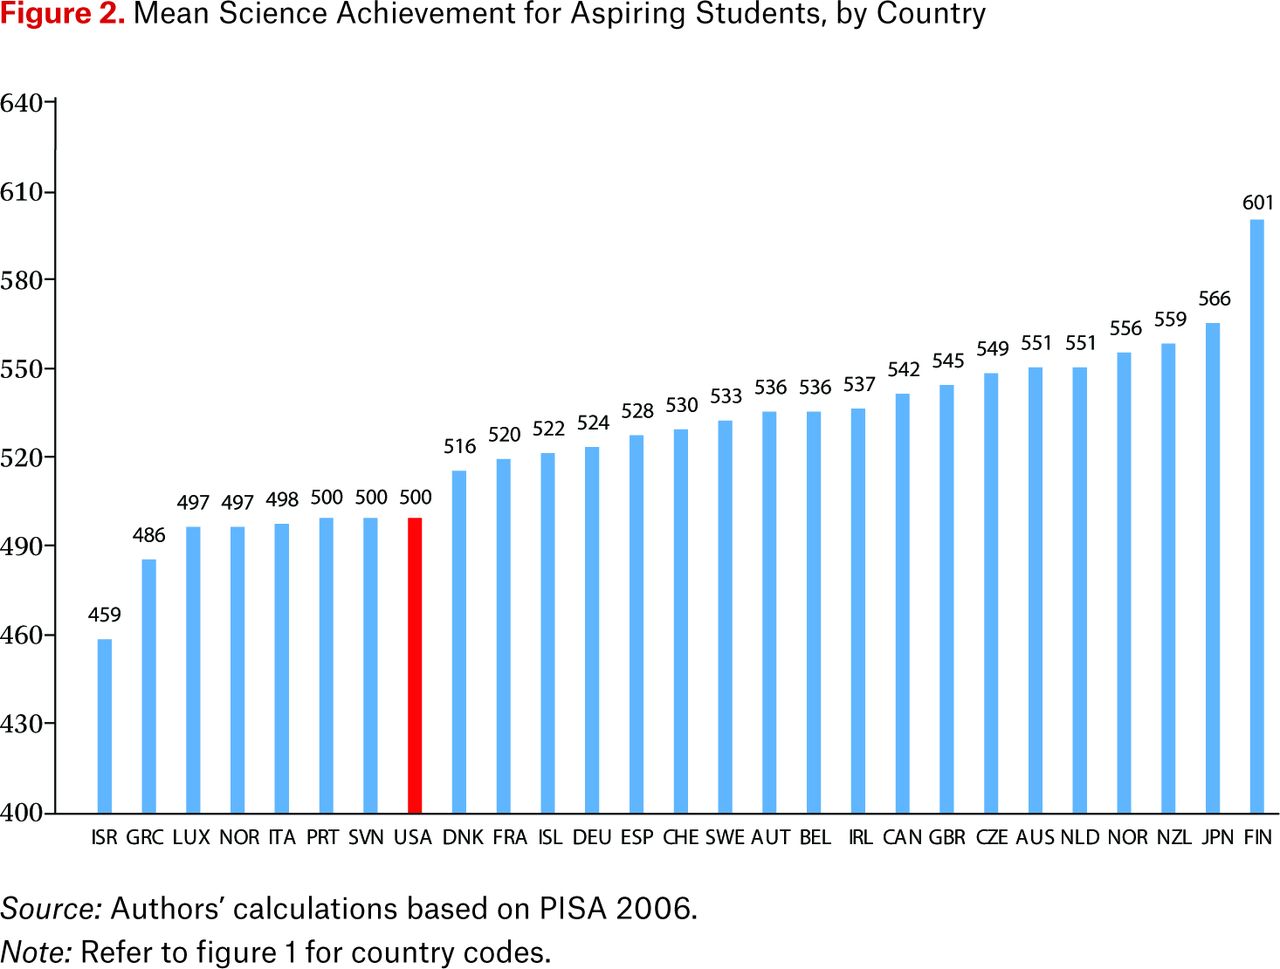
Mean Science Achievement for Aspiring Students, by Country
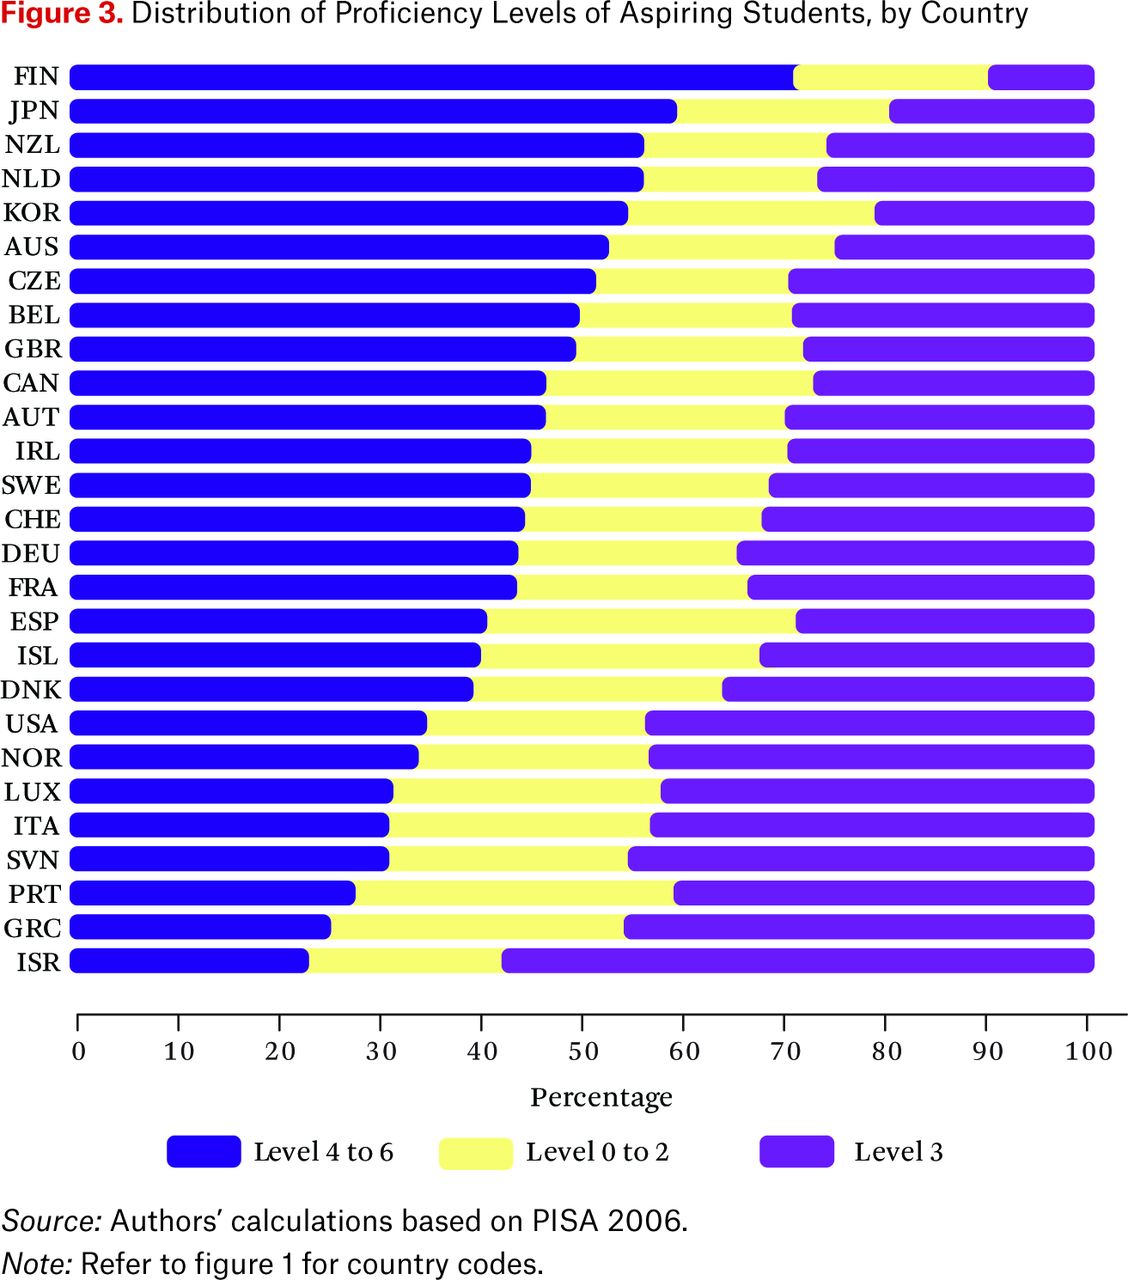
At the same time, if most aspiring students attain a level of proficiency in science that prepares them for college-level study in STEM, the lower average score itself may be less of a concern. For this reason, it is informative to compare aspiring students in the United States with aspiring students in other countries in terms of proficiency levels. PISA uses proficiency levels to interpret science test scores. The seven levels run from below level 1 (which we coded 0) to 6. According to PISA (OECD 2007), students at level 1 have only limited scientific knowledge that can be applied to a few familiar situations. At levels 2 and 3, they can clearly describe scientific issues in a range of contexts and apply simple models or inquiry strategies. At level 4, they can work effectively with situations and issues that involve explicit phenomena, and communicate decisions using scientific knowledge and evidence. Students who achieve proficiency levels 5 and 6 can consistently identify, explain, and apply scientific knowledge and knowledge about science in a variety of complex life situations. Moreover, they clearly and consistently demonstrate both advanced scientific thinking and reasoning and a willingness to use their scientific understanding to support solutions in unfamiliar scientific technological situations. Accordingly, the percentages of students attaining level 1 to level 6 across OECD countries are 94.8 percent, 80.8 percent, 56.7 percent, 29.3 percent, 9.0 percent and 1.3 percent. Figure 3 presents the distribution of proficiency levels for aspiring students in each country. To simplify the presentation, we combine levels 0, 1, 2, 4, 5, and 6 into larger categories. The U.S. numbers on level 4 or higher proves quite low. The majority are in the 0 to 3 range, clear evidence of a lack of proficiency for college STEM coursework. In contrast, Finland, Japan, and New Zealand have the highest percentage of aspiring students who reached proficiency level 4 or higher and much smaller percentages of students at proficiency levels 3 or lower. In sum, the U.S. educational system appears to be less efficient in aligning students’ future orientation toward STEM fields with their levels of science achievement. This situation could be one factor related to the high rate of attrition among college STEM majors in the United States.

Distribution of Proficiency Levels of Aspiring Students, by Country
3. Is the degree of curricular standardization related to the alignment of science achievement and future orientation toward STEM fields?
To speak to this question and the existing literature on the relationship between standardization and student performance, we first examine whether curricular standardization is related to higher overall student science performance. Table 2 shows the results from the HLM analysis predicting individual science performance. The first model includes only individual-level predictors. It shows that female students have lower achievement levels than male students, but the gap is very small (–1.5 points). Immigrant students lag behind native students by about 26 points. Students from higher socioeconomic families (27 points higher than lower SES families) and those who report higher science self-efficacy (27 points higher than low self-efficacy students) have significantly higher science scores. Not surprisingly, students who spend more hours learning science in class and who are engaged in more science activities also earn substantially higher science scores (13 points and 3 points respectively). These results align with previous findings that gender (Ayalon and Livneh 2013), immigrant status, socioeconomic status (Levels, Dronkers, and Jencks 2014), self-efficacy (Bishop 2006), and academic intensity (Montt 2011) matter for student performance in science.
HLM Estimates of the Relationship Between Individual-Level and Country-Level Factors and Science Achievement
The second model adds the dummy variables for standardization to the first model. Without controlling for other level 2 predictors, a moderately standardized curriculum is related to a 40-point gain in science performance, and a highly standardized curriculum is related to a 27-point gain in science performance. In countries where the average science achievement and teacher quality are higher, individual students’ science achievement is also higher. In countries where economic inequality as measured by the Gini coefficient is higher, individual students’ achievement is lower. No other country-level variables are significantly related to science achievement.
Model 3 adds other country-level controls to the previous model, and model 4 adds cross-level interactions. Individual-level predictors’ effects remain largely unchanged. However, with other country level controls added, science scores are no longer significantly higher in moderately standardized systems relative to unstandardized systems. In highly standardized systems, average science scores are 12 points higher than scores in unstandardized systems. Cross-level interactions show that in highly standardized systems, the gender gap in science achievement is reduced. The main negative effect of female (–0.92) is reduced by the positive interaction effect (2.23) between a highly standardized system and gender. On the other hand, it is in moderately standardized systems that the SES gap in science achievement is attenuated. With a negative interaction effect (–4.43), the main positive effect of family SES is reduced, indicating that such systems may allow for more educational equality across social classes. In sum, our analysis supports the argument that curricular standardization is related to improved individual student science performance, but it is significantly related to a smaller gender gap in science achievement in highly standardized systems, and to a smaller class gap in science achievement in moderately standardized systems, net of other individual and country-level factors.
Table 3 shows the results from analyses that examine future orientation toward majoring in STEM or pursuing a STEM career. Recall that the dependent variable is measured as an index with a mean of 0 and a standard deviation of 1, where values above 0 indicate a higher level of future orientation than average. In addition to examining the relationship between individual- and country-level factors and students’ future orientation toward STEM, these analyses address the question of whether curricular standardization is related to the alignment between students’ science achievement and their future orientation toward STEM. Table 3 presents four models. The first includes the same set of individual-level independent variables from table 2; the second and third models add the same set of country-level independent variables in table 2. The last adds three cross-level interactions: curricular standardization interacted with individual-level science score, curricular standardization interacted with gender, and curricular standardization interacted with SES. Of primary interest is the interaction between curricular standardization and individual-level science score: a significant positive interaction indicates that an increase in students’ science performance is related to a larger gain in their future orientation in standardized systems than in unstandardized systems.
HLM Estimates of the Relationship between Individual-level and Country-level Factors and Future Orientation toward Science
Because the future orientation variable is an index, the values of the coefficients are not directly interpretable. The directions of the relationships are telling, however. Model 1 shows that females and higher SES students are less likely to be oriented to a STEM field of study or career. Immigrants, students with higher achievement or self-efficacy in science, students who spend more hours studying science or who received more STEM career information, and those who are more involved in science activities are all more likely to have a future orientation toward STEM.
Model 2 includes only the two main level-2 predictors: highly and moderately standardized education systems. It shows that in both education systems, future orientation toward science is lower than that in unstandardized systems, and the differences are significant. It is not surprising to see these negative effects, given that we have discussed that in unstandardized systems such as the United States, students tend to have less realistic expectations or aspirations, usually not matched with a comparable level of achievement that will facilitate the realization of such expectations or aspirations.
Model 3 shows that the individual-level independent variables’ effects remain largely unchanged, and that several country-level variables are significantly related to future orientation. The more unequal a country (indicated by a higher Gini coefficient), the higher students’ future orientation toward STEM, possibly because they regard STEM as a mobility channel. The higher average science achievement and science self-efficacy, the lower students’ future orientation toward STEM. The negative relationship between national average achievement and personal future orientation speaks to the social comparison theory previously discussed. When compared with a group of high-achieving students, a student might underestimate her own ability for learning science, and thus be less oriented toward a STEM major or career. The negative relationship between the national average self-efficacy and future orientation might be driven by countries such as Japan and Korea that have low average self-efficacy but a high proportion of STEM college graduates and a large STEM labor force.
In the last model, curricular standardization is not related to the value of the intercept, but there is no reason to expect that it should be related to higher future orientations toward STEM for all students; rather we predict that in countries with higher levels of curricular standardization, students’ science performance and their future orientations toward STEM are better aligned. To investigate this possibility, model 3 adds the cross-level interaction of curricular standardization and student science achievement, along with two other cross-level interactions. As hypothesized, students’ achievement is better aligned with their future orientation in countries with higher levels of curricular standardization than similarly situated students in countries with less curricular standardization.
To put this finding in substantive terms, imagine a hypothetical comparison of four students of the same background except for their science proficiency levels and future orientations. The four students include a pair from the United States and a pair from France. Each pair has one student at proficiency level 3 and another at level 4. Because the average test score gap between level 3 and level 4 is about 75 points, and the coefficient for individual test score on future orientation is 0.001, we can expect the level 4 students to have higher future orientation than level 3 students. However, the advantage in future orientation for the level 4 student in France (which has a highly standardized curriculum) is significantly larger than for the level 4 student in the United States (with no standardized curriculum). In the United States, the level 4 student's future orientation is 0.075 higher than the level 3 student (0.001*75=0.075); while in France, the level 4 student's future orientation is 0.11 higher than the level 3 student (0.001+0.0005) *75=0.11). Considering that the real gap in future orientation between a level 3 student and a level 4 student in the United States is 0.21,8 a gap of 0.04 (0.11–0.075) is a considerably large effect. In other words, curricular standardization appears to be related to a stronger alignment between students’ future orientation toward STEM and their achievement in science.
DISCUSSION AND CONCLUSION
In terms of the science performance of the entire student population and the subset of students who expect to pursue STEM majors or careers, the United States trails many industrialized countries. We compared the United States with several other industrialized countries in terms of students’ science achievement and their orientation to focus on STEM in the future. The United States exhibits both lower mean science achievement and greater variation in science performance than most other countries in the sample (figure 1). Although aspiring students in the United States achieve more in the sciences than the general U.S. student population, their mean achievement and proficiency levels are still lower than those of their counterparts in other countries.
We then considered whether curricular standardization is related to student achievement in science and the alignment of student science achievement with their future orientation toward STEM. Countries with standardized educational systems generally have higher student achievement in science, as evidenced by significantly higher mean test scores. Additionally, more standardized educational systems show a stronger linkage between science performance and future orientation toward study or a career in science, such that high achievers in science indicate a greater likelihood of pursuing science-based majors and careers in the future. This relationship may be due in part to the fact that standardized systems provide students with valuable information about their standing relative to the general student population that students use in their subsequent educational decisions and career choices. These analyses do not establish causal relationships between curricular standardization and students’ science performance or their future orientation toward a science major or career. Moreover, beyond the individual- and country-level factors included in our models, other unexamined country-level factors through which curricular standardization operates may exist. At any rate, correlations are strong between curricular standardization and student science achievement as well as between curricular standardization and the alignment of science performance and future orientation toward study or a career in science, net of other factors, for a wide range of countries. It is possible that in countries that lack curricular standardization, such as the United States, students do not receive such clear signals about their performance in specific academic domains and thus their science achievement and their interest in science are less aligned.
In addition to standardization, the primary factor of interest here, other national-level features may well distinguish the performance and future orientations of students in some countries from others. For example, if in some countries STEM majors generate higher labor market returns, students may strive for better science performance in secondary school and may be more motivated to choose a STEM major in college in those countries relative to countries where STEM majors are not highly remunerated. It is also possible that major cultural differences between countries play a role in explaining the cross-national variations in students’ achievement and future plans to major in STEM and pursue STEM careers. While investigating these possibilities is beyond the scope of this paper, future research along these lines may prove fruitful.
At the individual level, students with higher levels of science self-efficacy and those who spend more time learning science and in science-related activities have higher science achievement scores, net of other factors (table 2). These findings suggest that devoting more hours of the school day to learning science and providing opportunities for students to engage in science-related activities may be promising avenues to boost student achievement in science. These recommendations align with those of research findings that students’ greater exposure to math and science courses in high school is significantly related to their grades in college-level science courses (Sadler and Tai 2007). That students’ information about science careers is significantly correlated with students’ expectations to pursue science majors or careers in the future, net of other factors (table 3), further suggests that providing concrete information about science careers and the skills needed for them may help adolescents align their skills and career expectations.
In light of the diversity of skills and preparation of incoming students, what can higher education do to improve retention rates in STEM fields? Many colleges and universities use placement tests to determine which students need more preparation via remedial coursework before enrolling in the first year gateway science courses, as Lynn Riemer and colleagues discuss elsewhere in this volume. Colleges and universities might consider expanding placement tests and programs that help bridge the gap in student science preparation prior to their enrollment in gateway science courses. Such steps, coupled with the improvements to instruction in gateway courses, as Reimer and colleagues suggest, may prove to be cost-effective ways to produce the STEM professionals the nation needs.
FOOTNOTES
1. Research has considered how two other aspects of the organization of national educational systems matter for individual educational outcomes: differentiation—how and when students are tracked between or within schools by ability level and vocational specificity—the extent to which the content of education is related to the knowledge of an occupation (Allmendinger 1989; Shavit and Muller 1998). These aspects are beyond the scope of this paper.
2. In other analyses (not shown) we used an alternative measurement of future STEM orientation: student responses to the PISA question asking what occupation they expect to attain by age thirty and coded students as expecting a STEM occupation versus expecting a non-STEM occupation. Because results using either indicator as the dependent variable in the analysis were markedly similar, we report only results using the future orientation index here, as this index captures a more holistic conception of future orientation, which includes students’ preference for a STEM field of study in college.
3. Systems in which the central government determines the curriculum include: France, Greece, Iceland, Italy, Luxembourg, the Netherlands, and Slovenia. Systems in which regional or local agencies have some ability to adapt the centrally mandated curriculum include Australia, Canada, the Czech Republic, Finland, Germany, Ireland, Israel, Japan, New Zealand, Norway, Portugal, Korea, Spain, Sweden, Switzerland, and the UK. Countries with no central government intervention in designing the curriculum include Austria, Belgium, Denmark, and the United States.
4. Family SES, science self-efficacy, science activities, and career information about STEM are measured by PISA indexes. As described, each index is scaled so that the average OECD student has an index value of zero and about two thirds of the OECD student population scored between the value of –1 and 1 (OECD 2007). A positive value indicates that a student responded more positively to the questions used to comprise the index than the average OECD student; a negative value indicates that a student responded less positively than the average OECD student.
5. The OECD source file does not provide estimates for Israel, Luxemburg, and Slovenia, so we assign these three countries the average value of the sample countries, which is 28.33.
6. In the actual model, the variable consists of two dummies, highly and moderately standardized systems, as indicated in the variable section. For simplicity, in the formula below we present them as one item.
7. This is a demonstration of the HLM analysis on future orientation. In the HLM analysis of science performance, test score is a dependent variable rather than an independent variable.
8. For the entire sample of countries, the gap between level 3 and level 4 ranges between 0.10 in Slovenia and 0.41 in Spain. Two-thirds of the countries have a gap in between 0.20 to 0.35. Country-specific data on these gaps are available on request.
- Copyright © 2016 by Russell Sage Foundation. All rights reserved. Printed in the United States of America. No part of this publication may be reproduced, stored in a retrieval system, or transmitted in any form or by any means, electronic, mechanical, photocopying, recording, or otherwise, without the prior written permission of the publisher. Reproduction by the United States Government in whole or in part is permitted for any purpose. Direct correspondence to: Siqi Han, Department of Sociology, The Ohio State University, 238 Townshend Hall, 1885 Neil Avenue Mall, Columbus, OH 43210, Han.607{at}osu.edu; and Claudia Buchmann, Department of Sociology, The Ohio State University, 211 Townshend Hall, 1885 Neil Avenue Mall, Columbus, OH 43210, Buchmann.4{at}osu.edu.
Open Access Policy: RSF: The Russell Sage Foundation Journal of the Social Sciences is an open access journal. This article is published under a Creative Commons Attribution-NonCommercial-NoDerivs 3.0 Unported License.