


Figure 6.
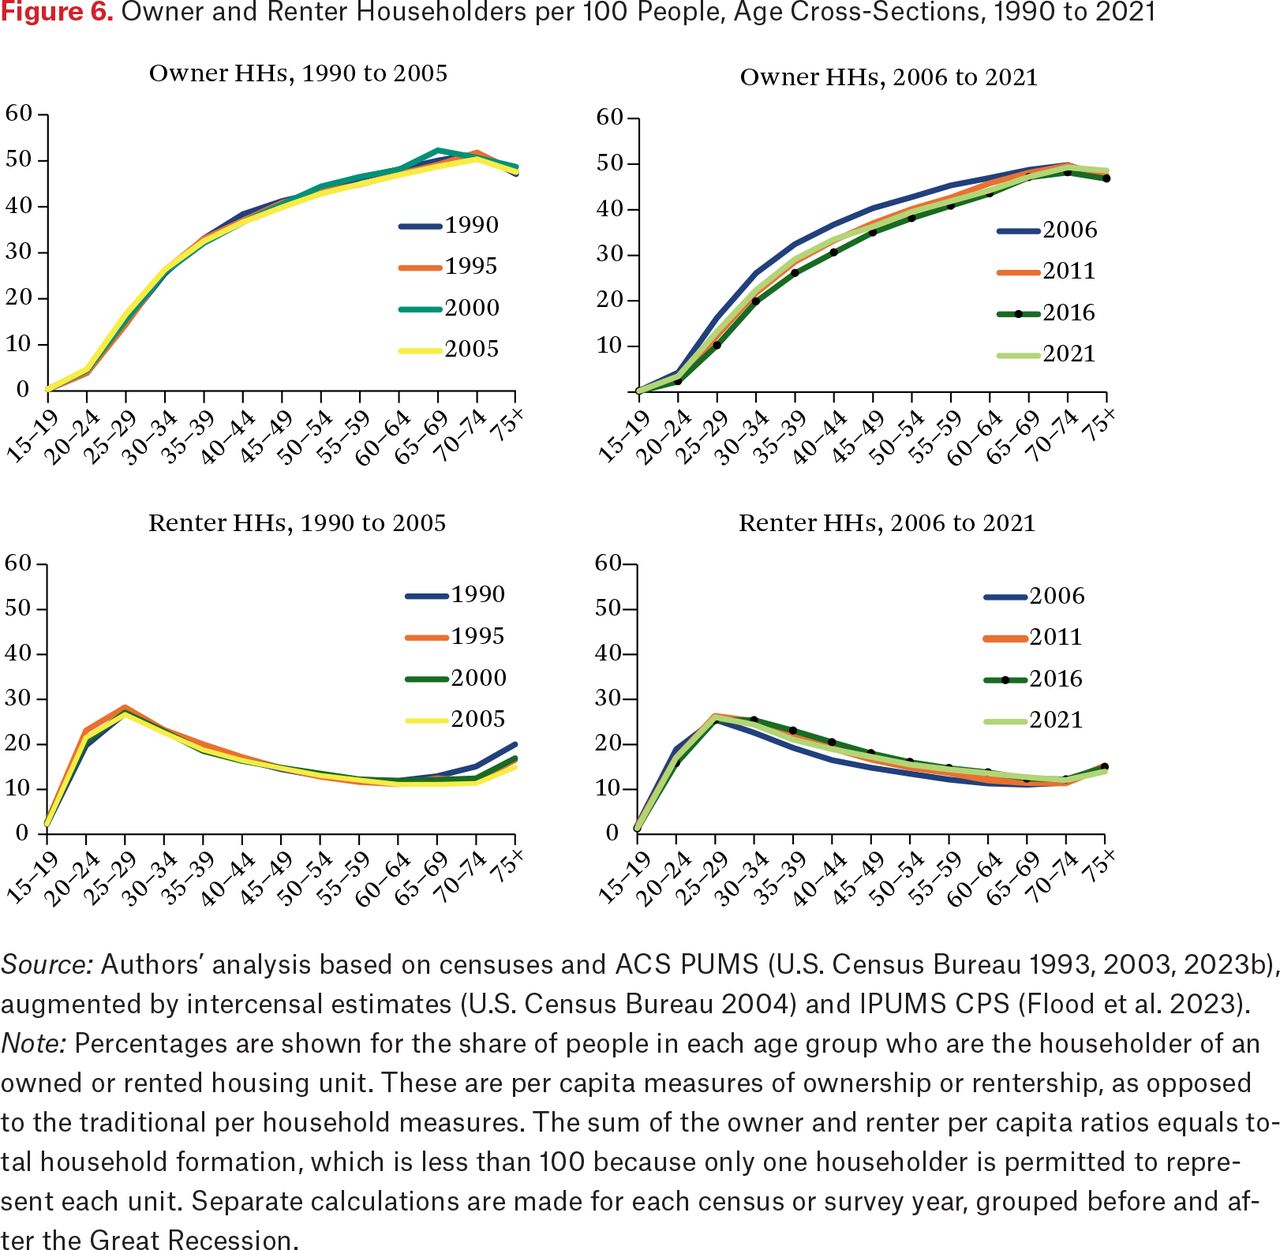
Owner and Renter Householders per 100 People, Age Cross-Sections, 1990 to 2021
Source: Authors’ analysis based on censuses and ACS PUMS (U.S. Census Bureau 1993, 2003, 2023b), augmented by intercensal estimates (U.S. Census Bureau 2004) and IPUMS CPS (Flood et al. 2023).
Note: Percentages are shown for the share of people in each age group who are the householder of an owned or rented housing unit. These are per capita measures of ownership or rentership, as opposed to the traditional per household measures. The sum of the owner and renter per capita ratios equals total household formation, which is less than 100 because only one householder is permitted to represent each unit. Separate calculations are made for each census or survey year, grouped before and after the Great Recession.


